Exports, News Headlines, Atlanta Fed, German Comment

They say its the strong $ that’s hurting exports.

I say it’s the drop in oil related capex after the price collapse:

er-10-6-2-1
er-10-6-2-2

This is what news headlines have been looking like (not good):

er-10-6-2-3
er-10-6-2-4
From Rüdiger (top German Specialist) research:

German new business orders for August were broadly lower. Compared to July, which was revised downward, they fell a seasonally adjusted 2.1pc. Compared to August 2014 orders rose 3.4pc.

However, there are two critical factors behind this figure. First, there was a huge positive base effect at work. Eliminating this statistical quirk orders would have been down an annual 0.2pc. Second, orders were helped by large scale orders for other vehicles“ (chiefly aircraft). Stripped for these orders the picture is even bleaker. It shows that the firming euro exchange rate has already significantly slowed orders from non-EMU countries.

The bottom line is that today’s order figures support our notion that the German economy is moving closer to recession.

Exports, Energy Layoffs, Tax data, Restaurant Performance Index

This is a prelude to the reality of soft exports and rising imports impacting GDP reports:

U.S. Goods Exports Plummet as Dollar Rises, Commodity Prices Fall

Sept 29 (WSJ) — Exports of goods slid a seasonally adjusted 3.2% to $123.09 billion as overseas sales of industrial supplies—which includes oil—autos, consumer goods and foods all fell, according to the Commerce Department’s advance report on trade in goods. Imports, meanwhile, advanced 2.2% to $190.28 billion on a surge in consumer goods and a smaller rise in capital goods, widening the trade gap. The goods deficit expanded 13.6% to $67.19 billion last month. The Commerce Department is due to release the full report on trade on Oct. 6.

This is still happening nearly a year after oil prices collapsed.

Energy layoffs still in progress, including nat gas companies:

Chesapeake cuts 15% of workforce on oil slump

Looks like historically this chart leads the cycle down:
er-10-1

Now looking like it’s faded after oil prices collapsed, vs expectations of the opposite:
er-10-2

Cartoon, US International Trade, India, Redbook Retail Sales, China Comments, Consumer Confidence

image (3)
As previously discussed, trade deficit increasing:

United States : International trade in goods

dt-9-29-1

Definition
The Census Bureau is now publishing an advance report on U.S. international trade in goods. The BEA will incorporate these data into its estimates of exports and imports for the advance GDP estimates. This is expected to reduce the size of revisions to GDP growth in the second estimates.

Just maybe the higher rates have been supporting the higher inflation? And supporting growth?

India cuts policy rate by bigger-than-expected 50 bps

Sept 29 (Reuters) — The Reserve Bank of India cut its policy interest rate to a 4-1/2 year low of 6.75 percent on Tuesday, in a bigger-than-expected move that, with inflation running at record lows, could help an economy in danger of slowing down.

A Reuters poll last week showed only one out of 51 economists had expected a 50 basis points cut in the repo rate , while 45 had expected a 25 bps cut.

The RBI had previously cut interest rates three times this year, lowering it by 25 basis points each time.

The RBI justified the bigger reduction, saying consumer inflation was likely be running at 5.8 percent, below the 6 percent target for January, thanks partly to the government’s efforts to contain food prices.

Redbook retail sales dismal and dragging along the lows:
image (4)

Barclays analysts visited China and came back saying it was one of the most bearish trips they’ve ever taken

Good number here but not confirmed by sales reports, at least not yet:

Consumer Confidence
dt-9-29-2

Japan Downgrade, China GDP Model, Earnings Reports, Italian Trade, Housing Starts, Rail Traffic, Fed Comment

Yields on JGB’s fall a bit with S&P downgrade. I’ve spoken to S&P. They know better. They are intellectually dishonest.
er-9-18-1
er-9-18-2

I included these as they give some indication of the macro outlook:

FedEx Trims Outlook on Weak Freight Demand

Sept 16 (WSJ) — FedEx said it expects adjusted earnings of $10.40 to $10.90 a share for the year ending May 31, down from its previous guidance of $10.60 to $11.10 a share. Average daily volume for Ground’s package business grew 4% in the quarter, which was about in line with the company’s expectations. Ground’s operating income slipped 1% to $537 million, while revenue shot up 29% to $3.83 billion in part from the addition of GENCO. For the first quarter ended Aug. 31, FedEx posted a profit of $692 million, or $2.42 a share, up from $653 million, or $2.26 a share, a year earlier. Revenue increased 5% to $12.3 billion.

Oracle Reports Decline in Profits

Sept 16 (WSJ) — Oracle said net income fell 20% in the period ended Aug. 31, but was off only 8% excluding currency effects. Total revenue, off 2%, was up 7% on a constant-currency basis, Oracle said. Oracle said new licenses declined 16% in dollars, or 9% in constant currency. Overall, Oracle reported a profit of $1.75 billion, or 40 cents a share, down from $2.18 billion, or 48 cents a share, a year earlier. Excluding stock-based compensation and other items, profit would have been 53 cents a share, compared with 62 cents a year earlier. Total revenue declined to $8.45 billion from $8.6 billion a year earlier.

Euro friendly:

Italy : Merchandise Trade
er-9-18-3
Highlights
The seasonally adjusted trade balance was in a E3.7 billion surplus in July, up from an unrevised E2.6 billion excess in June.

However, the headline improvement masked contractions in both sides of the balance sheet. Hence, exports fell 0.4 percent on the month, their third decline since March but only due to weakness in energy (ex-energy exports grew 0.4 percent). Imports were off a steeper 3.7 percent (minus 4.0 percent ex-energy). Compared with a year ago, exports were up 6.3 percent after a 9.4 percent rise in June and imports 4.2 percent higher following a 12.2 percent gain last time.

The July black ink was more than 6 percent above its average level in the second quarter. This suggests that net exports could provide a boost to real GDP this quarter having been a drag in the previous period.

They talk about the ‘portfolio balance channel’ meaning investors shifting to ‘riskier assets’ due to QE, etc. But at the macro level, it’s about the total ‘risky assets’ available, and it looks like the growth rate is declining:
er-9-18-4
No sign of a burst in issuance here:
er-9-18-5
er-9-18-6
er-9-18-7

Housing Starts
er-9-18-8

Highlights
Housing starts fell back in August but not permits which gained and point to strength for starts ahead. Starts fell 3.0 percent in the month to a lower-than-expected 1.126 million annual pace while permits rose 3.5 percent to a higher-than-expected 1.170 million. Starts for single-family homes, like the headline for starts, also fell 3.0 percent in August but follow a 10.9 percent surge in July. Permits for single-family homes rose 2.8 percent in the latest month to 699,000 which is the highest since 2008.

Housing under construction is also at a 2008 high, at 920,000 vs 908,000 in July. But completions were down in the month, from July’s 966,000 pace to a still healthy 935,000.

By region, starts data show increasing strength for the South which is by far the largest region, up 7.1 percent in the month. Permits in the South rose 2.4 percent for a 10 percent year-on-year gain. Permits in the West are the strongest of any region, up 9.6 percent in the month for a year-on-year rate surge of 36 percent.

Revisions to July were mixed with starts revised lower but permits higher. On net, this report is another positive for housing which is proving to be a key sector for the 2015 economy.
er-9-18-9

Steady progress but still depressed and still well below the lows of the 2001 recession:
er-9-18-10

Too soon to tell if the prior spike will be followed by a more serious collapse:
er-9-18-11

Philadelphia Fed Business Outlook Survey
er-9-18-12

Highlights
There may very well be something wrong with the manufacturing sector, at least in the Northeast where the Empire State index has been in deep negative ground for the last two months followed now by a minus 6.0 headline for the Philly Fed index. This is the first negative reading since February 2014.

But the headlines for both of these reports, which are not composite scores of separate components, are sentiment scores of sorts, rough month-to-month assessments of general conditions. A key positive in today’s is continued strength in new orders which rose 3.6 points to 9.4. Unfilled orders, nevertheless, have been trending into contraction, at minus 6.6 for the third straight negative reading.

But some details are very strong with shipments at plus 14.8 and employment at plus 10.2 for a 5-month high. In a negative signal also seen in the Empire State report, prices received, that is prices for final goods, is in contraction at minus 5.0.

The Fed is wondering whether global volatility and stock market losses are affecting consumer confidence. Early data this month from regional Feds suggest the effects may also be extending to business sentiment.
er-9-18-13

Rail Week Ending 12 September 2015: Tremendous Unimprovement After Previous Week’s Improvement

Sept 17 (Econintersect) — Week 36 of 2015 shows same week total rail traffic (from same week one year ago) collapsed according to the Association of American Railroads (AAR) traffic data. Intermodal traffic significantly declined year-over-year, which accounts for approximately half of movements. and weekly railcar counts continued in contraction. It could be that the data last week was screwed up – and the data this week was an adjustment.

And so how good can the US economy be if the Fed thinks the appropriate fed funds rate is still near 0%?

;)

Autos and export related anecdotes, Atlanta Fed GDP forecast

This is consistent with the US production and inventory numbers.

While the total vehicle sales rate was up a bit, the gains seem to be entirely in imported vehicles:
er-9-17-1
er-9-17-2
er-9-17-3
er-9-17-4
More anecdotal evidence of export softness:
er-9-17-5

August 2015 Sea Container Exports Still Lagging

By Steven Hansen

The data for this series continues to be less than spectacular – but imports improved this month while exports degraded. The year-to-date volumes are contracting for exports but imports are now in the green.

This continues to indicate weak economic conditions domestically and globally. Consider that imports final sales are added to GDP usually several months after import – while the import cost itself is subtracted from GDP in the month of import. Export final sales occur around the date of export. Container counts do not include bulk commodities such as oil or autos which are not shipped in containers.

Japan : Merchandise Trade
er-9-17-6
Highlights
August’s merchandise trade deficit was a greater than anticipated ¥569.7 billion, much larger than July’s revised deficit of ¥268.4 billion. It was the fifth consecutive month that balance was negative. On the year, exports were up 3.1 percent while imports retreated 3.1 percent. Expectations were for an increase of 4 percent for exports and a decline of 2.2 percent for imports.

Exports to Asia were up 1.1 percent for the sixth straight increase. However, exports to China sank 4.6 percent for the first decline in six months. Exports to the EU slipped 0.2 percent for the first drop in nine months. Exports to the U.S. jumped 11.1 percent for the 12 straight increase.

er-9-17-7

Spain, QE chart, Wholesale trade, UK and France industrial production, Import and export prices

Fyi, we will be in Spain next week.

Here are some of the details:

There is a newly formed MMT Group in Spain called APEEP which stands for “Asociación para el Pleno Empleo y la Estabilidad de Precios”.

In an effort to bring MMT into the political debate in Spain, they will be hosting me for a presentation of the Spanish translation of “The Seven Deadly Innocent Frauds of Economic Policy”, starting with a presentation in Madrid on the 14th of September, Valencia on the 15th of September, and Vila-real on the 17th of September.

Here are links for the events, including time/date/location

14th September Madrid
15th September Valencia
17th September VilaReal

And this is the press release for the events containing more details.

Also:

Asociación Para el Pleno Empleo y la Estabilidad de Precios (APEEP) (Association for Full Employment and Price Stability), is a non-profit organization devoted to raising awareness and disseminating Modern Monetary Theory amongst the Spanish public. APEEP believes that full employment and price stability are compatible if public policy is conducted within an MMT framework. The current economic crisis within the Eurozone highlights the need for a Post Keynesian and MMT approach to public policy.

You’d think by now word would be out it’s just a placebo, but ancient beliefs tend to linger on…
er-9-10-1
Not good- sales down and inventories remain elevated:

United States : Wholesale Trade
er-9-10-2

Highlights
Factory inventories held stable in July as did wholesale inventories, down 0.1 percent against a 0.3 percent decline in sales that leaves the stock-to-sales ratio unchanged at 1.30. Wholesale inventories look light for machinery and apparel but heavy for farm products and metals.

The nation’s inventories are heavier than they were last year which may limit future production and hiring. Next data on inventories will be the business inventories report on Tuesday.

MONTHLY WHOLESALE TRADE: SALES AND INVENTORIES July 2015 Sales. The U.S. Census Bureau announced today that July 2015 sales of merchant wholesalers, except manufacturers’ sales branches and offices, after adjustment for seasonal variations and trading-day differences but not for price changes, were $449.5 billion, down 0.3 percent (+/-0.5)* from the revised June level and were down 4.2 percent (+/-1.4%) from the July 2014 level. The June preliminary estimate was revised upward $1.0 billion or 0.2 percent.

This chart is now looking a lot like prior recessions:
er-9-10-3

Inventories/Sales Ratio. The July inventories/sales ratio for merchant wholesalers, except manufacturers’ sales branches and offices, based on seasonally adjusted data, was 1.30. The July 2014 ratio was 1.19.
er-9-10-4

Great Britain : Industrial Production
er-9-10-5
France : Industrial Production
er-9-10-6
United States : Import and Export Prices
er-9-10-7

None of this is considered the ‘some improvement’ Chairman Yellen was looking for going into the Fed meeting next week…

quick macro update

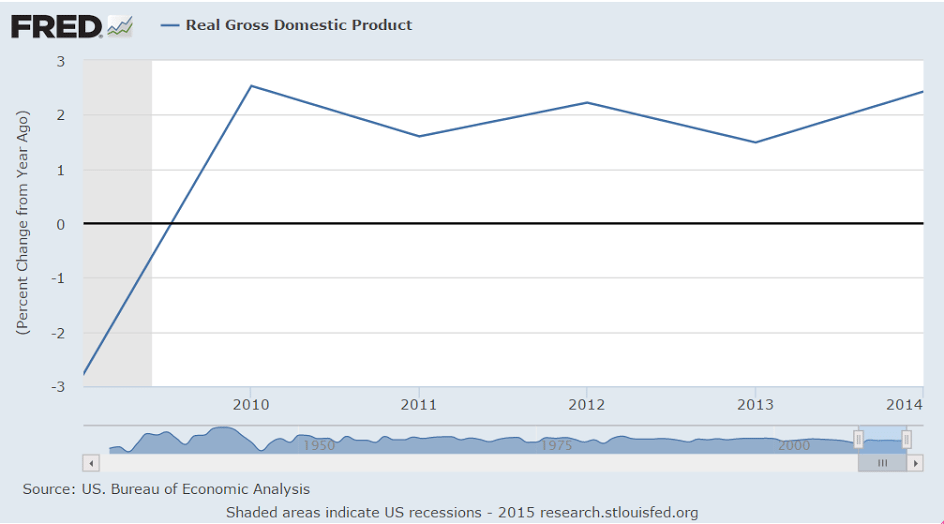
It all started when the FICA tax cuts and a few of the Bush tax reductions were allowed to expire at the end of 2012, followed by the sequesters a few months later 2013. That resulted in 2013 GDP growth of a bit less than 2% or so that might have been closer to 4% without the tax hikes and spending cuts.

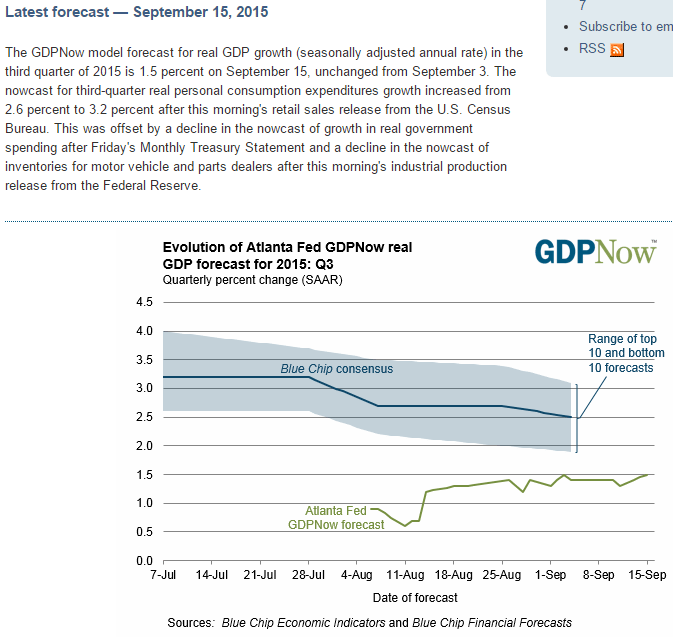
Going into 2014 GDP I suggested growth might be closer to 0 than to the 3.5% being forecast. It again printed about in the middle averaging a bit over 2% (with some ups and downs…), and then towards the end of 2014 the price of oil collapsed and it was discovered there had been $hundreds of billions of planned capital expenditures that would be cut, domestically and globally, after which I again suggested GDP growth for the year- this time 2015- would now be near 0, and in fact could well be negative. Additionally, it was revealed the extent to which it was the large and growing oil capex expenditures up to that time that had been supporting at least 1% GDP growth up to that point. And so far GDP growth for 2015 has been less than 2014, even after 2014’s recent downward revisions, and along with slowing GDP has come slowing corporate revenues and earnings growth. All subject to further revisions, of course, which lately have been downward revisions.
macro-8-24-1

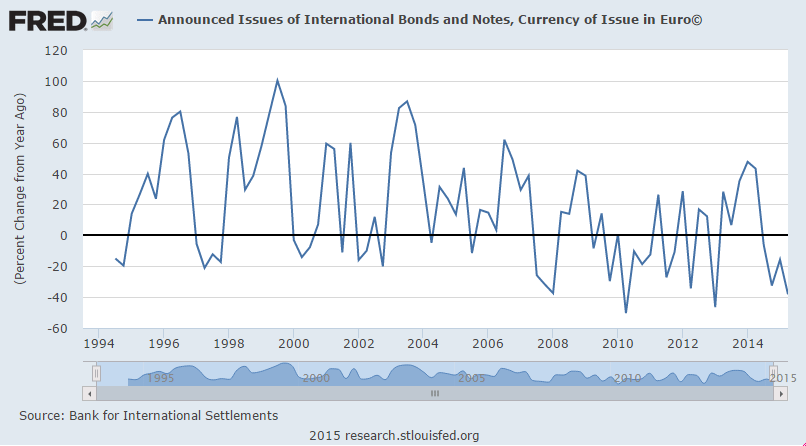
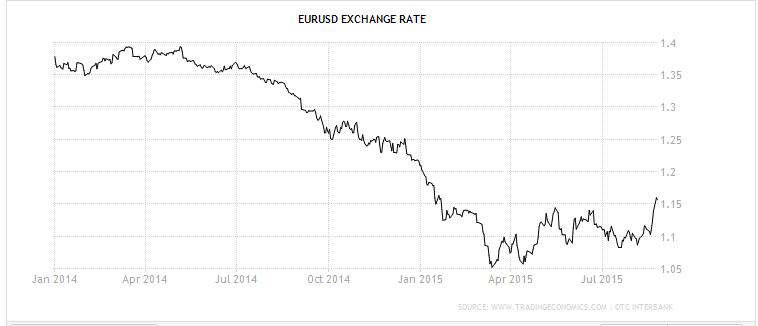
Meanwhile, in the first half of 2014 the euro began falling against the $ as well as other currencies. The fall coincided with the ECB threatening and then following through with negative rates and QE, much to the consternation of global portfolio managers, including Central Bankers, pension funds and hedge funds, who collectively proceeded to lighten up on their euro allocations. And along the way, issues surrounding Greece further frightened the portfolio managers into further selling of euro assets. This relentless selling pressure drove the euro down, particularly vs the US dollar. Specifically, a euro based portfolio manager might, for example, sell his euro securities, and then sell the euros to buy dollars, and then use the dollars to buy US stocks. Or a CB might manage its reserves such that the % of euro assets declined vs dollar assets. And a hedge fund might simply buy the $US index, which is about half dollar/euro and a way to sell euro and other currencies vs the dollar. All of this, along with several other ways to skin the same cat, constituted euro selling that drove the dollar up and the euro down, and at the same time produced buyers of US stocks.

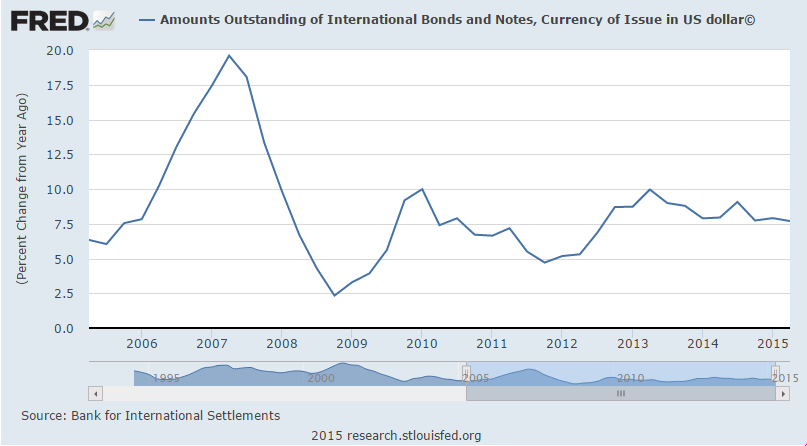
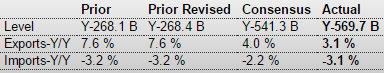
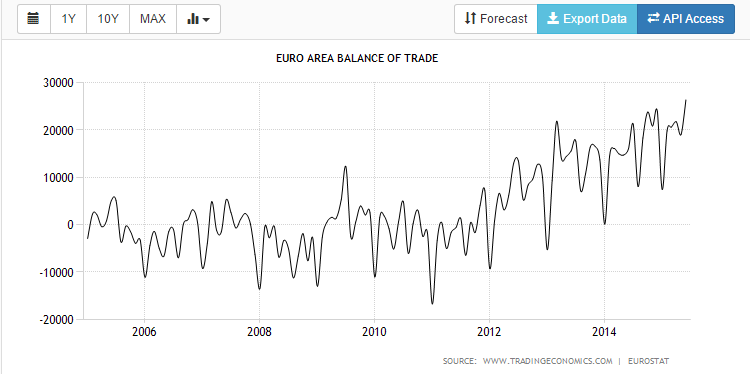
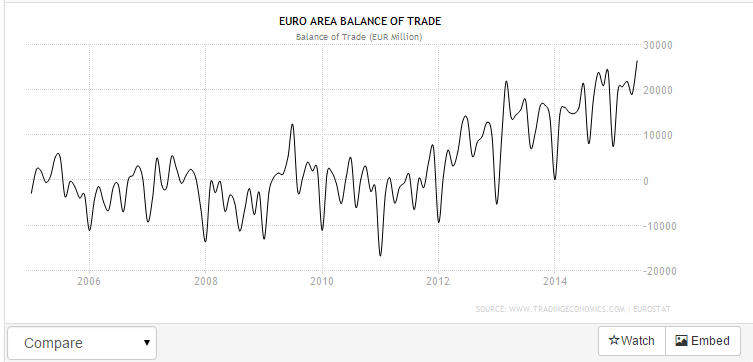
Fundamentally, however, the opposite was happening. The euro area had a (small) trade surplus, which was removing euro from global markets, but not as fast as the sellers were selling, and the euro went ever lower. But as it did this it made the euro area that much more ‘competitive’ (euro area goods and services were that much less expensive in dollar terms) which resulted in an ever larger trade surplus, with the latest release showing a record trade surplus of about 24 billion euro per month. And at the same time, the increased euro exports helped support the economy and generated forecasts for improved future growth, all of which supported euro stocks.

It now appears the curves (finally) crossed, with the euro area trade surplus now exceeding the euro portfolio selling which seems to have run its course, which caused the euro to bottom and start to appreciate. This started generating adverse marks to market for those short euro and long US stocks, for example, who subsequently began reversing their positions by buying euro and selling US stocks. And the strong euro also threatens euro area exports and therefore output, employment, and GDP forecasts, causing euro stocks to sell off as well.

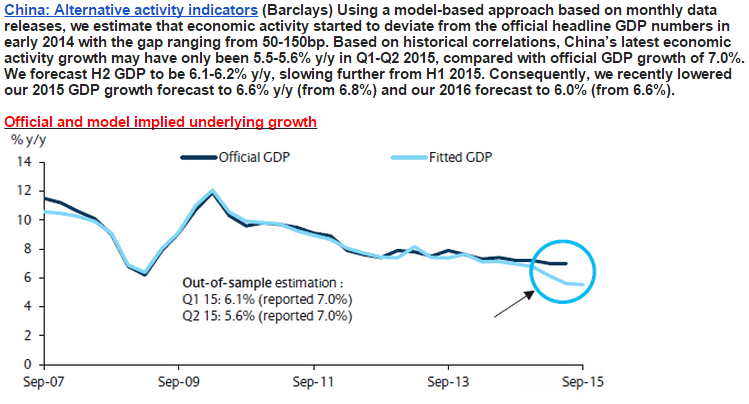
So far I’ve left out what turned out to be the catalyst for this reversal- China. When China moved to allow the yuan to trade lower against the dollar, it was deemed a credible threat to both euro and US exports, and world demand in general, which set off the latest wave of selling.
macro-8-24-2
macro-8-24-3

So what’s next?

More selling of US stocks and buying euro to reverse those positions. Hedge funds might move quickly, but, for example, pension funds often do their reallocating at quarterly and annual meetings, so it could all take quite a bit of time.

Additionally, buying of euro will drive the euro up, as there is no ‘excess supply’ being generated. Quite the reverse, in fact, as the trade surplus works to make euro that much harder to get. That means the euro will appreciate until the trade surplus reverses (whether there is any causation or not…), which should prove highly problematic for the euro economy and euro stocks. The other side of this coin is the weaker dollar that should lend some support to the US stock market, though a collapsing euro area economy with it’s associate debt issues and political conflicts might do more harm than the weak dollar does good, not to mention the weakening domestic demand in the post oil capex world with no relief in sight from other sectors.

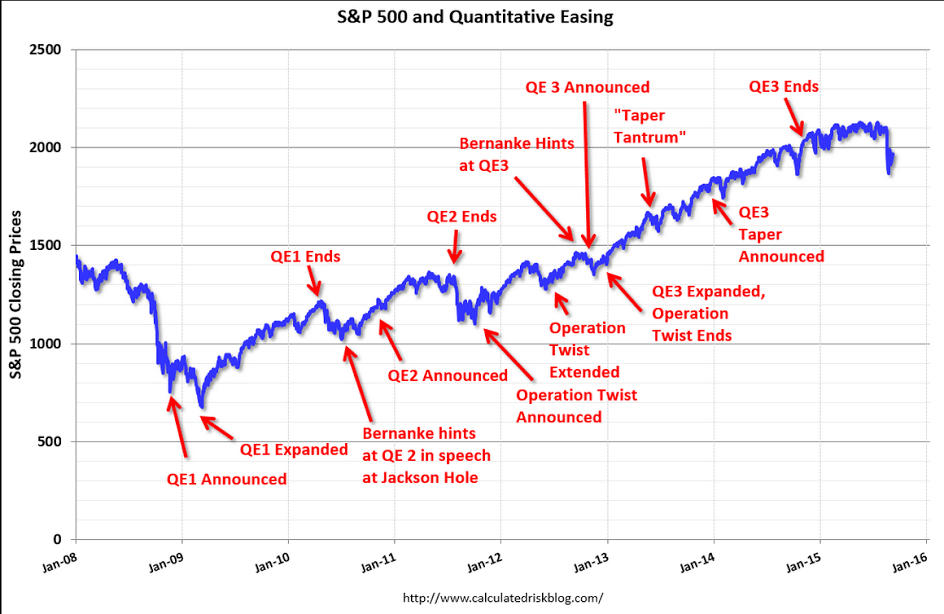
Lastly, the stock market has been maybe the best leading indicator, and probably because of it’s direct effect on perceptions of wealth and its influence on spending and investing decisions. And the Fed doesn’t target stocks,
but it doesn’t ignore them either, as it too recognizes the influence it can have on output and employment, especially on the downside.

Of course all of this can be reversed for the better with a simple fiscal expansion, as the underlying problem remains- the Federal deficit is too small in the absence of sufficient private sector deficit spending needed to offset desires to not spend income. (Yes, it’s always an unspent income story…)

But politics, at least for now, renders that sure fire remedy entirely out of the question.

euro area trade, housing comments, consumer prices

Continues very strong. This is for member using the euro:
er-8-19-6

Size of New Homes in U.S. Shrinks by One Closet

By Kris Hudson

Aug 18 (WSJ) — Of the 206,000 homes that went under construction in the second quarter, the median size was 2,479 square feet. That was 40 square feet smaller—or about the size of a walk-in closet—than the high set in the first quarter. The National Association of Home Builders estimates that first-time buyers, who tend to purchase entry-level homes, will account for 18% of new-home sales this year. That is up from 16% last year but still well short of their share of 25% to 27% from 2001 to 2005. Then, quarterly median sizes for new homes ranged from 2,051 to 2,263 square feet.

Maybe reduced value conflicts between boomers and their kids vs boomers and their parents are contributing to keeping kids at home?

No improvement in purchase apps here. Been largely flat for the last several months now:

MBA Mortgage Applications
er-8-19-7
Consumer Price Index
er-8-19-8
Highlights
Inflation wasn’t brewing in July and with oil prices moving lower, inflation may not be showing much pressure in August either. The consumer price index rose only 0.1 percent in July as did the core, both under expectations. Year-on-year rates show slightly more pressure. Overall inflation is up 0.2 percent, which is very low but up from 0.1 percent in the prior month and the second positive reading of the year. The core is steady at plus 1.8 percent which is just under the Fed’s 2 percent target.

Gasoline moved sharply higher in July, up 0.9 percent following outsized gains of 3.4 percent and 10.4 percent in the prior two months. But with gas prices moving steadily lower this month, the upward effects of gasoline will be turning downward in August. Another major component showing upward pressure in July is apparel which rose 0.3 percent following, however, a long string of declines. Owners equivalent rent continues to show pressure, up 0.3 percent on top of June’s outsized gain of 0.4 percent.

Elsewhere, however, pressures are hard to find with electricity down 0.4 percent, used vehicles down 0.6 percent, new vehicles down 0.2 percent, and airfares down 5.6 percent. Medical, drugs, and education all rose only 0.1 percent.

There may be some upward creep in the headline year-on-year rates but, given the ongoing decline in oil, this report won’t be pushing the Fed for a September rate hike.

er-8-19-9
er-8-19-10
Rents have been moving up some, though still at a modest rate. Seems to me as per the depressed housing starts prices haven’t yet gotten close enough to replacement costs. Once they do get to replacement cost, market forces work to increase supply as ‘demanded’ without further ‘catch up’ price increases. At that point price increases come from increases in costs.

Also, lower utility costs for the landlord that aren’t passed through to the renter ‘count’ as higher rents, which means the drop in fuel and utility costs translate to increased rents when, for example, the actual payment remains the same:
er-8-19-11
er-8-19-12

Remember a few years back when the mainstream was sounding the alarm over this?
er-8-19-13
And this about a year ago?
er-8-19-14

Producer Prices, Industrial Production, Rail Traffic, Container Exports


This is not a reason to hike rates, but the Fed has other reasons beginning with their mistaken belief that the current policy is ‘highly accommodative’ and potentially inflationary, etc. etc. etc. when the opposite is the actual case:

er-8-15-1

Up a bit more than expected, but all due to auto production, and yesterday’s wholesale trade report told us it all went to building (unsold) inventory, with sales of domestic cars relatively flat, so look for a reversal over the next few months. And note the reference to weak exports:

Industrial Production
er-8-15-2

Highlights
A 10.6 percent surge in motor vehicle production gave a very significant lift to industrial production which rose 0.6 percent in July. The manufacturing component, which has been flat all year, jumped 0.8 percent. Excluding vehicles, however, manufacturing rose only 0.1 percent. The lack of strength here is the result of business equipment which edged only 0.1 percent higher after declining 0.2 percent in June.

The rise in production drove capacity utilization up 3 tenths to 78.0 percent which is where it was back in April. Capacity utilization for manufacturing rose 5 tenths to 76.2 percent.

The two non-manufacturing components are mixed. Production at utilities, due to July’s cool weather, fell 1.0 percent with capacity utilization down 8 tenths to 79.1 percent, while mining production rose 0.2 percent with capacity utilization down 1 tenth to 84.4 percent.

Weak foreign demand and weakness in the energy sector may be hurting much of the industrial sector but these factors are not at play in the domestic auto industry. The readings in today’s report are mixed but the headline gain, driven by the convincing strength for autos, is an eye catcher and will certainly be ammunition for the hawks at next month’s FOMC meeting.

er-8-15-3


Weaker than expected and continuing to fade some (in line with stocks…), and note that it peaked with the fall in oil prices:

er-8-15-4

Rail Week Ending 08 August 2015: Continued Decline of One Year Rolling Average

By Steven Hansen
August 13 (Econintersect)

Econintersect: Week 31 of 2015 shows same week total rail traffic (from same week one year ago) contracted according to the Association of American Railroads (AAR) traffic data. Intermodal traffic expanded year-over-year, which accounts for approximately half of movements. and weekly railcar counts continued in contraction.

U.S. Containerized Exports Fall Off the Chart

By Wolf Richter
August 13 (Wolf Street)

“Many of our major trading partners are experiencing stalled or slowing economies, and the strength of the US Dollar versus other currencies is making US goods more expensive in the export market.” That’s how the Cass/INTTRA Ocean Freight Index report explained the phenomenon.

What happened is this: The volume of US exports shipped by container carrier in July plunged 5.8% from an already dismal level in June, and by 29% from July a year ago. The index is barely above fiasco-month March, which had been the lowest in the history of the index going back to the Financial Crisis.

The index tracks export activity in terms of the numbers of containers shipped from the US. It doesn’t include commodities such as petroleum products that are shipped by specialized carriers. It doesn’t include exports shipped by rail, truck, or pipeline to Mexico and Canada. And it doesn’t include air freight, a tiny percentage of total freight. But it’s a measure of export activity of manufactured and agricultural products shipped by container carrier.

Overall exports have been weak. But the surge in exports of petroleum products and some agricultural products have obscured the collapse in exports of manufactured goods

er-8-15-5

Retail Sales, Jobless Claims, Import Export Prices, Business Inventories, Japan Machine Orders, Freight Transportation, Gas Prices


This is being touted as a strong report, but, again, looks to me like it’s dropped since year end and at best is moving sideways from there, and not to forget that a large share of auto sales are imports.

But I do agree the Fed is heck bent on raising rates in Sept, even without ‘some’ improvement, and will do so unless there’s a stock market decline severe enough to hold them back. So far that’s not happening.

Retail Sales
er-8-13-1

Highlights
Big upward revisions underscore a very solid and very important retail sales report. Retail sales rose 0.6 percent in July with June revised to unchanged from an initial reading of minus 0.3 percent and with May revised to a jump of 1.2 percent from 1.0 percent. The revisions to June and May point to an upward revision for second-quarter GDP.

Vehicle sales, as expected, were the standout in July, jumping 1.4 percent to nearly reverse June’s 1.5 percent slide and nearly matching May’s historic 1.9 percent surge. But even outside vehicles, retail sales were strong with the ex-auto reading rising a solid 0.4 percent. Restaurants, in another strong signal of consumer strength, rose an outsized 0.7 percent following June’s 0.5 percent gain. These are very strong gains for this component. Excluding both vehicles and gasoline, retail sales rose 0.4 percent, again another solid reading.

Strength in both vehicles and restaurants point to the health of the US consumer and will likely give the hawks the courage, despite all the troubles in China, to push for a rate increase at the September FOMC.

er-8-13-4

er-8-13-5

er-8-13-6

er-8-13-7

er-8-13-8

er-8-13-9

Tough times for department store sales continue, which explains some of the weakness in construction:

er-8-13-10

‘Some’ deterioration:

Jobless Claims
er-8-13-11

‘Some’ deterioration for Fed hopes of higher inflation. It’s been failing to hit its target for longer than I can remember…

er-8-13-12


Excess inventory building in June helps Q2 GDP but the likely subsequent production cuts will hurt Q3. The now persistently too high inventory to sales ratio is overdue for a correction:

United States : Business Inventories
er-8-13-13

Highlights
Inventories rose relative to sales in June but the news isn’t that bad given that the build was centered in autos. Business inventories rose 0.8 percent in June which was well ahead of a 0.2 percent rise in sales. The mismatch lifts the inventory-to-sales ratio to 1.37 from 1.36.

But retail inventories at auto dealers were to blame, up 1.4 percent in June and contributing to a 0.7 percent rise for the retail component. Inventories at manufacturers and wholesalers, the two other components of the business inventory report, also rose, up 0.6 and 0.9 percent respectively.

Inventories are on the heavy side but the concentration in autos is welcome given how strong sales are, evidenced by the 1.4 percent surge for the motor vehicle component of the July retail sales report released earlier this morning. Note that this report, along with the retail sales report, are likely to lift revision estimates for second-quarter GDP.

er-8-13-14

Global weakness continues:

Japan : Machine Orders
er-8-13-15

Highlights
June seasonally adjusted machine orders (excluding volatile items) declined for the first time since February. They dropped a larger than anticipated 7.9 percent on the month and were up 14.7 percent on the year. Core orders were up 16.6 percent based on the original series. This was in contrast to expectations of a 17.5 percent increase.

Core machine orders are considered a proxy for private capital expenditures. The downward move followed a 0.6 percent gain a month before. The government repeated its assessment that machine orders would advance in the third quarter.

Nonmanufacturing orders excluding volatile items were up 5.0 percent while manufacturing orders dropped 14.0 percent. All orders including volatile items dropped 6.2 percent on the month. Manufacturing orders likely softened on continued weaker export demand while the sluggish domestic economy weighs on nonmanufacturers.”

Another weak looking index:

er-8-13-16


And I’d call this ‘some’ deterioration in the ‘labor market’. Looks like it was weakening before the 2014 oil capex boom supported it, and then has fallen off since the oil price collapse:

er-8-13-17


This is to the point I’ve been making that surveys are one man one vote, not one dollar one vote, so optimism remained high even as retail sales, for example, were fading. Yes, a lot more people saved $10 per week on gas but an equal amount of income was reduced for sellers of oil, including those earning royalties and holding leases, and investors of all sorts, and seems the spending cuts on domestic product by that group outweighed the additional spending from pump savings.

Fueled by low pump prices, U.S. motorists to drive more in August – survey

By Jarrett Renshaw

August 11 (Reuters)

U.S. motorists are paying an average of $2.58 per gallon, nearly a dollar less than a year ago, according to AAA, the nation’s largest motorist advocacy group. And a quarter of respondents expected prices to continue to decline, up from 10 percent a month ago.

The survey found that nearly 80 percent of people say gas prices influence how they feel about the economy. And with gas prices down nearly $1 from a year ago, U.S. motorists are feeling positive about the direction of the economy, the survey found.

“There is good news for retailers as consumer optimism picks up during peak vacation season,” said NACS Vice President of Strategic Industry Initiatives Jeff Lenard.