Retail sales, Industrial production, Interest payments, Japan profits, Euro area fiscal balance

Weak and weaker than expected:

Highlights

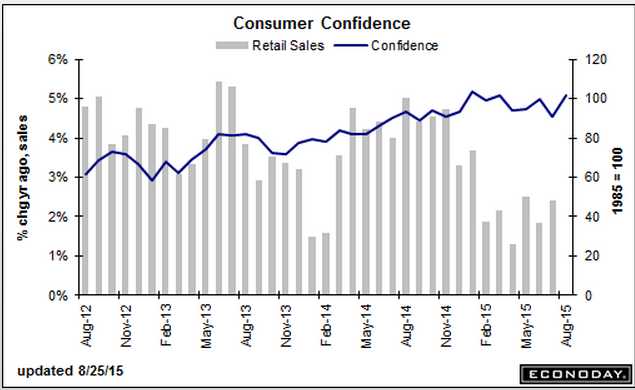
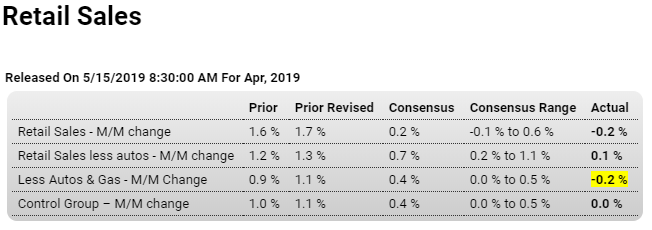
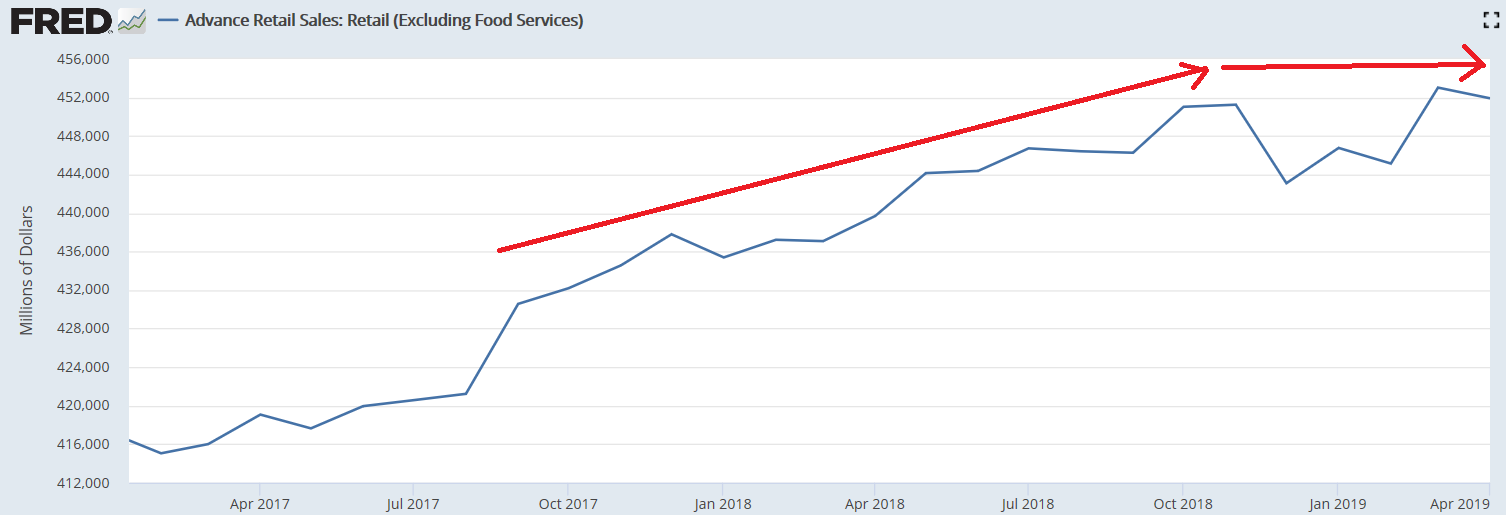
The second quarter gets off to a stumbling start pulled down by a 0.2 percent headline decline in an April retail sales report where the core details show unexpected weakness. Excluding autos, in which sales were already expected to fall sharply, April sales managed only a 0.1 percent gain to fall underneath Econoday’s consensus range. Excluding autos and also gasoline sales, which were already expected to rise sharply, sales fell 0.2 percent in April to also fall below the consensus range. Just making the consensus range is a no change result for the control group, a component used in the calculation of GDP and pointing squarely to early second-quarter deceleration in consumer spending which had already decelerated sharply in the first quarter.

A 1.1 percent decline in auto sales (signaled by the prior release of unit sales at manufacturers) is no surprise and neither is a 1.8 percent jump at gasoline stations, signaled here by the price of gas. The big surprise is a 1.3 percent drop at electronics & appliance stores that follows a 4.3 percent tumble in March. Weakness here hints at lower prices for consumer electronics and also lower spending on home improvements. Furniture sales also hint at trouble for residential investment, coming in unchanged following March’s 3.1 percent decline, as do sales of building materials which fell 1.9 percent in April following, however, a 1.2 percent rise in March.

The best news in the report comes from its weakest sub-component, department stores where April sales jumped 0.7 percent. This was enough, however, to give only a small 0.2 percent lift to the overall general merchandise component. Another positive is restaurants where sales rose 0.2 percent on top of a great monthly surge of 5.7 percent in March.

Another negative surprise:

Highlights

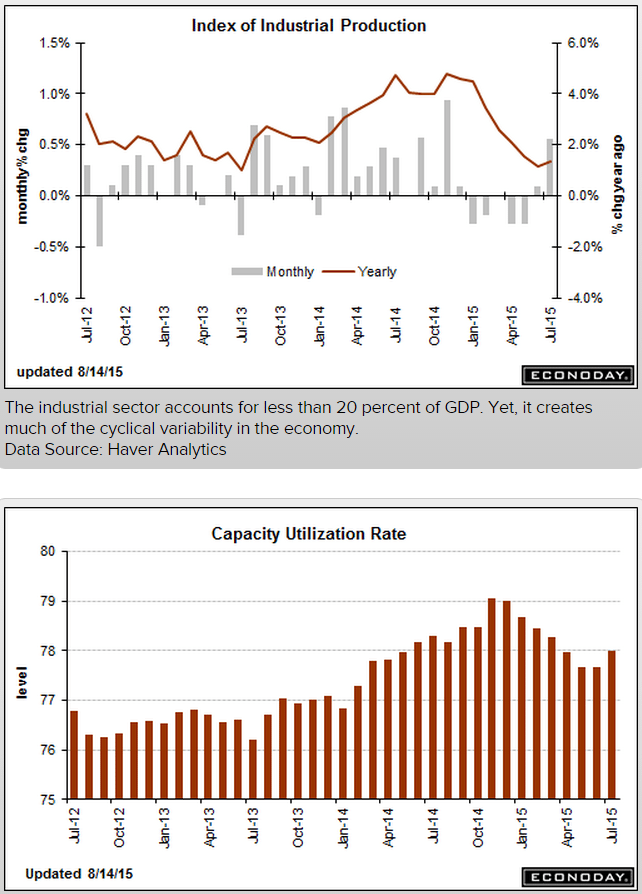
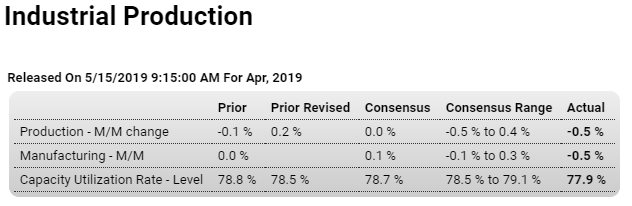
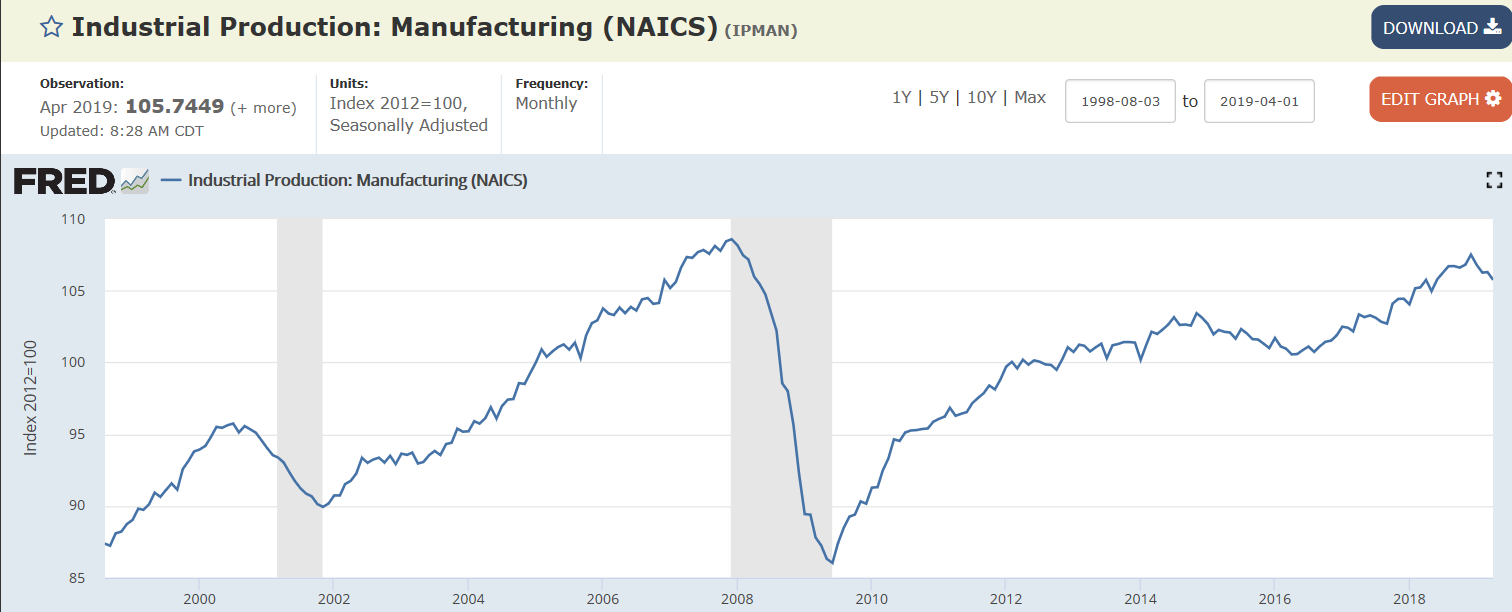
Like retail sales earlier this morning, the headline 0.5 percent decline for April industrial production is not masking strength underneath. Also falling 0.5 percent was production at manufacturers which is even more unexpected than the headline decline.

Motor vehicles and parts, where consumer sales have been mostly soft this year, fell 2.6 percent in April for a second monthly decline and year-over-year contraction of 4.4 percent. Business equipment fell 2.1 percent in the month for yearly growth of only 0.1 percent which doesn’t point to acceleration for business investment. Consumer goods also fell, down 1.2 percent in the month with construction supplies up only 0.1 percent that follows March’s 1.7 percent dip in readings that don’t point to strength for construction in general. Selected hi tech is a positive for April, up 0.6 percent with annual growth here at 3.2 percent.

Also positive is a 1.6 percent jump in mining volumes which rose 1.6 percent in April that follows, however, three straight months of declines. Output at utilities fell 3.5 percent in April with the yearly rate of minus 4.7 percent also pointing to general industrial weakness.

However tight the US labor market may be, capacity does not appear to be tight in the industrial sector as capacity utilization fell 6 tenths in April to a much lower-than-expected 77.9 percent. Utilization in the manufacturing sector is down 5 tenths to 75.7 percent.

This report doesn’t breakdown production of goods aimed for the domestic market and those for the foreign market but it will nevertheless offer a baseline for the overall effects of increased US-China tariffs. Going into those tariffs, the manufacturing sector, which first began to slow late last year, appeared to be flat at best.
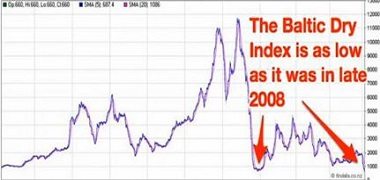

Rolling over:

Corporate Japan logs first profit dip in 3 years as China slows

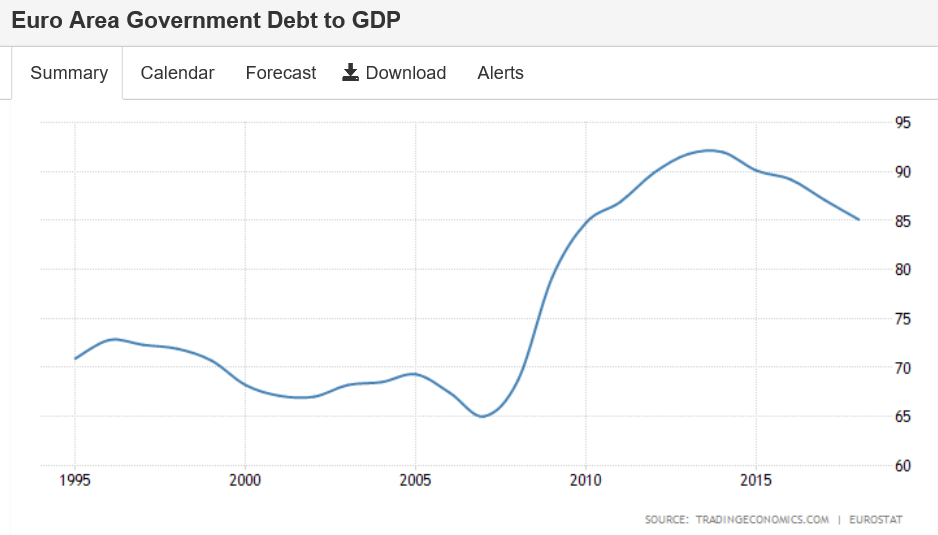
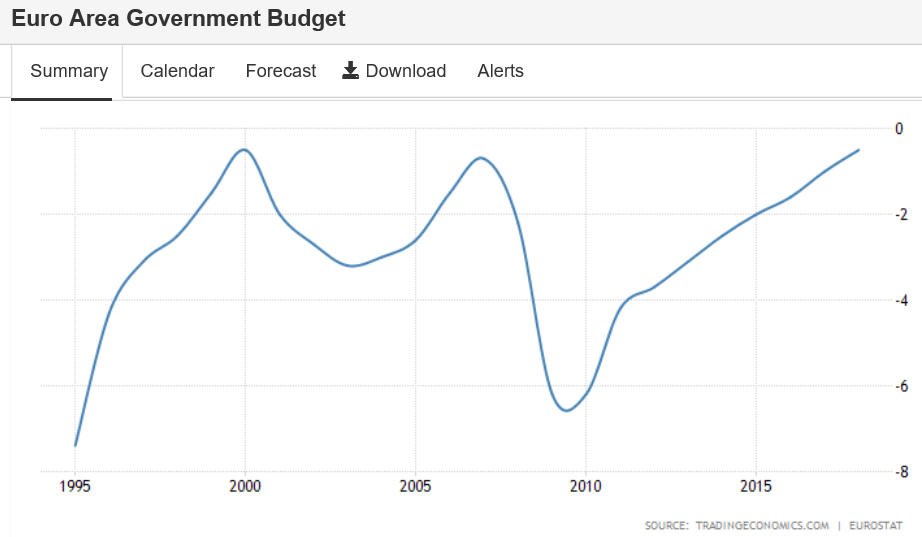
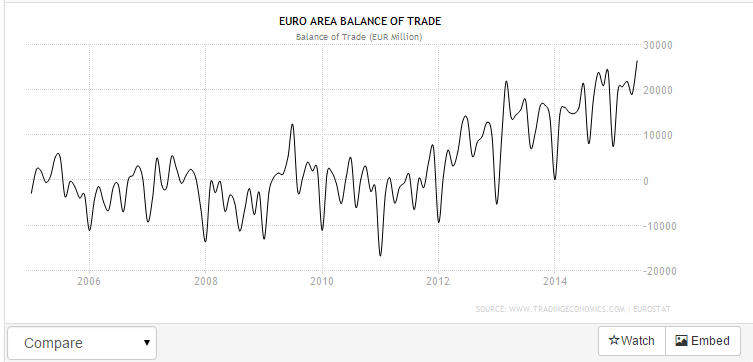
Fiscal has tightened in the euro area, and now with the global trade collapse prospects are looking grim:

Euro Area recorded a Government Budget deficit equal to 0.50 percent of the country’s Gross Domestic Product in 2018. Government Budget in the Euro Area averaged -2.84 percent of GDP from 1995 until 2018, reaching an all time high of -0.50 percent of GDP in 2000 and a record low of -7.40 percent of GDP in 1995.

Consumer credit, Mania comment, Fed on rates and inflation

It’s been decelerating all year with a year end move up that’s likely to be reversed as personal income growth continues to be very low:

Highlights

Consumer borrowing increased in December, up $18.4 billion vs an upwardly revised $31.0 billion in November which is the largest monthly increase since a break in the series 7 years ago. Revolving credit, a component that tracks credit-card debt, rose a sizable $5.1 billion following a November spike of $11.0 billion. On an annualized basis, revolving credit rose at a 6.0 percent pace in December.

Non-revolving credit rose at a 5.7 percent pace in the month and in month-to-month dollar terms rose $13.3 billion. Gains in this component, which is nearly triple the size of the revolving component, were split between student loans and especially vehicle financing.

The gain for revolving credit does suggest that those shoppers who are cash strapped turned to their credit cards to do their share to fund the holiday shopping season.

To my point about a general ‘mania’ that seems to be fading:

Bitcoin becomes just like everything else on Wall Street as correlation with stocks jumps to 2-year high

The notion that higher rates from the Fed cause higher inflation seems to be getting a bit of a hearing;

Neo-Fisherism: A Radical Idea, or the Most Obvious Solution to the Low-Inflation Problem?

Factory orders, ISM non mfg, ECB news

Yes, they were up, but there is a ‘seasonal’ aspect to it, including an air show, so the year over year chart is a bit more indicative of what’s going on and it’s still in negative territory. Also, vehicle orders declined, and inventories remained at levels that beg continuing production cuts.

Factory Orders
er-12-3-1
Highlights
Factory orders bounced sharply higher in October and, together with the bounce higher for manufacturing in the industrial production report, confirm what was a very solid month for the sector. Factory orders rose 1.5 percent in the month led by a 2.9 percent surge in durable goods orders (revised 1 tenth lower from last week’s advance release). This gain offsets a no change result for non-durable goods orders.

Excluding transportation, and orders tied to the biennial Dubai airshow, new orders rose a less exciting 0.2 percent. But indications from core capital goods are very strong with new orders surging 1.3 percent on top of a 0.5 percent orders gain in September. Turning to capital goods industries, new orders for machinery jumped 1.2 percent with computer orders up 5.9 percent.

A negative in the report is a surprising 2.0 percent decline for vehicle orders, a disappointment that may very well be reversed in coming months based on the sustained and unusual strength of vehicle sales.

Looking at other readings, total shipments fell 0.5 percent in October which is not a good start to the fourth quarter with core capital goods shipments also down 0.5 percent. But future shipments are certain to benefit from October’s orders gain. Inventories, which are widely seen as too high, did dip 0.1 percent but relative to shipments could do no more than hold steady at a ratio of 1.35. Unfilled orders are positive, ending two months of decline with a 0.3 percent gain.

Given that the factory sector has been in decline all year, the order data in this report are encouraging and should help offset concern from this week’s sub-50 reading in the ISM manufacturing report.
er-12-3-2

After a ‘normal’ lag non manufacturing is now clearly softening form the decline in aggregate demand that began with the oil capex collapse about a year ago, with nothing that I can see stepping up to replace it. And note that exports went into contraction as it’s been the non manufacturing exports that have held up as other exports declined:

ISM Non-Mfg Index
er-12-3-3
Highlights
Strength in ISM’s non-manufacturing sample is cooling but remains very solid, at 55.9 in November which is, however, the lowest rate of monthly growth since May. Readings across the report have also edged down to growth levels last seen in the second quarter including new orders (57.5), backlog orders (51.5), and employment (55.5). New export orders, at 49.5, show their first contraction since April. The breadth of strength across industries, with 12 showing growth and six in contraction, is positive but, like most of this report, less positive than prior months. Still, this report surged through the third quarter and into October making a step down to a lower rate no major surprise.
er-12-3-4

So Draghi increased the tax on deposits, and this time the euro went up. Maybe portfolios don’t have any more left to sell as the high and growing trade surplus drains them from global markets?

Euro Rises After ECB

The Euro gained around 0.58% to 1.0667 USD right after the ECB cut deposit facility rate by 10 bps to -0.3% and said further stimulus measures would be announced during the press conference.
er-12-3-5

And taking euro away from depositors hasn’t seem to help consumer spending:

Euro Area Retail Sales Unexpectedly Fall

Retail sales in the Eurozone edged down 0.1 percent in October of 2015, following a 0.1 percent drop in September and no growth in August. Figures came below market expectations of a 0.2 percent gain, marking the longest period of no growth since mid-2013. Sales of food, drinks and tobacco shrank 0.5 percent, those of auto fuel fell 0.4 percent while sales of non-food products edged up 0.1 percent.

er-12-3-6

Redbook retail sales, Inflation adjustment, China, House prices, Consumer confidence

Still depressed
er-8-25-1
Lower than the Fed thought:

U.S. inflation probably lower than reported, Fed study says

Aug 24 (Reuters) — U.S. inflation in the first half of the year was probably “markedly lower” than reported according to the San Francisco Federal Reserve Bank. Researchers at the regional Fed bank had earlier found that the very weak readings for economic growth in the early part of the year were likely due to inadequate adjustments for seasonal fluctuations. The same researchers applied similar methodology to inflation data and found that core PCE inflation was probably overstated by 0.3 and 0.2 percentage points in the first two quarters of the year, respectively.

This does nothing for output and employment:

China’s central bank pumps in billions to ease liquidity strain

Aug 25 (Xinhua) — The People’s Bank of China (PBOC) conducted 150 billion yuan (23.4 billion U.S. dollars) of seven-day reverse repurchase agreements (repo). The reverse repo was priced to yield 2.5 percent, unchanged from the yield on a net injection last week of 150 billion yuan using reverse repos, according to a PBOC’s statement. The PBOC also channelled another 110 billion yuan via its medium-term lending facility. Despite the cash injection the benchmark overnight Shanghai Interbank Offered Rate (Shibor) climbed by 1.3 basis points to 1.879 percent.

Not a good sign:

S&P Case-Shiller HPI
er-8-25-2
Highlights
Inventories may be low and sales rates firm, but both Case-Shiller and FHFA are pointing to a surprising flat spot for home-price appreciation. Case-Shiller’s 20-city adjusted index fell 0.1 percent in June vs Econoday expectations for a 0.1 percent rise. Year-on-year, 20-city prices, whether adjusted or unadjusted, are unchanged at plus 5.0 percent. This rate has been inching higher but looks like it may be ready to fall back unless prices pick up.
er-8-25-3

A bit less than expected and still at very depressed levels:

New Home Sales
er-8-25-4

Settled back to depressed levels from last month’s blip up:

Richmond Fed Manufacturing Index
er-8-25-5

Consumer confidence bounced up with lower gas prices, as it’s one man one vote, not one dollar one vote, and so hasn’t been a reliable indicator of retail sales.
er-8-25-6

quick macro update

It all started when the FICA tax cuts and a few of the Bush tax reductions were allowed to expire at the end of 2012, followed by the sequesters a few months later 2013. That resulted in 2013 GDP growth of a bit less than 2% or so that might have been closer to 4% without the tax hikes and spending cuts.

Going into 2014 GDP I suggested growth might be closer to 0 than to the 3.5% being forecast. It again printed about in the middle averaging a bit over 2% (with some ups and downs…), and then towards the end of 2014 the price of oil collapsed and it was discovered there had been $hundreds of billions of planned capital expenditures that would be cut, domestically and globally, after which I again suggested GDP growth for the year- this time 2015- would now be near 0, and in fact could well be negative. Additionally, it was revealed the extent to which it was the large and growing oil capex expenditures up to that time that had been supporting at least 1% GDP growth up to that point. And so far GDP growth for 2015 has been less than 2014, even after 2014’s recent downward revisions, and along with slowing GDP has come slowing corporate revenues and earnings growth. All subject to further revisions, of course, which lately have been downward revisions.
macro-8-24-1

Meanwhile, in the first half of 2014 the euro began falling against the $ as well as other currencies. The fall coincided with the ECB threatening and then following through with negative rates and QE, much to the consternation of global portfolio managers, including Central Bankers, pension funds and hedge funds, who collectively proceeded to lighten up on their euro allocations. And along the way, issues surrounding Greece further frightened the portfolio managers into further selling of euro assets. This relentless selling pressure drove the euro down, particularly vs the US dollar. Specifically, a euro based portfolio manager might, for example, sell his euro securities, and then sell the euros to buy dollars, and then use the dollars to buy US stocks. Or a CB might manage its reserves such that the % of euro assets declined vs dollar assets. And a hedge fund might simply buy the $US index, which is about half dollar/euro and a way to sell euro and other currencies vs the dollar. All of this, along with several other ways to skin the same cat, constituted euro selling that drove the dollar up and the euro down, and at the same time produced buyers of US stocks.

Fundamentally, however, the opposite was happening. The euro area had a (small) trade surplus, which was removing euro from global markets, but not as fast as the sellers were selling, and the euro went ever lower. But as it did this it made the euro area that much more ‘competitive’ (euro area goods and services were that much less expensive in dollar terms) which resulted in an ever larger trade surplus, with the latest release showing a record trade surplus of about 24 billion euro per month. And at the same time, the increased euro exports helped support the economy and generated forecasts for improved future growth, all of which supported euro stocks.

It now appears the curves (finally) crossed, with the euro area trade surplus now exceeding the euro portfolio selling which seems to have run its course, which caused the euro to bottom and start to appreciate. This started generating adverse marks to market for those short euro and long US stocks, for example, who subsequently began reversing their positions by buying euro and selling US stocks. And the strong euro also threatens euro area exports and therefore output, employment, and GDP forecasts, causing euro stocks to sell off as well.

So far I’ve left out what turned out to be the catalyst for this reversal- China. When China moved to allow the yuan to trade lower against the dollar, it was deemed a credible threat to both euro and US exports, and world demand in general, which set off the latest wave of selling.
macro-8-24-2
macro-8-24-3

So what’s next?

More selling of US stocks and buying euro to reverse those positions. Hedge funds might move quickly, but, for example, pension funds often do their reallocating at quarterly and annual meetings, so it could all take quite a bit of time.

Additionally, buying of euro will drive the euro up, as there is no ‘excess supply’ being generated. Quite the reverse, in fact, as the trade surplus works to make euro that much harder to get. That means the euro will appreciate until the trade surplus reverses (whether there is any causation or not…), which should prove highly problematic for the euro economy and euro stocks. The other side of this coin is the weaker dollar that should lend some support to the US stock market, though a collapsing euro area economy with it’s associate debt issues and political conflicts might do more harm than the weak dollar does good, not to mention the weakening domestic demand in the post oil capex world with no relief in sight from other sectors.

Lastly, the stock market has been maybe the best leading indicator, and probably because of it’s direct effect on perceptions of wealth and its influence on spending and investing decisions. And the Fed doesn’t target stocks,
but it doesn’t ignore them either, as it too recognizes the influence it can have on output and employment, especially on the downside.

Of course all of this can be reversed for the better with a simple fiscal expansion, as the underlying problem remains- the Federal deficit is too small in the absence of sufficient private sector deficit spending needed to offset desires to not spend income. (Yes, it’s always an unspent income story…)

But politics, at least for now, renders that sure fire remedy entirely out of the question.

Producer Prices, Industrial Production, Rail Traffic, Container Exports


This is not a reason to hike rates, but the Fed has other reasons beginning with their mistaken belief that the current policy is ‘highly accommodative’ and potentially inflationary, etc. etc. etc. when the opposite is the actual case:

er-8-15-1

Up a bit more than expected, but all due to auto production, and yesterday’s wholesale trade report told us it all went to building (unsold) inventory, with sales of domestic cars relatively flat, so look for a reversal over the next few months. And note the reference to weak exports:

Industrial Production
er-8-15-2

Highlights
A 10.6 percent surge in motor vehicle production gave a very significant lift to industrial production which rose 0.6 percent in July. The manufacturing component, which has been flat all year, jumped 0.8 percent. Excluding vehicles, however, manufacturing rose only 0.1 percent. The lack of strength here is the result of business equipment which edged only 0.1 percent higher after declining 0.2 percent in June.

The rise in production drove capacity utilization up 3 tenths to 78.0 percent which is where it was back in April. Capacity utilization for manufacturing rose 5 tenths to 76.2 percent.

The two non-manufacturing components are mixed. Production at utilities, due to July’s cool weather, fell 1.0 percent with capacity utilization down 8 tenths to 79.1 percent, while mining production rose 0.2 percent with capacity utilization down 1 tenth to 84.4 percent.

Weak foreign demand and weakness in the energy sector may be hurting much of the industrial sector but these factors are not at play in the domestic auto industry. The readings in today’s report are mixed but the headline gain, driven by the convincing strength for autos, is an eye catcher and will certainly be ammunition for the hawks at next month’s FOMC meeting.

er-8-15-3


Weaker than expected and continuing to fade some (in line with stocks…), and note that it peaked with the fall in oil prices:

er-8-15-4

Rail Week Ending 08 August 2015: Continued Decline of One Year Rolling Average

By Steven Hansen
August 13 (Econintersect)

Econintersect: Week 31 of 2015 shows same week total rail traffic (from same week one year ago) contracted according to the Association of American Railroads (AAR) traffic data. Intermodal traffic expanded year-over-year, which accounts for approximately half of movements. and weekly railcar counts continued in contraction.

U.S. Containerized Exports Fall Off the Chart

By Wolf Richter
August 13 (Wolf Street)

“Many of our major trading partners are experiencing stalled or slowing economies, and the strength of the US Dollar versus other currencies is making US goods more expensive in the export market.” That’s how the Cass/INTTRA Ocean Freight Index report explained the phenomenon.

What happened is this: The volume of US exports shipped by container carrier in July plunged 5.8% from an already dismal level in June, and by 29% from July a year ago. The index is barely above fiasco-month March, which had been the lowest in the history of the index going back to the Financial Crisis.

The index tracks export activity in terms of the numbers of containers shipped from the US. It doesn’t include commodities such as petroleum products that are shipped by specialized carriers. It doesn’t include exports shipped by rail, truck, or pipeline to Mexico and Canada. And it doesn’t include air freight, a tiny percentage of total freight. But it’s a measure of export activity of manufactured and agricultural products shipped by container carrier.

Overall exports have been weak. But the surge in exports of petroleum products and some agricultural products have obscured the collapse in exports of manufactured goods

er-8-15-5

macro update

Saudis remain price setter:

saudi-june

Main theme: deflationary biases

Greece is a deflationary event, as EU aggregate demand is further restricted, with no sign of any possibility of fiscal relaxation.

Oil fell as Saudis increased discounts, further reducing global capex and related asset prices.

US oil production that gets sold counts as GDP, and for Q3 both production and prices look to be lower. Yes, the lower price also reduces the deflator, but the fall in the price of oil relative to other prices reduces GDP.

The decline in oil prices has also directly lowered income earned from oil sales, royalties, etc. plus ‘multipliers’ as that lost income would have been ‘respent’ etc. This loss has been at least 1% of GDP and completely ignored by analysts who have been over forecasting growth by several % since oil prices declined.

And the more than 50% decline in drilling due to the lower prices = declining production as oil (and gas) output from existing wells declines over time. This means both less GDP and higher imports, a negative bias for the dollar.

Trade flows remain euro friendly and are taking over the price action, and trade will continue to put upward pressure on the euro until the trade surplus is reversed.

The stronger euro vs the dollar initially helps US stock psychology via earnings translations, etc. but hurts euro zone stocks, exports, GDP, etc. reversing this year’s growth forecasts. And a weaker euro zone economy is also a negative for the US.

Oil capex is down and not coming back until prices rise, and the US budget deficit is down further as well, and I see nothing else stepping up to replace the reduced private and public deficit spending that was offsetting the demand leakages (unspent income) inherent in the institutional structure that grows continuously. So unlike last year, when oil capex did the heaving lifting, I expect any bounce in Q2 gdp from Q1 to be modest and transitory.

The Fed may raise rates some not because of the state of the economy, but due to fears that current policy somehow risks some kind of financial instability. No discussion, of course, that Japan has had a 0 rate policy for over 20 years with perhaps the highest level of financial stability in the history of the world, perhaps indicating that a 0 rate policy promotes financial stability…

Employment seems to have begun to decelerate as well, with fewer new jobs each month and claims beginning to rise.

Unlike the last recovery that ended suddenly with a financial crisis that cut off credit, this one is ending with a fall off in aggregate demand from oil capex due to the Saudis cutting oil prices, so the sequence of events has not been the same. But, as always, it’s just a simple unspent income story.

Comments on Greece

So the euro is down a % or 2 because of the Greek debt drama. Generally currencies go down on debt drama when the debt is in a foreign currency and it’s feared the govt will have to sell local currency to get the fx to make the payments. For example, the peso might go down should there be concern over Mexico paying the IMF in dollars. But with Greece this isn’t the case, as there’s no fear they will sell euro to get euro to make payments. But the players sell euro anyway, because that’s what you do when there is a debt crisis. Then they have to buy them back, with no state selling to help them cover.

What’s been exposed yet again is a world that doesn’t understand its monetary systems, including central bankers who don’t understand banking, as well as the mainstream media and all of the politicians and their finance ministers talking and doing the big stupid at the expense of their electorate, which also doesn’t understand it enough to have any awareness whatsoever of the total lack of expertise at the highest levels.

Meanwhile, at the macro level, deflationary policy continues including negative rates, QE, tight fiscal, structural reforms, and all that goes with it. And debt defaults, should they happen are also deflationary. And all of this deflationary bias is also evidenced by most all market prices.

China, Bunds, and Fed’s labor market index

As if rate cuts will help:

China cuts interest rates for third time since Nov as economy sputters

May 10 (Reuters) — China’s central bank cut its benchmark lending rate by 25 basis points to 5.1 percent on Sunday, its third reduction since November, as economic growth cools to levels not seen since the global financial crisis.

The People’s Bank of China (PBOC) also reduced one-year benchmark deposit rates by 25 basis points to 2.25 percent, it said in a statement on its website, adding that the reductions would be effective on May 11.

This is a ‘blow up’? All the way up to half a percent for a 10 year bund…

Markets blew up the bunds and helped Greece

er-5-11-1

No one still quite knows what this is:

United States : Labor Market Conditions Index
er-5-11-2
Highlights
The labor market is very soft based on the Fed’s labor market conditions index which is in negative ground for a second straight month, at minus 1.9 in April vs a downward revised minus 1.8 in March. These are the first negative readings in 3 years and follow last week’s April employment report which was no better than mixed. Based on this report, which takes a broad view of the labor market, the Fed will be in no hurry to raise rates. But two reports later this week have definitely been signaling strength in the labor market: JOLTS on Tuesday and jobless claims on Thursday.

Euro update and anecdotal econ news

This gives you a pretty good idea of the magnitude of euro selling by central banks. The question is when are they finished, and perhaps, when foreign exporters again pressure their cb’s to increase holdings to target the euro zone for exports, which is the reason the cb’s originally bought the euro.

And note that the current account surpluses indicate the EU may be through the ‘j curve’ as net exports continue to move higher with the foreign cb induced currency depreciation.

Of course QE and negative rates continue to work to strengthen the euro, as the does the current account surplus, so it’s just a matter of time before the fundamentals overtake CB selling. The problem is timing… ;)

Euro’s Reserve Status Jeopardized as Central Banks Dump Holdings

By Kevin Buckland David Goodman

April 10 (Bloomberg) — Quantitative easing may be helping Europe achieve its economic targets, but it’s also undermining the long-term viability of the euro by tarnishing its allure as a global reserve currency.

Central banks cut their euro holdings by the most on record last year in anticipation of losses tied to unprecedented stimulus. The euro now accounts for just 22 percent of worldwide reserves, down from 28 percent before the region’s debt crisis five years ago, while dollar and yen holdings have both climbed, the latest data from the International Monetary Fund show.

“As a reserve currency, the euro is falling apart,” said Daniel Fermon, a strategist at Societe Generale SA in Paris. “As long as you have full quantitative easing, there’s no need to invest. The problem for the moment is we don’t see a floor for the currency. Money’s flowing out.”

European Central Bank President Mario Draghi has in the past welcomed the drop-off in reserve managers’ holdings because a weaker exchange rate makes the continent more competitive. Yet firms including Mizuho Bank Ltd. warn the currency’s waning popularity reflects a more lasting loss of confidence in an economy that shrank in two of the past three years.

Sinking Economically

The decline in euro reserves suggests other central banks consider the ECB’s 1.1 trillion euros ($1.2 trillion) of QE bond purchases, which started a month ago, to be the biggest threat to the currency’s global status since its 1999 debut.

Greece’s debt woes aren’t helping, either. The ECB ramped up the emergency funding available to Greek banks Thursday to alleviate the country’s worsening liquidity issues amid drawn-out negotiations over its bailout.

Outright Sales

National Australia Bank Ltd. estimates reserve managers sold at least $100 billion-worth of euros in the fourth quarter of 2014.

“Most of the fall in the euro share represented outright selling of euros” rather than simply reflecting declines in the exchange rate, said Ray Attrill, the bank’s global co-head of currency strategy in Sydney.

Of the $6.1 trillion of reserves for which central banks specify a currency, the proportion of euros fell in every quarter of 2014, IMF data show. Last year was also the first time euro holdings fell in cash terms.

Euro Weakening

Yen holdings increased in three of the four quarters and make up 4 percent of the total, up from as low as 2.8 percent in early 2009. Dollars account for the biggest proportion at 63 percent after reserve managers increased their holdings in the final six months of last year. That’s down from as much as 73 percent in 2001.

The changes came as the yen and euro each sank 12 percent versus the greenback last year. The euro has tumbled about the same amount since then, which should further shrink its presence in central banks’ war chests.

The euro’s also falling against its broader peers, dropping more than 7 percent this year among a basket of its Group of 10 nations tracked by Bloomberg Correlation-Weighted Indexes, the biggest decline in the group. The dollar climbed almost 7 percent on the prospect of higher U.S. interest rates, beating a gain of about 6 percent in the yen.

EU current account:
eu-current-account

wholesale-originations

NACM’s Credit Managers Index Drops Even Further in March

The March report of the Credit Managers’ Index (CMI) from the National Association of Credit Management (NACM) fell further this month indicating that some serious financial stress is manifesting in the data.

“We now know that the readings of last month were not a fluke or some temporary aberration that could be marked off as something related to the weather,” said NACM Economist Chris Kuehl. “These readings are as low as they have been since the recession started and to see everything start to get back on track would take a substantial reversal at this stage.”

The combined score of 51.2 is moving dangerously close to contraction zone. The index of favorable factors dropped to 55.4 while the unfavorable factors drastically fell to 48.5–a place this index has not seen since after the end of the recession. “The signal this sends is that many companies are not nearly as healthy as it has been assumed and that there is considerably less resilience in the business sector than assumed,” said Kuehl.

Most categories showed decreases this month, but the real damage occurred in the unfavorable changes categories. According to Kuehl, the most disturbing drop happened in the rejection of credit applications category, which fell from 48.1 to an even weaker 42.9. The accounts placed for collection fell to 49.8, disputes improved slightly to 49, dollar amount beyond terms fell to 45.5, and dollar amount of customer deductions dropped to 48.7.

Rail Week Ending 04 April 2015: Weakness Continues

(Econintersect) — Week 13 of 2015 shows same week total rail traffic (from same week one year ago) again declined according to the Association of American Railroads (AAR) traffic data. Intermodal traffic, which accounts for half of movements, is growing year-over-year – but weekly railcar counts remain in contraction. Rail traffic remains surprisingly weak.

Baltic Dry Index is Now Below the Great Recession Low

By: John O’Donnell

April 11 (Econintersect) — The Baltic Dry Index is considered a coincident and leading indicator for global economic growth. It tracks the cost of shipping bulk commodities around the world. The BDI is now below the level reached during the Great Recession.
35358334baltic.Dry.Index