Mtg prch apps, CPI, Housing starts, Industrial production

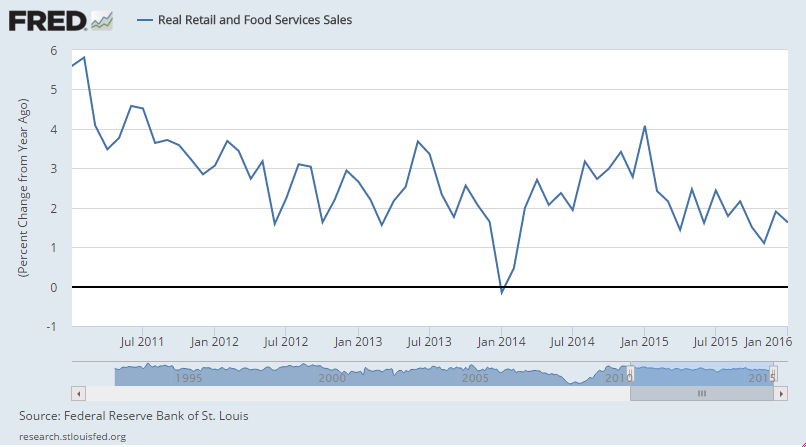
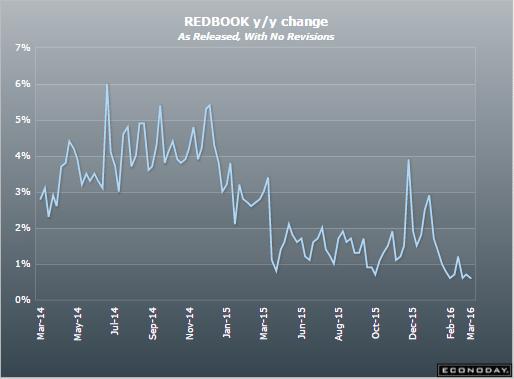
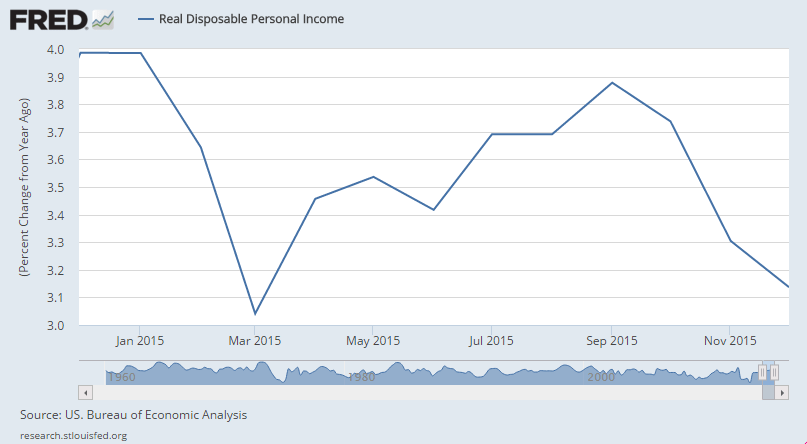
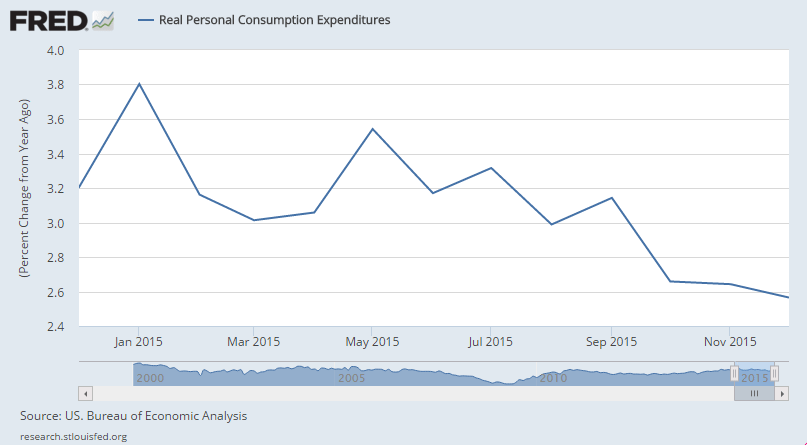
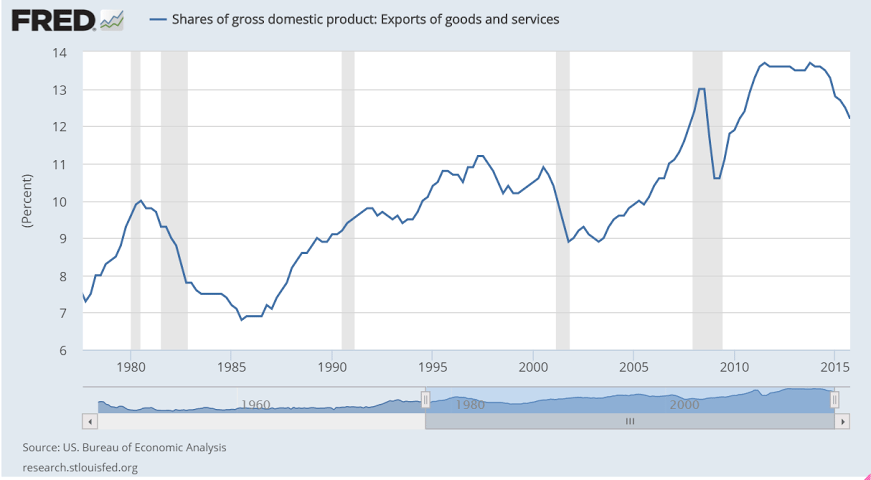
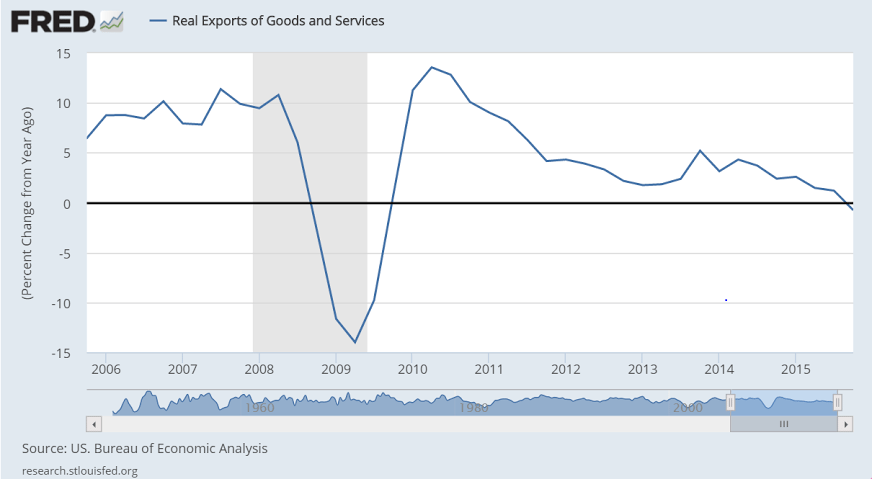
Working their way a bit higher but still seriously depressed:
er-3-16-1
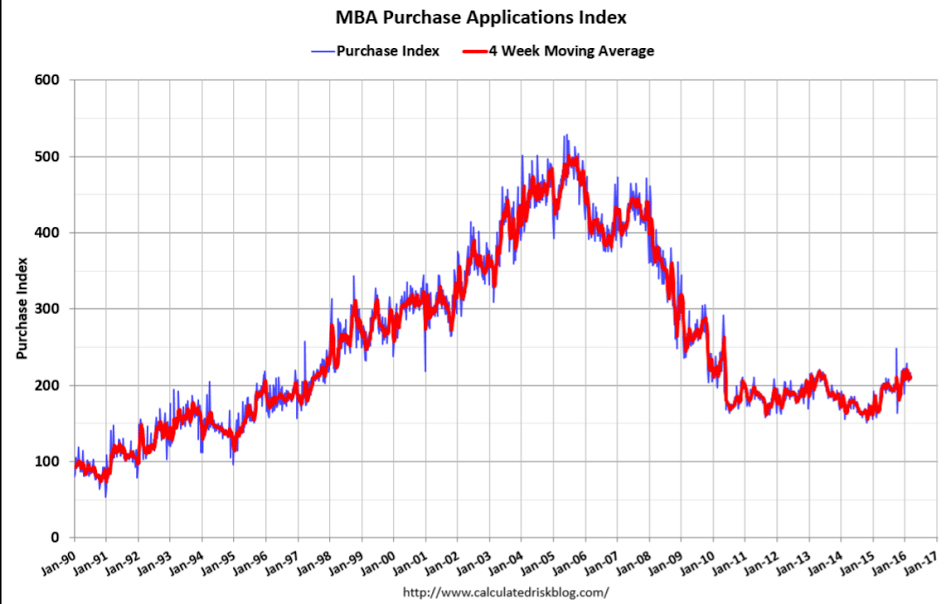
With the year over year CPI increase now only 1% the Fed can only wait and see if headline will catch up to core and ‘justify’ their tightening bias.

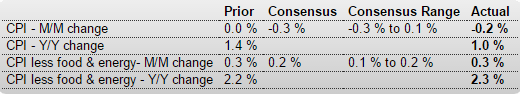
Consumer Price Index
er-3-16-2
Highlights
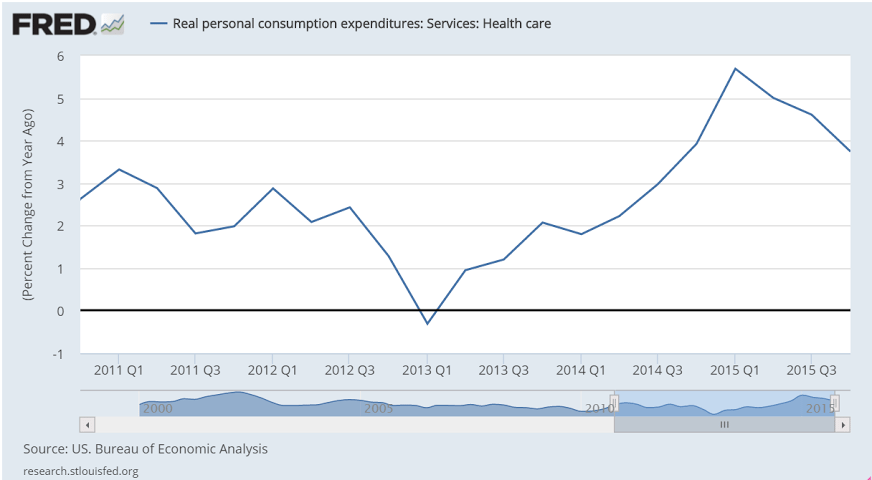
The CPI core is showing pressure for a second month, up a higher-than-expected 0.3 percent in February with the year-on-year rate up 1 tenth to plus 2.3 percent and further above the Federal Reserve’s 2 percent line.

Gains are once again led by health care with medical care up 0.5 percent for a second straight month which includes a 0.9 percent gain for prescription drugs. Shelter also shows pressure, up 0.3 percent as does apparel which is up 1.6 percent for a second straight sharp gain. Food rose percent 0.2 percent with the year-on-year rate at plus 0.9 percent.

Energy prices, which may be on the climb this month, fell a sharp 6.0 percent in February and pulled down the total CPI which came in at minus 0.2 percent with the year-on-year rate at plus 1.0 percent.

But it’s not the total that Fed officials will be watching but the core which — for a second straight month — is signaling what policy makers want, that is upward pressure. This report isn’t dramatic enough to revive much chance for a rate hike at today’s FOMC but it will offer strong arguing point for the hawks.

er-3-16-3
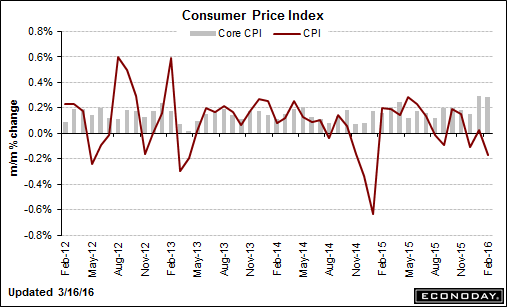
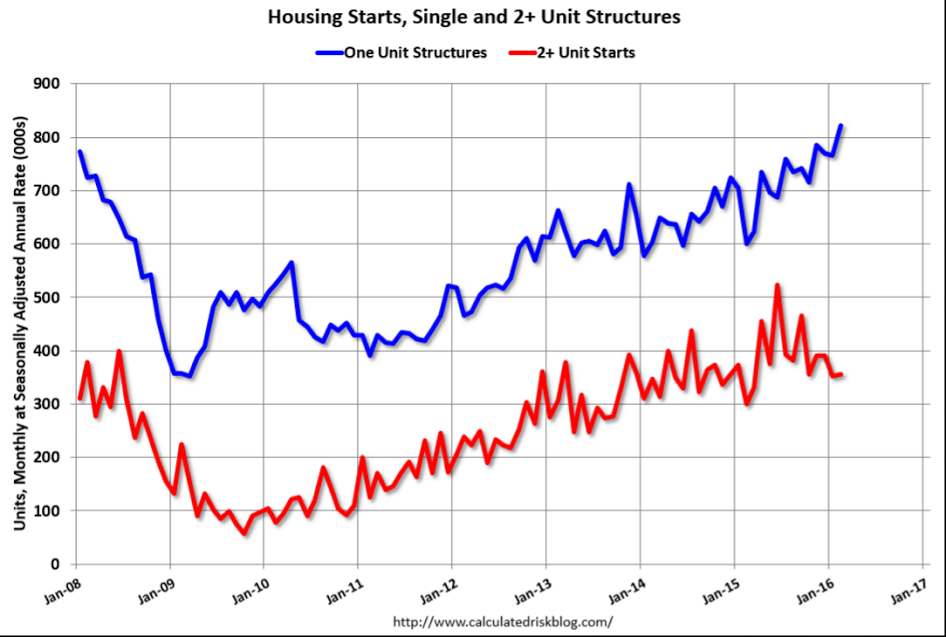
There are no starts without permits, and permits are down:

Housing Starts
er-3-16-4
Highlights
Housing starts & permits are mixed with starts way up but permits, which are the more important of the two, way down. Starts rose 5.2 percent to a 1.178 million annualized rate while permits, which were expected to show no change, dropped 3.1 percent to 1.167 million.

The gain for starts is split between a 7.2 percent surge for single-family homes and a 0.8 percent gain for the multi-family component while the drop for permits is centered in multi-family, down 8.4 percent to a 436,000 rate. But permits for single-family homes, and this is the silver lining in this report, are up 0.4 percent to 731,000. The multi-family component, driven by investment demand, is often very volatile which makes single-family homes the more telling of the two.

Year-on-year, single-family permits are up a very strong 16.8 percent offsetting a 7.6 percent dip on the multi-family side. Regional data for permits show the Northeast out in front with a nearly 36 percent gain and the South in the rear at minus 1.8 percent. The West, which is a key region for new housing, is up 6.5 percent.

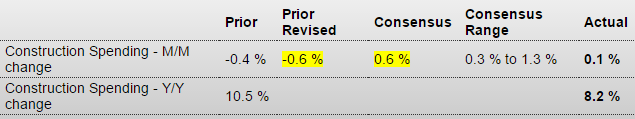
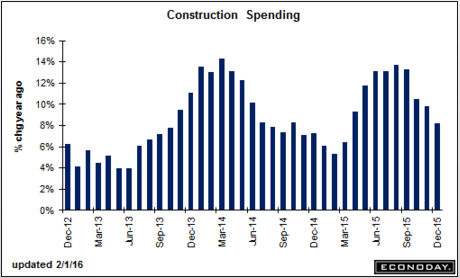
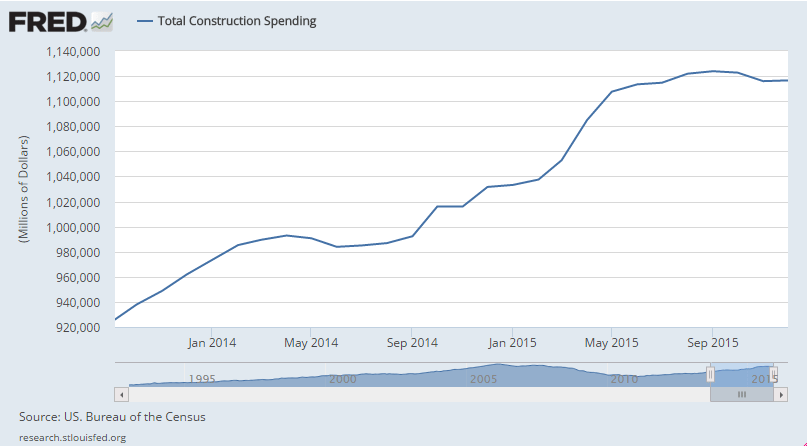
The gain for starts will boost ongoing estimates for construction spending while the small gain for single-family permits may help ease concern that housing is losing momentum.

er-3-16-5
And more confirmation that multifamily peaked last June when the NY tax credits expired:
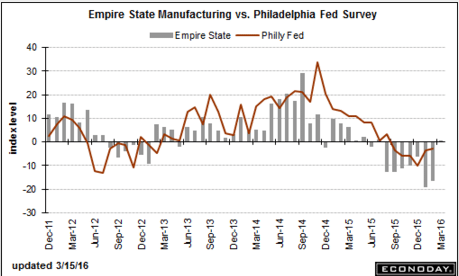
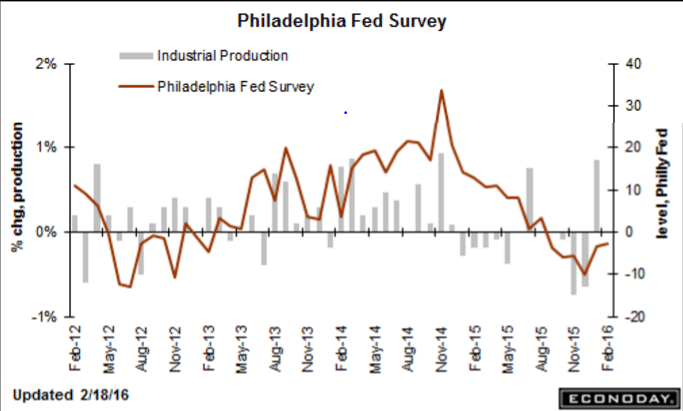
er-3-16-6
And more bad:

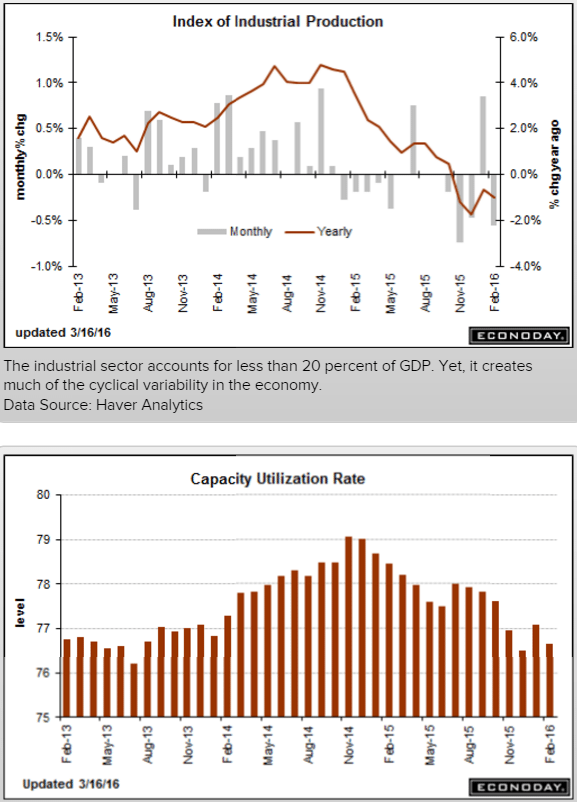
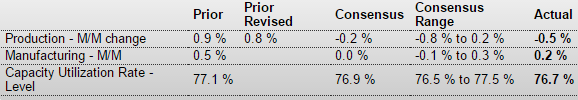
Industrial Production
er-3-16-7

Highlights
Industrial production fell 0.5 percent in February but includes a respectable and higher-than-expected 0.2 percent gain for manufacturing production which pulls this report to the positive column for the economic outlook. The utility component, down 4.0 percent in February after rising 4.2 percent in January, is very volatile reflecting month-to-month swings this time of year in heating demand. The mining component, down again at minus 1.4 percent, has been weak for the last year reflecting the price collapse for commodities.

But the manufacturing component is the telling component with strength belying broad weakness in regional surveys and pointing perhaps to better-than-expected output for the first quarter. Vehicles have been a center of strength for manufacturing, though production here did slip 0.1 percent in the month, while business equipment is suddenly showing life, up 0.6 percent for a second straight month. The gain for this component hints at a revival for business investment.

Capacity utilization overall is down 0.4 percentage points to 76.7 percent though manufacturing capacity, again the reading to focus on, is unchanged at 76.1 percent. The factory sector has been getting pulled back by weak exports and weak demand for energy equipment though this report, together with positive indications in yesterday’s Empire State report, do suggest, or at least offer the hint, that the worst may over.

Note that the traditional non-NAICS numbers for industrial production may differ marginally from the NAICS basis figures.
er-3-16-8

Retail sales, Redbook retail sales, Housing index, Business inventories and sales, Empire manufacturing, MEW, Atlanta Fed

Just plain bad. Including last month’s downward revision.

And, again, sales = income, and lower income means less to spend in the next period:

Retail Sales
er-3-15-1
Highlights
Consumer spending did not get off to a good start after all in 2016 as big downward revisions to January retail sales badly upstage respectable strength in February. January retail sales are now at minus 0.4 percent vs an initial gain of 0.2 percent. The two major sub-readings also show major downward revisions with ex-auto sales now down 0.4 percent vs an initial gain of 0.1 percent and ex-auto ex-gas sales now at minus 0.1 percent from plus 0.4 percent. The latest for this latter core rate is really the main positive in today’s report, up a solid 0.3 percent in February. Total sales for February are weak at minus 0.1 percent as is the ex-auto reading, also at minus 0.1 percent.

But even in the core readings, details are not great with strength so far this year mixed across nearly all categories. Still, year-on-year strength is evident in two key discretionary components which are vehicles, up 6.8 percent, and restaurants which are up 6.4 percent. Non-store retailers, benefiting from growth in ecommerce, are up 6.3 percent. Sporting goods, a smaller discretionary category, are up 6.7 percent. And building materials & garden equipment, in a sign of strength for residential investment, are up 12.2 percent. The downside includes electronics & appliances which are at minus 3.2 percent and department stores down 2.2 percent. The weakest of all of course are gasoline stations, down 15.6 percent on the year as low fuel prices depress dollar sales.

Given the skewing effect of gasoline, the ex-gas total is important to look at it and it’s up 0.2 percent in the month for very respectable yearly growth of 4.8 percent. This reading underscores the silver lining in the report, that retail sales, despite all the negatives, are moving in the right direction. January and February are the lowest sales months of the year, a fact that magnifies adjustment effects and can cause volatility in the readings. But that aside, consumer spending, despite high employment, is struggling to break out of a flat run that included a very soft holiday season.

er-3-15-2
This is year over year change, adjusted for inflation:
er-3-15-3
er-3-15-4

While U.S. retail sales fell less than expected in February, the sharp downward revision to January’s sales could be “devastating” for investors, CNBC’s Jim Cramer said Tuesday.

“I’m just kind of flummoxed. A number comes out that makes us feel great, and then that number is taken away,” Cramer said on “Squawk on the Street.”

;)

Another bad one:

Housing Market Index
er-3-15-5
Highlights
Demand for new homes is solid but lack of available lots and shortages in construction labor are holding back growth. The housing market index came in unchanged in March at a 58 level which however remains well above breakeven 50. Present sales, unchanged at a strong 65, lead the March report followed by future sales which are down 3 points to 61. A plus, however, is a 4 point gain to 43 for buyer traffic which has been weak this whole cycle.

The gain in traffic hints at the drawing power of low mortgage rates and speaks to the strength of the labor market. But there hasn’t been much acceleration in housing nor is any expected in tomorrow’s permits data. The housing sector, which was billed as a strength for 2016, has yet to build any momentum this year.

Also bad:

Business Inventories
er-3-15-6
Highlights
It’s been a weak morning for U.S. economic data and business inventories are no exception. Inventories rose an unwanted 0.1 percent in December against a 0.4 percent decline for sales in a mismatch that drives the stock-to-sales ratio from 1.39 to 1.40 for the fattest reading of the whole cycle, since May 2009. Inventories fell for factories but rose for wholesalers and also for retailers. Sales, however, fell for both retailers and especially for wholesalers. Heavy inventories are a negative for future production and future employment and today’s report points to slowing for both during the first quarter.

er-3-15-7
Better than expected but still weak:

Empire State Mfg Survey
er-3-15-8
Highlights
After seven straight months of contraction, the general conditions index of the Empire State report is back in the plus column, though just barely at 0.62 in a reading that signals fractional strength for factory activity during March. New orders are the report’s most convincing headline, at plus 9.57 to end nine straight months of contraction. Unfilled orders, however, remain in contraction, but only slightly at minus 3.96, as does employment at minus 1.98. Inventories are in contraction as are selling prices. Yet still, the 6-month outlook is picking up, to plus 25.53 for a more than 10 point gain. Shipments are also positive, at 13.88 in what points to strength for the manufacturing component of the March industrial production report, the February edition of which will be posted tomorrow and is expected to be flat. Flat is really the theme of this report which, compared to the deep contraction of prior reports, is relatively good news for a factory sector that has been getting hit by weakness in exports and energy equipment.

er-3-15-9
er-3-15-10
No sign of credit expansion here:
er-3-15-11
er-3-15-12

Wholesale trade

As previously discussed, GDP was only as high as it was due to increases in unsold inventory- not good!

Wholesale Trade
er-3-9-1
Highlights
Wholesalers had been keeping their inventories down as sales have slowed but they got behind in January. Inventories rose 0.3 percent in the month which isn’t alarming in itself but relative to sales, which fell 1.3 percent, inventories look heavy. The stock-to-sales ratio rose two notches to 1.35 from 1.33 for the highest reading of the recovery, since April 2009.

Industries where inventories rose relative to sales include furniture, farm products, computers, and autos. Very few industries at the wholesale level show leaner levels in the month.

Year-on-year, wholesale inventories are up 2.0 percent against a 3.1 percent decline for sales. Increases for inventories are a positive for GDP calculations but not for the production or employment outlooks nor for business confidence. Heavy inventories were a question during the fourth quarter and may be becoming one for the first quarter as well.

er-3-9-2

Posted in GDP

GDP, Trade, Personal income and outlays, Consumer sentiment, China deficit spending, 7DIF, US surveys, German business morale

Revised up but for the worst reasons possible- unsold inventories were higher. Also, consumption expenditures were a bit lower, and note the deceleration of GDP growth on the chart. And in all likelihood Q1 GDP is now being reduced by inventory liquidation substituting for production:

GDP
er-2-26-1
Highlights
An upward revision to inventory growth made for an upward revision to the second estimate of fourth-quarter GDP, to an annualized plus 1.0 percent rate for a 3 tenths increase from the initial estimate. But, given slowing in demand during the quarter, the gain for inventories, at $81.7 billion vs an initial estimate of $68.6 billion, very likely reflects a build in unwanted inventories.

A clear negative in today’s report is a downgrade for personal consumption expenditures, to an annualized plus 2.0 percent in the quarter vs an initial estimate of 2.2 percent. Otherwise, revised readings are steady to unchanged with non-residential investment, hit by the mining and energy sectors, down at a 1.9 percent rate and exports down at an even steeper 2.7 percent rate. Residential investment remains the big plus, rising at an 8.0 percent rate. But final sales were slow in the quarter, up only 1.2 percent.

The economy, held down by weak exports and weak business investment, fumbled into year-end 2015, but the early outlook for the first quarter calls for a turn higher to trend growth, perhaps as much as 3 percent. Key data for the first quarter will be posted later this morning with the January personal income and expenditures report.

er-2-26-2
Worse than expected which means GDP is running that much less then expected:

International Trade in Goods
er-2-26-3
Highlights
In a report pointing to economic weakness, the nation’s trade gap in goods widened 1.2 percent in January to $62.2 billion as exports fell 2.9 percent to offset a 1.5 percent fall in imports (imports are a subtraction in the national accounts). Exports fell across the board including industrial supplies at minus 3.0 percent in the month and capital goods down 2.3 percent. The decline in imports included a steep 6.8 percent drop in industrial supplies and a 2.4 percent decline for capital goods. The declines in industrial supplies are tied in part to low prices for oil and petroleum products while the declines in capital goods points to lack of global confidence in the business climate and lack of business investment in global productivity. This report represents the goods portion of the monthly international trade report which will be posted next Friday.

Better than expected, as spending was up from a very low December and a weak q4 that was today further revised down. And note that these number as well are subject to revisions over the coming months, with the spending numbers somewhat at odds with sales reports.

Personal Income and Outlays
er-2-26-4
Highlights
There’s plenty of life in the consumer. Personal income jumped 0.5 percent in January as did consumer spending, both readings higher than expected. Also higher than expected are the report’s inflation readings especially the core PCE which rose 0.3 percent for a year-on-year plus 1.7 percent.

Details are solidly positive with components on the income side led by wages & salaries, up a very strong 0.6 percent for the third large gain of the last four months. And consumers didn’t draw from savings on their January shopping spree, with the savings rate unchanged at a very solid 5.2 percent.

Components on the spending side are led by durable goods which jumped 1.2 percent and reflect strong vehicle sales in the month. Spending on services rose 0.6 percent in the month.

But the big story of the report is the core PCE, especially the year-on-year rate which is up from 1.4 percent to 1.7 percent and is pointing confidently toward the Fed’s 2 percent line. Total prices, which include food and energy, rose only 1 percent but the year-on-year rate for this reading has been on a tear, moving from about zero late last year to plus 1.3 percent in January.

Economic news outside of the consumer has been soft but today’s report is a reminder that the nation’s most important supporter is alert and in the driver’s seat. A strong consumer, who is benefitting from a strong labor market, together with the upward pivot for inflation will not make policy makers comfortable at next month’s FOMC where a rate hike, though long dismissed, may be a serious topic of discussion.

er-2-26-5
er-2-26-6

China considers itself bound by that treaty too??? Good luck to them. 4% isn’t near high enough to replace the lost private sector credit growth needed to sustain output and employment:

China could raise budget deficit to 4% of GDP:central bank official

Feb 25 (China Daily) — China could raise its budget deficit to 4 percent of GDP or even higher to offsetthe impact of reduced fiscal revenue and to support broader reforms, a central bank official said. In an article published by “The Economic Daily,” director of the central bank’s surveys andstatistics department Sheng Songcheng said the deficit increase would not incur biginsolvency risks for the government. China raised its budget deficit to 2.3 percent of GDP in 2015, up from 2.1 percent in 2014. A3-percent deficit ratio, as stated in the 1992 Maastricht Treaty, is normally considered a redline not to be crossed.

My book intro talk in Germany:


er-2-26-7
er-2-26-8

Architectural Billings, JPM chart, GDP forecasts

Down into contraction:

From the AIA: Slight Contraction in Architecture Billings Index

Following a generally positive performance in 2015, the Architecture Billings Index has begun this year modestly dipping back into negative terrain. As a leading economic indicator of construction activity, the ABI reflects the approximate nine to twelve month lead time between architecture billings and construction spending. The American Institute of Architects (AIA) reported the January ABI score was 49.6, down slightly from the mark of 51.3 in the previous month. This score reflects a minor decrease in design services (any score above 50 indicates an increase in billings). The new projects inquiry index was 55.3, down from a reading of 60.5 the previous month.

er-18-1
er-18-2
er-18-3

Posted in GDP

Philly Fed, leading indicators, jobless claims

Another bad one, and supports the possibility of another downward revision to industrial production next month:

Philadelphia Fed Business Outlook Survey
er-2-18-1
Highlights
The Philly Fed report, much like Tuesday’s Empire State report, is pointing to continuing trouble for the nation’s factory sector. The general business conditions index came in at minus 2.8 to extend a long run of negative readings. New orders, at minus 5.3, have also been stuck in the minus column as have unfilled orders, at minus 12.7. Shipments, at plus 2.5, are positive for a second straight month but aren’t likely to hold above zero for very long given the weakness in orders. Employment is in the contraction column for a second straight month at minus 5.0 with the workweek also posting a second month of contraction at minus 12.9. Manufacturers in the region continue to draw down inventories, to indicate sagging expectations, with the 6-month outlook down nearly 2 points to 17.3 which is still in the plus column but very low for this reading. Price data continue hold in the negative column. This report is a disappointment and belies yesterday’s manufacturing strength in the industrial production report.

er-2-18-2
Hard to imagine from this chart that the US isn’t already in recession:
er-2-18-3
This series is biased towards positive numbers as it presumes a positive yield curve supports future growth, and with rates near 0 the yield curve is pretty much always going to be positive. So when it goes negative like this, it means the rest is that much more negative:

Leading Indicators
er-2-18-4

er-2-18-5
My point here remains that you can have no new claims AND no new hiring. And in any case states have made it more difficult to collect benefits, which are both low and fully taxable, so this could be the type of recession where hiring continues to decelerate and attrition continues without an increase in involuntary separations followed by filing for benefits:

Jobless Claims
er-2-18-6

Personal income and spending, ISM manufacturing, construction spending

Spending still not good, and GDP *is* spending. Personal income growth remains low, but is higher than spending. I suspect this gets reconciled with downward revisions to income over time, perhaps due to downward revisions to employment.

With GDP growth near flat employment growth implies more employees are being hired to produce the same levels of output, which sends up a red flag for downward revisions to employment.

Personal Income and Outlays
er-2-1-2
Highlights
Consumers had a healthy December but kept the money to themselves. Personal income rose a solid 0.3 percent with the savings rate moving 2 tenths higher to 5.5 percent, its strongest level since December 2012. Wages & salaries, however, slowed to only plus 0.2 percent in the month but follow outsized gains of 0.5 and 0.6 percent in the prior two months. Service industries lead the pay data with manufacturing pay in contraction. Proprietors’ income rose in the month along with rental income while income receipts were down on lower interest income, the latter reflecting, despite the Fed’s rate hike, the downdraft in rates.

Spending, as retailers already know, was very soft, unchanged with only services showing a gain. December spending on both durable and non-durable goods fell 0.9 percent each, the former reflecting weak spending on holiday gifts and also vehicles and the latter reflecting lower hitting bills. A partial offset is a 2 tenths upward revision to November’s spending to plus 0.5 percent.

er-2-1-3
er-2-1-4
More bad, and downward revisions as well:

ISM Mfg Index
er-2-1-5
Highlights
Employment sank the ISM index in January which could muster no better than a 48.2 for what, following annual revisions to 2015, is the fourth sub-50 reading in a row. This is by far the worst run for this closely watched indicator since the Great Recession days of 2009.

Employment fell a very steep 2.1 points to 45.9 to signal significant contraction for manufacturing payrolls in Friday’s employment report, which however would not be much of a surprise given the sector’s prior payroll contraction. This is the third sub-50 reading for employment of the last four months and the lowest reading since, once again, 2009.

There is good news in the report and that’s a snapback for new orders, to 51.5 for only the second plus 50 reading of the last five months and which points to overall improvement in the coming reports. But backlog orders, at only 43.0, remain in deep contraction, and what strength there is in orders isn’t coming from exports which are in contraction for the seventh of the last eight months. Manufacturers have been working down backlogs to keep production up, which came in at 50.2 to signal fractional monthly growth. Inventories remain steady and low but the sample still say they are too high, sentiment that points to lack of confidence in the business outlook.

Confirming the weakness is breadth among industries with 10 reporting composite contraction against eight reporting monthly growth. If it wasn’t for strength in new orders, January’s data would be almost entirely negative. This report is a downbeat opening to 2016 which follows a definitively downbeat year for the factory sector in 2015.

er-2-1-6
No mention of the NY tax breaks that expired in June:

Construction Spending
er-2-1-7
Highlights
Held down by weakness in the nonresidential component, construction spending didn’t get a lift at all from the mild weather late last year, rising only 0.1 percent in December following a downwardly revised 0.6 percent decline in November and a 0.1 percent contraction in October. Year-on-year, spending was up 8.2 percent, a respectable rate but still the slowest since March last year.

But there is very good news in the report and that’s a very strong 0.9 percent rise in residential construction where the year-on-year rate came in at plus 8.1 percent. Spending on multi-family units continues to lead the residential component, up 2.7 percent in the month for a 12.0 percent year-on-year gain. Single-family homes rose 1.0 percent in the month for an 8.7 percent year-on-year gain.

Now the bad news. Non-residential spending fell 2.1 percent following a 0.2 percent decline in November. Steep declines hit manufacturing for a second month with the office and transportation components also showing weakness. Still year-on-year, non-residential construction rose 11.8 percent.

Rates of growth in the public readings are led by highway & streets, at a 9.4 percent surge for December and a year-on-year rate of plus 12.0 percent. Educational growth ended 2015 at 9.4 percent with state & local at plus 4.4 percent. The Federal subcomponent brings up the rear at minus 1.4.

Lack of business confidence and cutbacks for business spending are evident in this report but not troubles on the consumer side, where residential spending remains very solid and a reminder that the housing sector is poised to be a leading driver for the 2016 economy. Still, the weak December and revised November headlines are likely to pull down, at least slightly, estimates for revised fourth-quarter GDP which came in at plus 0.7 percent in last week’s advance report.

A blind man can see this chart has been decelerating for a long time now:
er-2-1-8
Looks to me like it was growing but then flattened out not long after oil capex spending collapsed?
er-2-1-9
This is the ‘driver’ for 2016?
It’s only now just back to 2004 levels, and not growing nearly as fast as the prior cycle, and this chart isn’t adjusted for inflation, which brings it’s influence down that much more:
er-2-1-10

GDP, Saudi oil production, KC Fed, Chicago PMI, Shale Italy and Japan comments

As expected, the deceleration continues, and over the next couple of years it wouldn’t surprise me if the entire year gets revised down substantially:

GDP
er-1-30-1
Highlights
Consumer spending is the central driver of the economy but is slowing, at least it was during the fourth quarter when GDP rose only at a 0.7 percent annualized rate. Final demand rose 1.2 percent, which is the weakest since first quarter last year but is still 5 tenths above GDP.

Spending on services, adding 0.9 percentage points, was a leading contributor to the quarter as was spending on goods, at plus 0.5. Residential investment, another measure of consumer health, rose very solidly once again, contributing 0.3 percentage points. Government purchases added modestly to growth.

The negatives are on the business side especially those facing foreign markets. Net exports pulled down GDP by 0.5 percentage points. Non-residential investment pulled down GDP by more than 0.2 percentage points. Reduction in inventory investment, which the FOMC warned about on Wednesday, pulled the quarter down by 0.5 percentage points.

Price data are not accelerating, at plus 0.8 percent for the GDP price index which is the lowest reading since plus 0.1 in the first quarter last year. The core price reading is only slightly higher, at plus 1.1 percent which is also the weakest reading in a year.

There are definitely points of concern in this report, especially the weakness in exports and business investment, but it’s the resilience in the consumer, despite a soft holiday season, that headlines this report and should help confirm faith in the domestic strength of the economy.

And this from JPM:

Consumer spending slowed to a 2.2% pace of advance, while business fixed investment spending contracted at a 1.8% rate, the first decline since 2012. A slowing in inventory investment subtracted 0.5%-point from growth last quarter. Even so, the pace of stockbuilding—a $69 billion annual rate—is still faster than is sustainable and poses an ongoing headwind to producers early in 2016. As such, after today’s report we see some more downside risk to our 2.0% projection for Q1 GDP growth.

The consumer looks to be going down hill to me, and this includes increases in total health care premiums due to the newly insured under Obamacare. This chart is not adjusted for inflation, which shows the growth of nominal spending has slowed dramatically. Fortunately the ‘deflator’ indicates that with prices down real purchases have been sustained. But consumers on average tend to spend most all of their incomes, which means fortunately for them prices didn’t rise as fast or they would have bought fewer real goods and services.

er-1-30-2
Here’s the last year of GDP year over year growth, after oil capex collapsed:
er-1-30-3
This is nominal GDP, not adjusted for inflation:
er-1-30-4
er-1-30-5
Note the relation between export collapses and recessions:
er-1-30-6
er-1-30-7
The increase in premium expenditures for the newly insured is a ‘one time’ event that offered support last year and won’t be repeated this year.
er-1-30-8
Interesting how even at the dramatically lowered prices due to increased discounts the Saudis appear to be selling less oil. Patiently waiting for March pricing to be released:
er-1-30-9
Yet another bad one:

Kansas City Fed Manufacturing Index
er-1-30-10

Highlights
Kansas City manufacturing, along with that of Dallas, are suffering the worst of any regions in the nation’s factory contraction. Kansas City came in at minus 9 for the ninth contraction in 10 months.

Minus signs sweep nearly all readings including new orders and backlogs which are in extremely deep contraction, at minus 27 and minus 36 respectively. Production is at minus 8 with shipments at minus 7. Employment is at minus 7 with price readings moving deeper into contraction, at minus 14 for raw materials and, ominously for inflation expectations, at minus 15 for finished products.

One of the few pluses in the report, ironically, is the index for new export orders which came in at a very modest plus 1. But it’s not only exports that have been pulling down the factory sector but also energy equipment, the latter which is especially sinking the nation’s energy patch.

Chicago PMI: Jan Chicago Business Barometer Jumps 12.7 Points to 55.6

The Chicago Business Barometer bounced back sharply in January, increasing 12.7 points to 55.6 from 42.9 in December, the highest pace of growth in a year.

Chief Economist of MNI Indicators Philip Uglow said, “While the surge in activity in January marks a positive start to the year, it follows significant weakness in the previous two months, with the latest rise not sufficient to offset the previous falls in output and orders. Previously, surges of such magnitude have not been maintained so we would expect to see some easing in February. Still, even if activity does moderate somewhat next month, the latest increase supports the view that GDP will bounce back in Q1 following the expected slowdown in Q4.”

“At current prices U.S. shale producers are losing more than $2 billion a week, according to consulting firm AlixPartners LLP.”

” Italian gross domestic product per capita has hardly changed in 20 years.”

And all they needed was a fiscal adjustment sufficient to get aggregate demand to appropriate levels:

Amari’s fall leaves Abenomics in lurch

Jan 29 (Nikkei) — “I bear responsibility for appointing him,” a visibly pained Abe told reporters Thursday following the resignation of Akira Amari, who also served as his right-hand man in the Trans-Pacific Partnership trade negotiations. Amari devised the basis for Abenomics. He helped alter LDP economic policy’s traditional bias toward public works, shifting the emphasis to a pro-growth strategy of making Japanese companies more competitive and innovative. After Abe led the LDP back to power in 2012, he put Amari in charge of the government’s new industrial competitiveness council and the reconstituted Council on Economic and Fiscal Policy.

Nor will this work, negative rates are just another tax:

BOJ adopts negative interest rates

Jan 29 (Nikkei) — The Bank of Japan decided to adopt negative interest rates at its policy meeting on Friday, voting 5-4 to apply an interest rate of -0.1 percent on current accounts that financial institutions hold at the central bank. At the same time, the BOJ revised its inflation forecast for fiscal 2016 down to 0.8% from a previous level of 1.4%. In a statement, the BOJ said it adopted the negative interest rate policy in order to achieve its price stability target of 2% at the earliest possible time, and signalled that it will “cut the interest rate further into negative territory if judged necessary.”

This might have had something to do with their decision:

Japan’s industrial output falls 1.4% in December, down for 2nd month

Jan 29 (Kyodo) — Japan’s industrial output in December fell a seasonally adjusted 1.4 percent from the previous month, in sharp contrast with a rise of 0.9 percent the government had projected based on hearings with manufacturers last month. The government said the trend of output is fluctuating without clear direction, maintaining its basic assessment of production from the previous month. For 2015, the industrial output index fell 0.8 percent from the previous year. The production index increased 2.1 percent in 2014. Polled manufacturers said they expect output to rise 7.6 percent in January and then fall by 4.1 percent in February.

Economic Index, Storefronts, Fed statement, Pending home sales, Durable goods orders

Also tracing the weakness back to the oil capex collapse:

Econintersect’s Economic Index declined and is barely positive – and still remains at the lowest value since the end of the Great Recession. The tracked sectors of the economy which showed growth were mostly offset by the sectors in contraction. Our economic index remains in a long term decline since late 2014.

The Fed got this highlighted first part right:

Information received since the Federal Open Market Committee met in OctoberDecember suggests that labor market conditions improved further even as growth slowed late last year.

No growth here:

Pending Home Sales Index
er-1-28-1
Highlights
Sales of existing homes popped higher in December but a further gain for January is uncertain given only a 0.1 percent rise in pending home sales which follows a downward revised 1.1 percent decline in November. It usually takes one to two months for contract signings to close with greater delays possible given new mortgage documentation rules that were implemented in November. Also raising doubts whether January will prove to be a solid month is this report’s narrow breakdown with the Northeast, the smallest of the housing regions, the only one in the positive column in the month, at 6.1 percent. The other three regions show declines with the sharpest in the West at minus 2.1 percent. Despite this report, recent news on the housing sector has been positive including gains for sales and also respectable appreciation for prices.

Negative and decelerating:

Durable Goods Orders
er-1-28-2
Highlights
The factory sector ended 2015 with a giant thud. Durable goods orders fell 5.1 percent in December vs expectations for a 0.2 percent gain and a low-end estimate of minus 3.0 percent. Aircraft orders didn’t help but they weren’t the whole cause of the problem as ex-transportation orders fell 1.2 percent vs expectations for no change and a low-end estimate of minus 0.4 percent. Core capital goods, which exclude defense equipment and also aircraft, are especially weak, down 4.3 percent following a 1.1 percent decline in November. Shipments for core capital goods, which are an input into GDP, slipped 0.2 percent following a downward revised 1.1 percent decline in November (initially minus 0.4 percent).

Orders for civilian aircraft lead the dismal list, down 29 percent in December. The other main subcomponent for transportation, motor vehicles, also fell, down 0.4 percent in a reminder that vehicle sales were slowing at year end. Capital goods industries show deep declines: machinery down 5.6 percent, computers down 8.7 percent, communications equipment down 21 percent, and fabricated metals down 0.5 percent.

Other readings include a surprising 2.2 percent monthly drop in total shipments and a 0.5 percent drop in total unfilled orders. All this weakness isn’t a plus for inventories which rose 0.5 percent to lift the inventory-to-shipments ratio sharply, to 1.69 from 1.64. The rise in inventories poses a headwind to the sector and will dampen future shipments as well as employment and is a reminder of the inventory warning in yesterday’s FOMC statement.

There’s been trouble brewing in the factory sector, recently indicated by the Empire State and Dallas Fed reports and also by the ISM index which has fallen below breakeven 50. Weak export markets, made weaker for U.S. manufacturers by the strength of the dollar, together with contraction in the energy sector may now be pushing the factory into an accelerated breakdown, at least that’s the concern.

Recession warnings, Dallas Fed

Reads like we are already in recession…

Recession Warnings May Not Come to Pass

Jan 24 (WSJ) — Every U.S. recession since World War II has been foretold by sharp declines in industrial production, corporate profits and the stock market. Industrial production has declined in 10 of the past 12 months, and is now off nearly 2% from its peak in December 2014. Corporate profits peaked around the summer of 2014 and were off by nearly 5% as of the third quarter of last year. The Dow Jones Industrial Average is down 7.6% so far this year. A Goldman Sachs analysis found that profit margins among the companies in the S&P 500 stock index—if energy companies are excluded—have been little changed over the past year.

So does this:

Dallas Fed Mfg Survey
er-1-25-1
Highlights
Manufacturing data from the Dallas Fed, along with that of the Kansas City Fed, have been offering the most striking evidence of oil-related contraction. Dallas’ general activity index came in at an extremely negative score of minus 34.6 for the January report which is the lowest reading since the beginning of the recovery in 2009.

New orders are falling deeper into contraction as are unfilled orders. Hours worked are now in the negative column as is employment. And finally falling into contraction — and in a big way — is the production index which had through last year, despite long weakness in orders, held in positive ground, but not anymore with the reading at minus 10.2 for a nearly 23 point monthly plunge. Price data in this report remain well into the minus column, at nearly double-digit monthly declines.

Manufacturing reports this month have been mixed, with this and Empire State pointing to another buckling but not the most closely followed report, the Philly Fed which is pointing to stability for the sector. Watch for the Richmond Fed report tomorrow and the Kansas City report on Thursday.

Recent History Of This Indicator
The Dallas Fed general activity index has been buried in deep contraction and, along with the Kansas City Fed report, have been suffering the greatest effects from the collapse in oil. The Econoday median is calling for a 13th straight month of contraction, at a steep minus 14.0 for January vs December’s minus 20.1. Production has held in the plus column for this report but the outlook for continued strength is not supported by new orders which have been in contraction for 14 months.

er-1-25-2