Producer Prices, Industrial Production, Rail Traffic, Container Exports


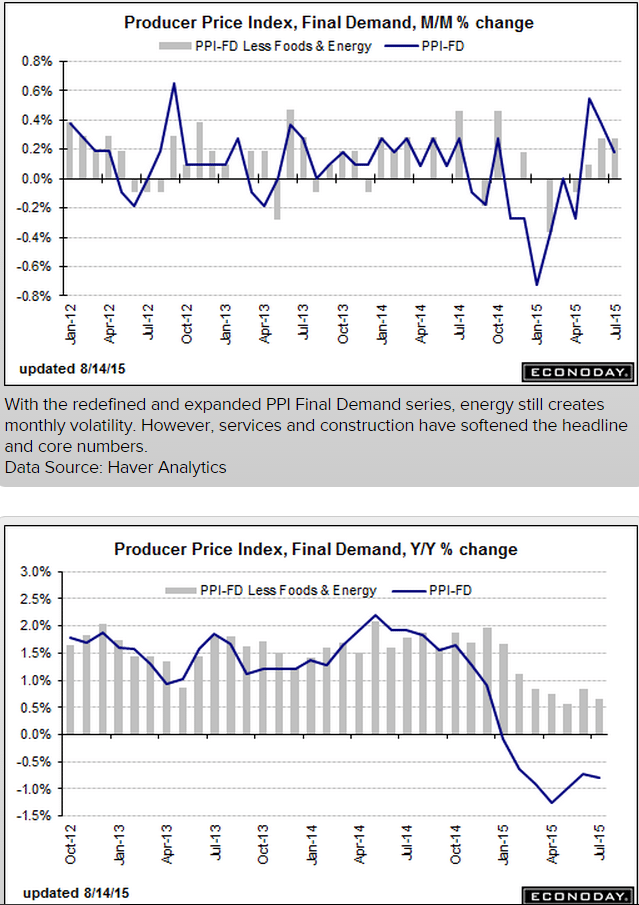
This is not a reason to hike rates, but the Fed has other reasons beginning with their mistaken belief that the current policy is ‘highly accommodative’ and potentially inflationary, etc. etc. etc. when the opposite is the actual case:

er-8-15-1

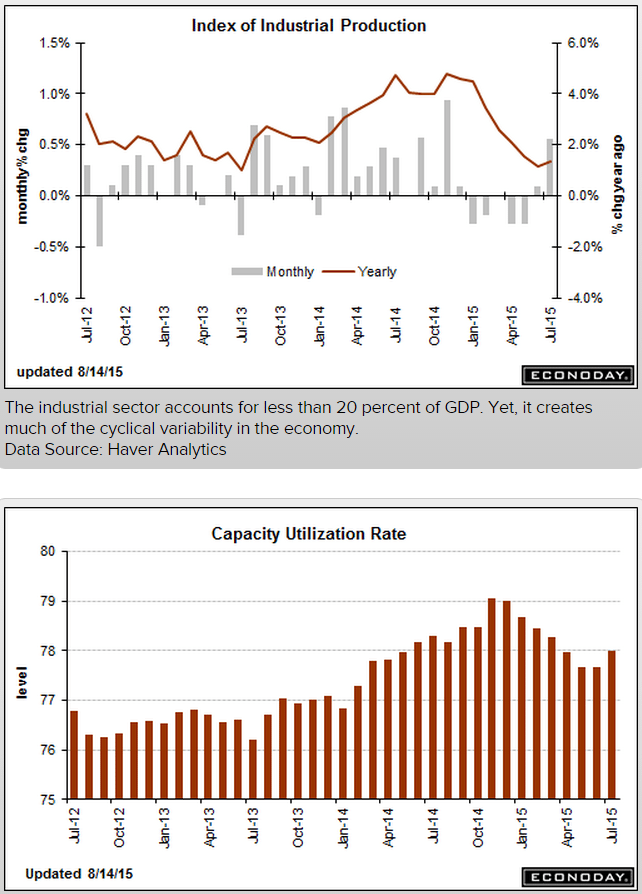
Up a bit more than expected, but all due to auto production, and yesterday’s wholesale trade report told us it all went to building (unsold) inventory, with sales of domestic cars relatively flat, so look for a reversal over the next few months. And note the reference to weak exports:

Industrial Production
er-8-15-2

Highlights
A 10.6 percent surge in motor vehicle production gave a very significant lift to industrial production which rose 0.6 percent in July. The manufacturing component, which has been flat all year, jumped 0.8 percent. Excluding vehicles, however, manufacturing rose only 0.1 percent. The lack of strength here is the result of business equipment which edged only 0.1 percent higher after declining 0.2 percent in June.

The rise in production drove capacity utilization up 3 tenths to 78.0 percent which is where it was back in April. Capacity utilization for manufacturing rose 5 tenths to 76.2 percent.

The two non-manufacturing components are mixed. Production at utilities, due to July’s cool weather, fell 1.0 percent with capacity utilization down 8 tenths to 79.1 percent, while mining production rose 0.2 percent with capacity utilization down 1 tenth to 84.4 percent.

Weak foreign demand and weakness in the energy sector may be hurting much of the industrial sector but these factors are not at play in the domestic auto industry. The readings in today’s report are mixed but the headline gain, driven by the convincing strength for autos, is an eye catcher and will certainly be ammunition for the hawks at next month’s FOMC meeting.
er-8-15-3


Weaker than expected and continuing to fade some (in line with stocks…), and note that it peaked with the fall in oil prices:

er-8-15-4

Rail Week Ending 08 August 2015: Continued Decline of One Year Rolling Average

By Steven Hansen
August 13 (Econintersect)

Econintersect: Week 31 of 2015 shows same week total rail traffic (from same week one year ago) contracted according to the Association of American Railroads (AAR) traffic data. Intermodal traffic expanded year-over-year, which accounts for approximately half of movements. and weekly railcar counts continued in contraction.

U.S. Containerized Exports Fall Off the Chart

By Wolf Richter
August 13 (Wolf Street)

“Many of our major trading partners are experiencing stalled or slowing economies, and the strength of the US Dollar versus other currencies is making US goods more expensive in the export market.” That’s how the Cass/INTTRA Ocean Freight Index report explained the phenomenon.

What happened is this: The volume of US exports shipped by container carrier in July plunged 5.8% from an already dismal level in June, and by 29% from July a year ago. The index is barely above fiasco-month March, which had been the lowest in the history of the index going back to the Financial Crisis.

The index tracks export activity in terms of the numbers of containers shipped from the US. It doesn’t include commodities such as petroleum products that are shipped by specialized carriers. It doesn’t include exports shipped by rail, truck, or pipeline to Mexico and Canada. And it doesn’t include air freight, a tiny percentage of total freight. But it’s a measure of export activity of manufactured and agricultural products shipped by container carrier.

Overall exports have been weak. But the surge in exports of petroleum products and some agricultural products have obscured the collapse in exports of manufactured goods

er-8-15-5

Retail Sales, Jobless Claims, Import Export Prices, Business Inventories, Japan Machine Orders, Freight Transportation, Gas Prices


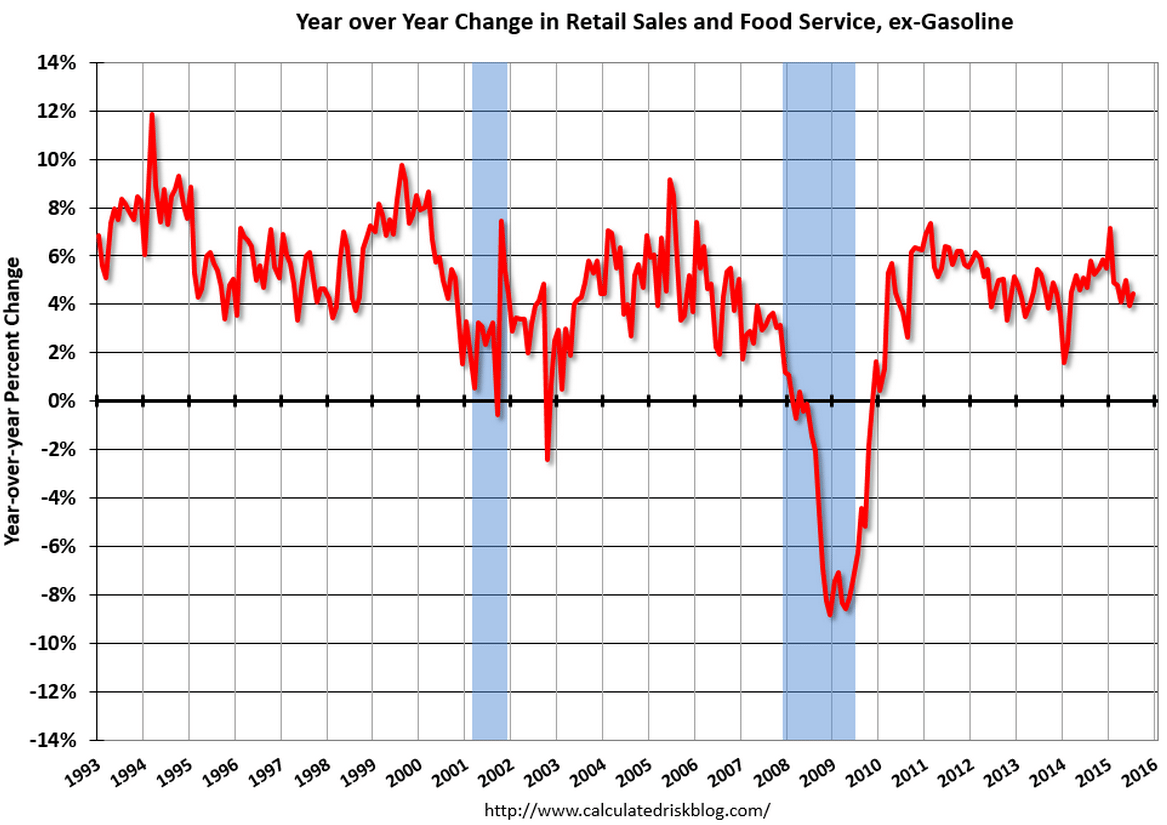
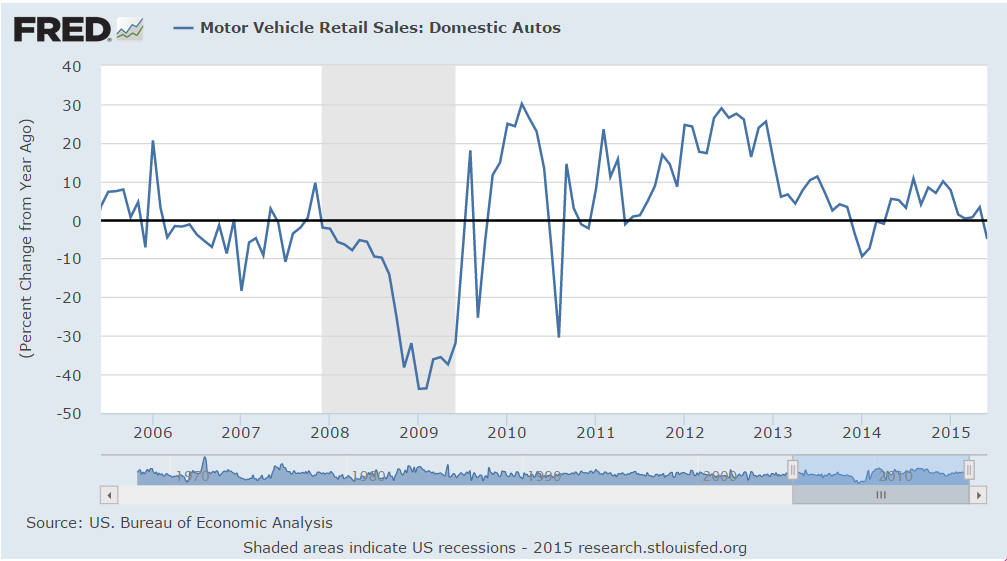
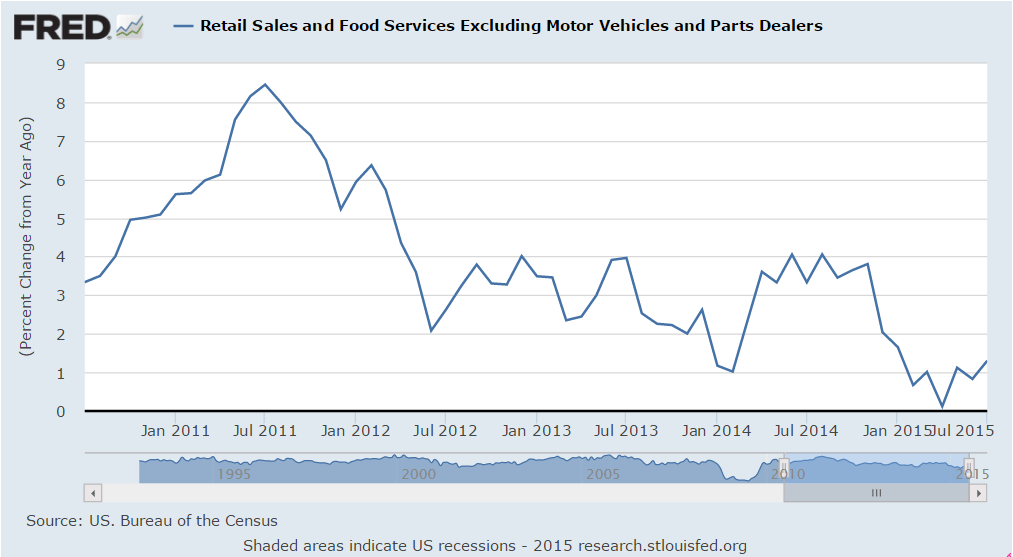
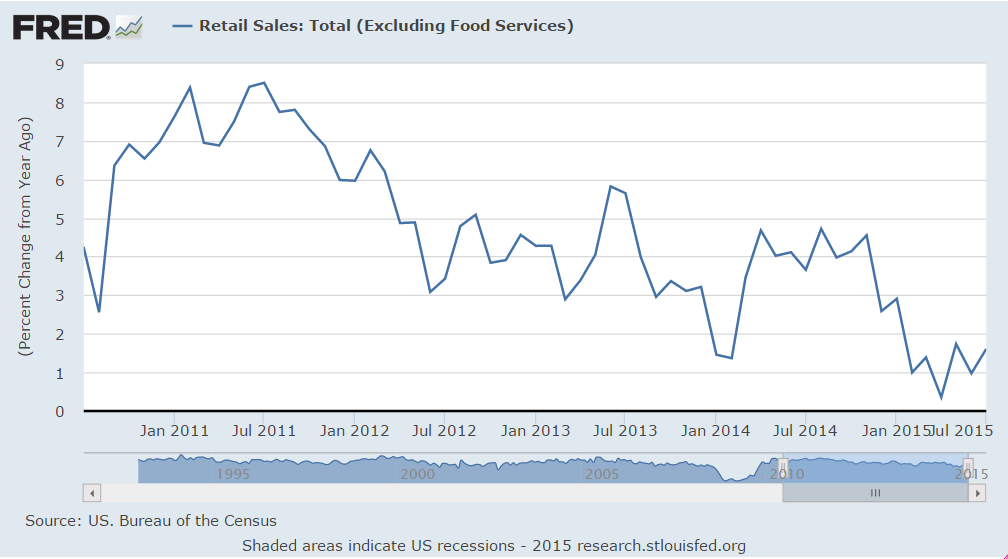
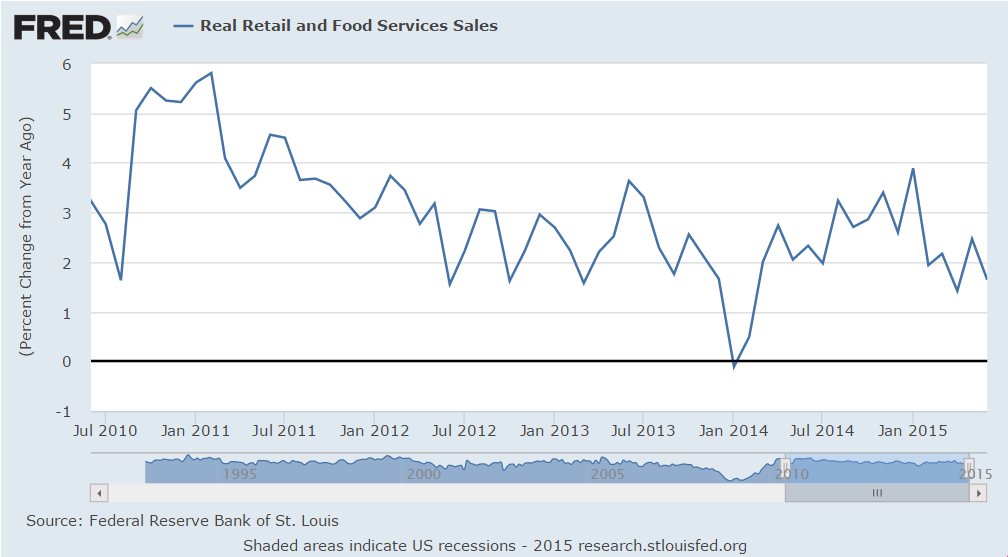
This is being touted as a strong report, but, again, looks to me like it’s dropped since year end and at best is moving sideways from there, and not to forget that a large share of auto sales are imports.

But I do agree the Fed is heck bent on raising rates in Sept, even without ‘some’ improvement, and will do so unless there’s a stock market decline severe enough to hold them back. So far that’s not happening.

Retail Sales
er-8-13-1

Highlights
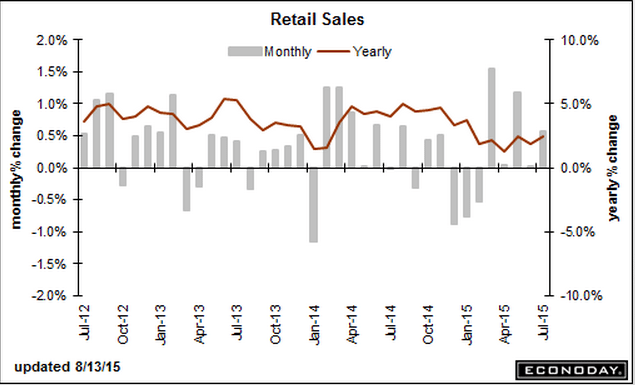
Big upward revisions underscore a very solid and very important retail sales report. Retail sales rose 0.6 percent in July with June revised to unchanged from an initial reading of minus 0.3 percent and with May revised to a jump of 1.2 percent from 1.0 percent. The revisions to June and May point to an upward revision for second-quarter GDP.

Vehicle sales, as expected, were the standout in July, jumping 1.4 percent to nearly reverse June’s 1.5 percent slide and nearly matching May’s historic 1.9 percent surge. But even outside vehicles, retail sales were strong with the ex-auto reading rising a solid 0.4 percent. Restaurants, in another strong signal of consumer strength, rose an outsized 0.7 percent following June’s 0.5 percent gain. These are very strong gains for this component. Excluding both vehicles and gasoline, retail sales rose 0.4 percent, again another solid reading.

Strength in both vehicles and restaurants point to the health of the US consumer and will likely give the hawks the courage, despite all the troubles in China, to push for a rate increase at the September FOMC.

er-8-13-4

er-8-13-5

er-8-13-6

er-8-13-7

er-8-13-8

er-8-13-9

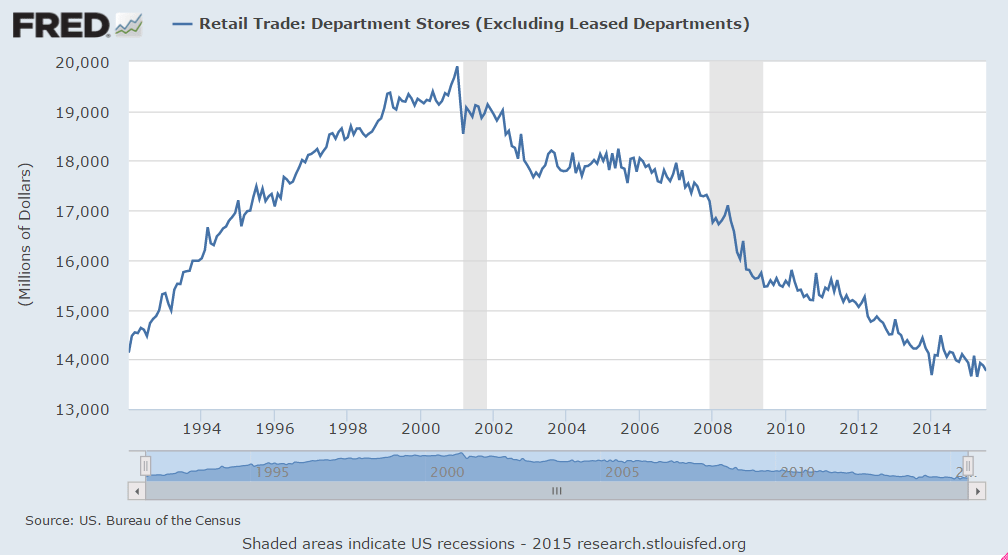
Tough times for department store sales continue, which explains some of the weakness in construction:

er-8-13-10

‘Some’ deterioration:

Jobless Claims
er-8-13-11

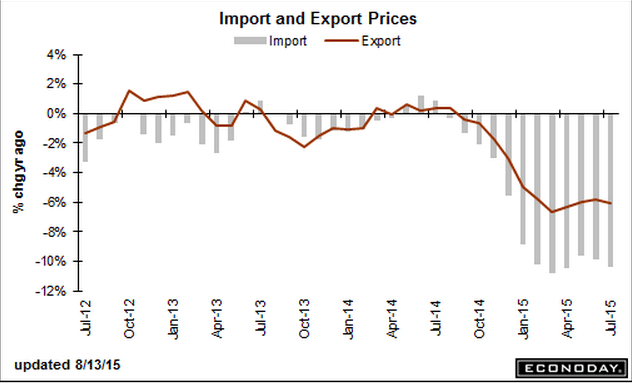
‘Some’ deterioration for Fed hopes of higher inflation. It’s been failing to hit its target for longer than I can remember…

er-8-13-12


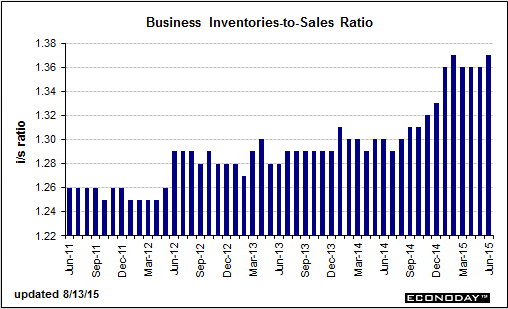
Excess inventory building in June helps Q2 GDP but the likely subsequent production cuts will hurt Q3. The now persistently too high inventory to sales ratio is overdue for a correction:

United States : Business Inventories
er-8-13-13

Highlights
Inventories rose relative to sales in June but the news isn’t that bad given that the build was centered in autos. Business inventories rose 0.8 percent in June which was well ahead of a 0.2 percent rise in sales. The mismatch lifts the inventory-to-sales ratio to 1.37 from 1.36.

But retail inventories at auto dealers were to blame, up 1.4 percent in June and contributing to a 0.7 percent rise for the retail component. Inventories at manufacturers and wholesalers, the two other components of the business inventory report, also rose, up 0.6 and 0.9 percent respectively.

Inventories are on the heavy side but the concentration in autos is welcome given how strong sales are, evidenced by the 1.4 percent surge for the motor vehicle component of the July retail sales report released earlier this morning. Note that this report, along with the retail sales report, are likely to lift revision estimates for second-quarter GDP.

er-8-13-14

Global weakness continues:

Japan : Machine Orders
er-8-13-15

Highlights
June seasonally adjusted machine orders (excluding volatile items) declined for the first time since February. They dropped a larger than anticipated 7.9 percent on the month and were up 14.7 percent on the year. Core orders were up 16.6 percent based on the original series. This was in contrast to expectations of a 17.5 percent increase.

Core machine orders are considered a proxy for private capital expenditures. The downward move followed a 0.6 percent gain a month before. The government repeated its assessment that machine orders would advance in the third quarter.

Nonmanufacturing orders excluding volatile items were up 5.0 percent while manufacturing orders dropped 14.0 percent. All orders including volatile items dropped 6.2 percent on the month. Manufacturing orders likely softened on continued weaker export demand while the sluggish domestic economy weighs on nonmanufacturers.”

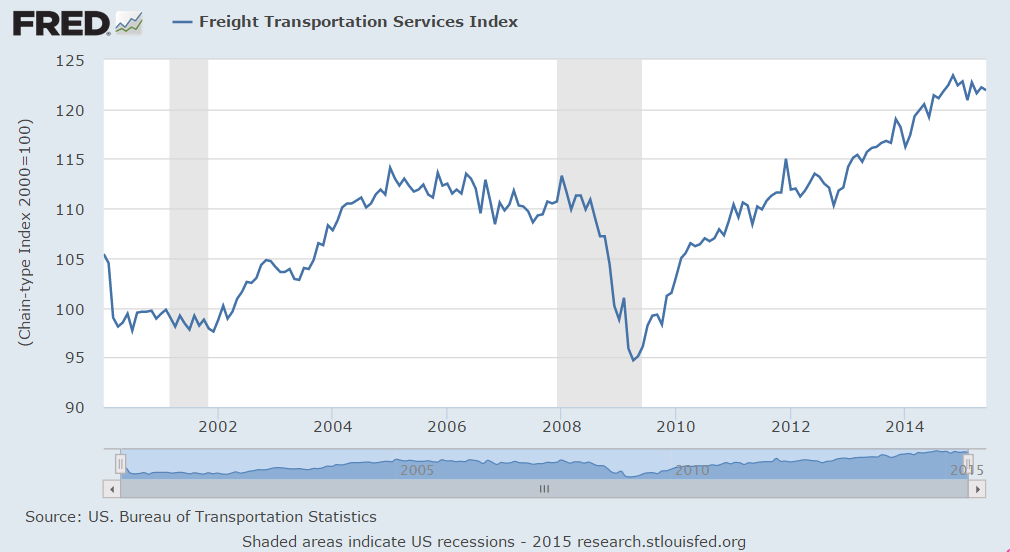
Another weak looking index:

er-8-13-16


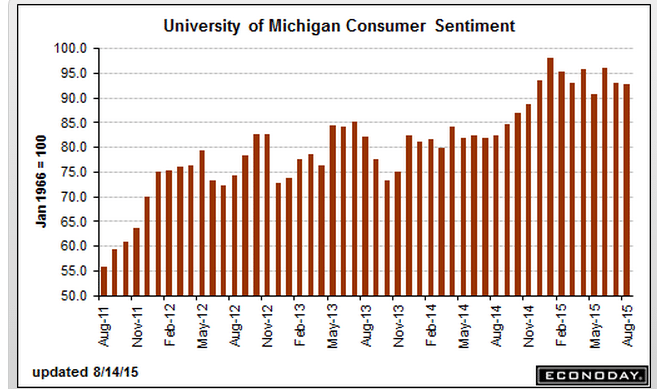
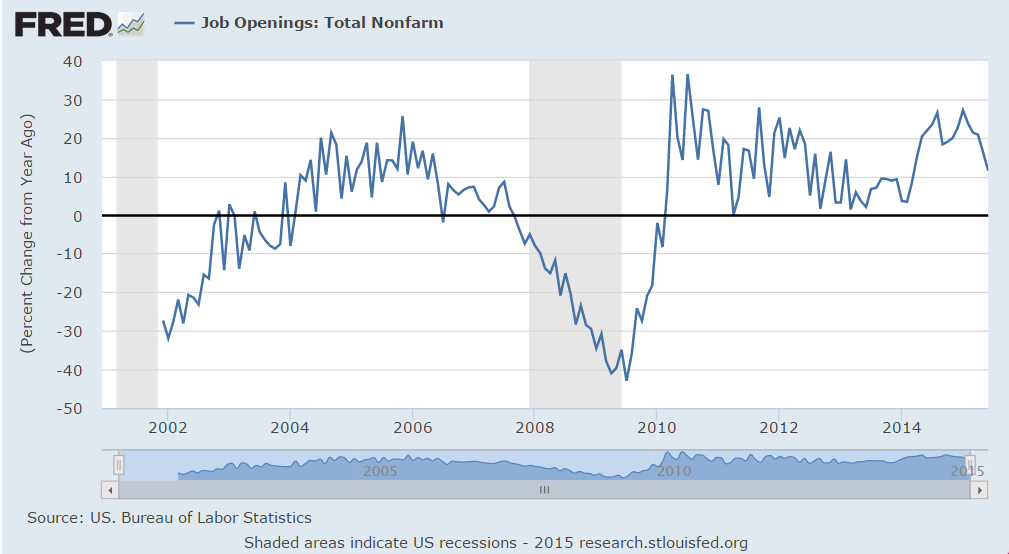
And I’d call this ‘some’ deterioration in the ‘labor market’. Looks like it was weakening before the 2014 oil capex boom supported it, and then has fallen off since the oil price collapse:

er-8-13-17


This is to the point I’ve been making that surveys are one man one vote, not one dollar one vote, so optimism remained high even as retail sales, for example, were fading. Yes, a lot more people saved $10 per week on gas but an equal amount of income was reduced for sellers of oil, including those earning royalties and holding leases, and investors of all sorts, and seems the spending cuts on domestic product by that group outweighed the additional spending from pump savings.

Fueled by low pump prices, U.S. motorists to drive more in August – survey

By Jarrett Renshaw

August 11 (Reuters)

U.S. motorists are paying an average of $2.58 per gallon, nearly a dollar less than a year ago, according to AAA, the nation’s largest motorist advocacy group. And a quarter of respondents expected prices to continue to decline, up from 10 percent a month ago.

The survey found that nearly 80 percent of people say gas prices influence how they feel about the economy. And with gas prices down nearly $1 from a year ago, U.S. motorists are feeling positive about the direction of the economy, the survey found.

“There is good news for retailers as consumer optimism picks up during peak vacation season,” said NACS Vice President of Strategic Industry Initiatives Jeff Lenard.

Jobs, Atlanta Fed, Rail Traffic

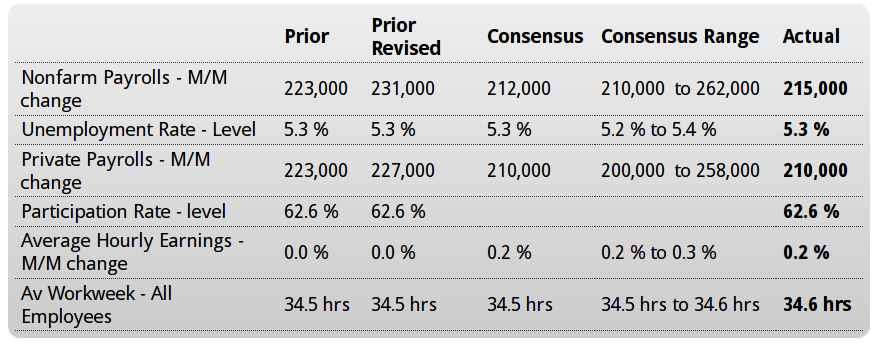
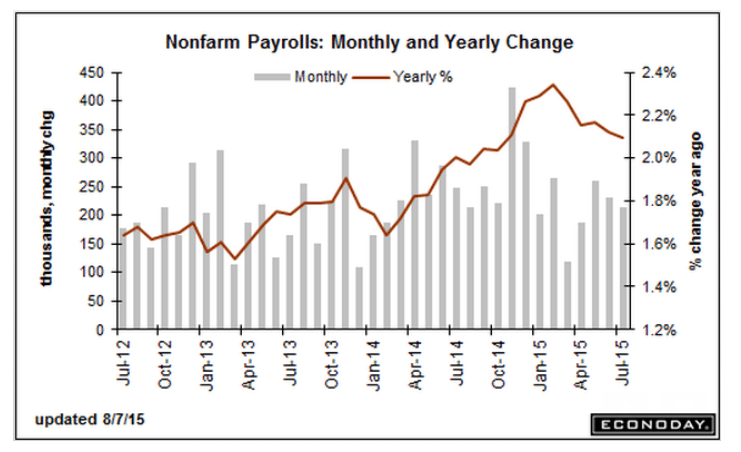
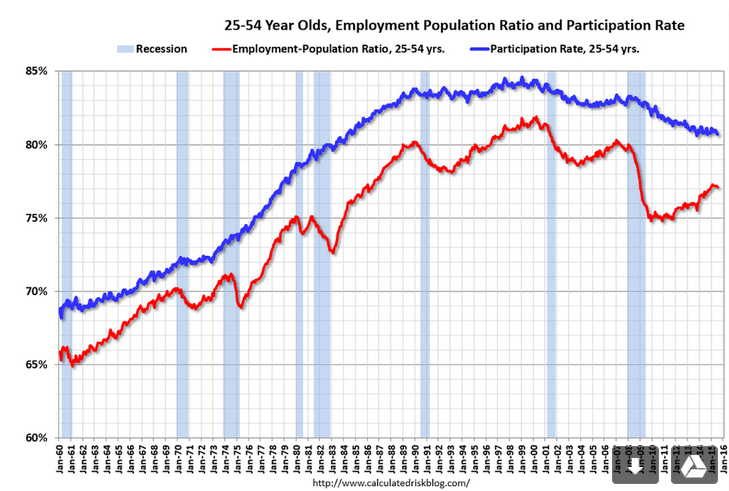
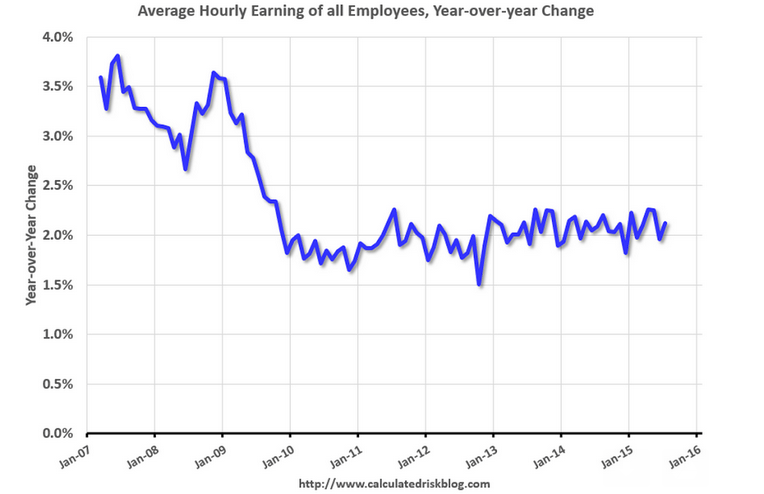
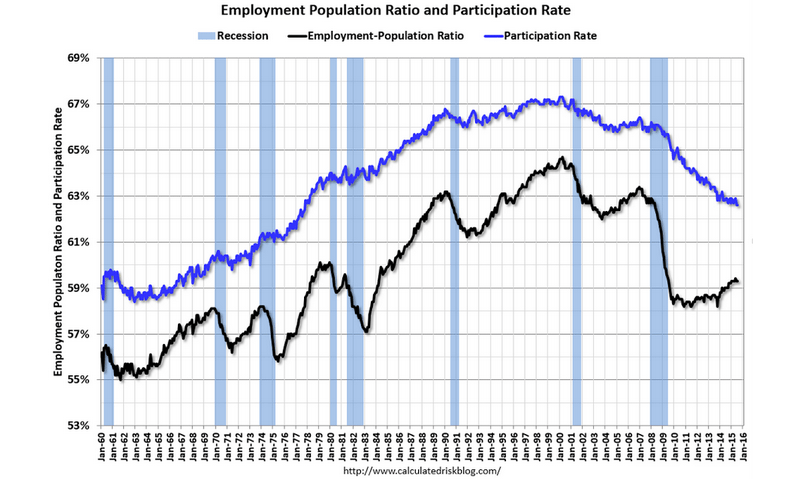
The Fed is looking for ‘some improvement’ in the jobs market. But looks like deterioration to me? The number of jobs fell for the second straight month, the year over year growth rate continued to fall, the unemployment rate and the participation rate were unchanged, earnings growth remains very low. All that went up was hours worked, by less than a tenth.

Employment Situation
er-8-8-1

Highlights
The numbers aren’t spectacular but they’re solid enough to keep a September rate hike in play. Non-farm payrolls rose just about as expected, up 215,000 in July with upward revisions adding 14,000 to the prior two months. The unemployment rate is unchanged at 5.3 percent. Wages show some traction, up 0.2 percent in the month with the year-on-year rate over 2 percent at 2.1 percent. The average workweek is up, rising to 34.6 hours from a long run at 34.5. The labor force participation rate, which dropped sharply in June, held at 62.6 percent.

Other details look surprisingly solid with payrolls rising 60,000 in trade & transportation, for a third straight strong gain, and professional & business services rising 40,000 to extend their long healthy run. Retailers continue to add jobs, up 36,000 for their third straight strong gain with the motor vehicle subset up 13,000 and reflecting the strength of car sales. Manufacturing, which is usually weak, rose a notable 15,000 in the month with construction, where lack of skilled labor is being reported, showing a modest gain of 6,000.

Another plus in the report is a decline in Janet Yellen’s favorite reading, the broadly defined U-6 unemployment rate which is down a notch to 10.4 percent. If the August employment report a month from now looks this good, a rate hike at the September FOMC will be a lock.

Improvement? Looks more like deterioration?

er-8-8-2

er-8-8-3

er-8-8-4

er-8-8-5

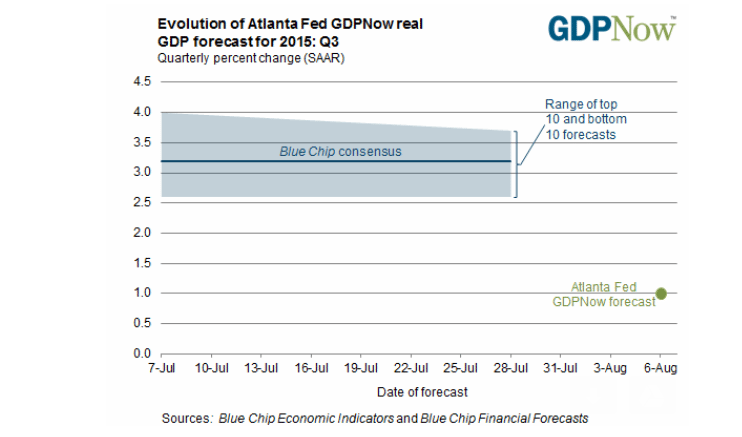
Slow start to Q3 here:

Latest forecast

August 6 (GDPNow)

The first GDPNow model forecast for real GDP growth (seasonally adjusted annual rate) in the third quarter of 2015 was 1.0 percent on August 6. The model projects that lower inventory investment will subtract 1.7 percentage points from third quarter real GDP growth. Real GDP grew 2.3 percent in the second quarter according to the advance estimate from the U.S. Bureau of Economic Analysis.
er-8-8-6

Rail Week Ending 01 August 2015: Traffic Down 1.8% in July

By Steven Hansen

August 7 (Econointersect)

Econintersect: Week 30 of 2015 shows same week total rail traffic (from same week one year ago) contracted according to the Association of American Railroads (AAR) traffic data. Intermodal traffic contracted year-over-year, which accounts for approximately half of movements. and weekly railcar counts continued in contraction.

PMI Manufacturing Index, New Home Sales, Redfin Real Estate Report, Rail Traffic

source: Econoday.com
er-7-24-1

Highlights

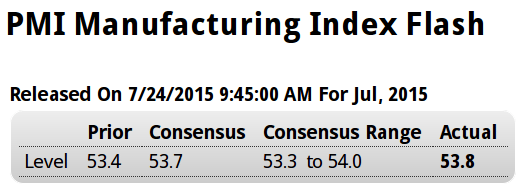
The manufacturing PMI is holding steady, coming in at a composite 53.8 in the July flash and right in line with the 54.0 final reading for June and June’s 53.4 flash. Though respectable, these are soft rates of growth for this report which runs hot relative to other manufacturing data and where the long-run average is 54.3.

New orders and production are both accelerating this month though hiring is holding down the composite. The report cites reduced capital spending in the energy sector as a negative for the sample, and it says some firms are focusing their efforts on domestic markets given weakness in export markets.

Other details include a fall-off in input buying due in part to excess inventories. Price readings remain subdued.

This report is pointing to little change for the manufacturing sector this month, a sector that has been struggling this year and looks to continue to struggle through the second half.

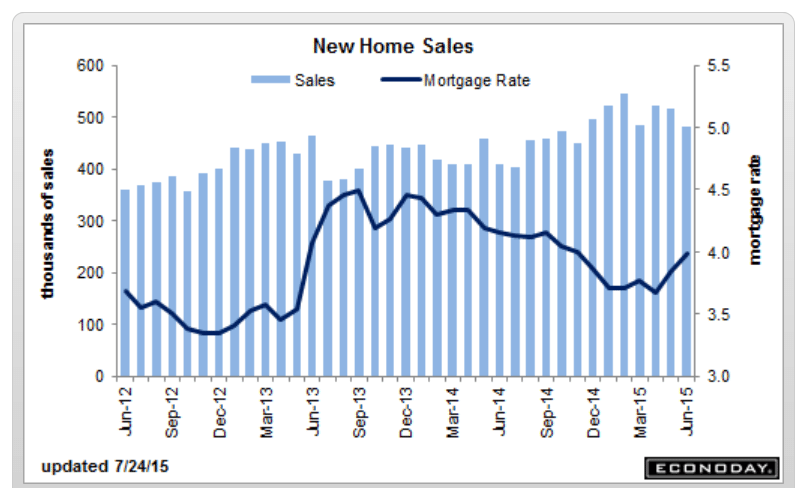
Not good. This is what happens in a recession. And in a slowdown greater supply indicates excess inventory:

er-7-24-2

Highlights

Volatility is common for new home sales and there’s plenty of it the June report where the headline plunged 6.8 percent to a far lower-than-expected annual rate of 482,000 and where revisions erased 40,000 from the prior two months.

But there is some good news in the report and that’s a surge in supply of new homes on the market, up 3.4 percent in the month to 215,000. Greater supply points to greater sales ahead. On a sales basis, supply is at 5.4 months vs 4.8 and 4.7 in June and May.

Prices look soft in the report, at a median $281,800 which is up 0.5 percent in the month but down 1.8 percent year-on-year. The latter reading points to deep discounting compared to the year-on-year sales gain of 18.1 percent.

Regional data show big drops in the West and the Midwest in the month and a smaller drop in the South. But the Northeast is showing life with a second straight solid gain. Year-on-year, the South and Northeast lead with respective sales gains of 23.7 and 23.1 percent with the West and Midwest lagging at 10.9 and 5.7 percent.

The sales data in today’s report, with the June rate the lowest of the year, are likely to shave second-quarter GDP slightly and take some of the shine off the housing outlook.

er-7-24-3

From Redfin:

source: CNBC.com

Sales of existing U.S. homes rose to the highest level in eight years, according to the National Association of Realtors, but that may be the peak for the year. One real estate brokerage claims consumer demand for housing took a sharp turn for the worse in June, as potential buyers balked at higher home prices.

“People look at houses and don’t pull the trigger,” said Glenn Kelman, CEO of brokerage Redfin, which released a new demand index on Thursday. “We know that the number of people writing offers has been declining for 4½ weeks, and based on that data we make a forecast.”

The new demand index tracks millions of visits to Redfin’s listing pages, as well as customer requests for home tours, customer offer requests on homes and various pricing data; in June it showed demand up 13 percent from a year ago but down 7 percent from May. That was the largest monthly decline since December of 2014.

source: Econointersect.com

Rail Week Ending 18 July 2015: Rail Data Continues to be Soft
Econintersect: Week 28 of 2015 shows same week total rail traffic (from same week one year ago) contracted according to the Association of American Railroads (AAR) traffic data. Intermodal traffic expanded year-over-year, which accounts for approximately half of movements – but weekly railcar counts continued in contraction.