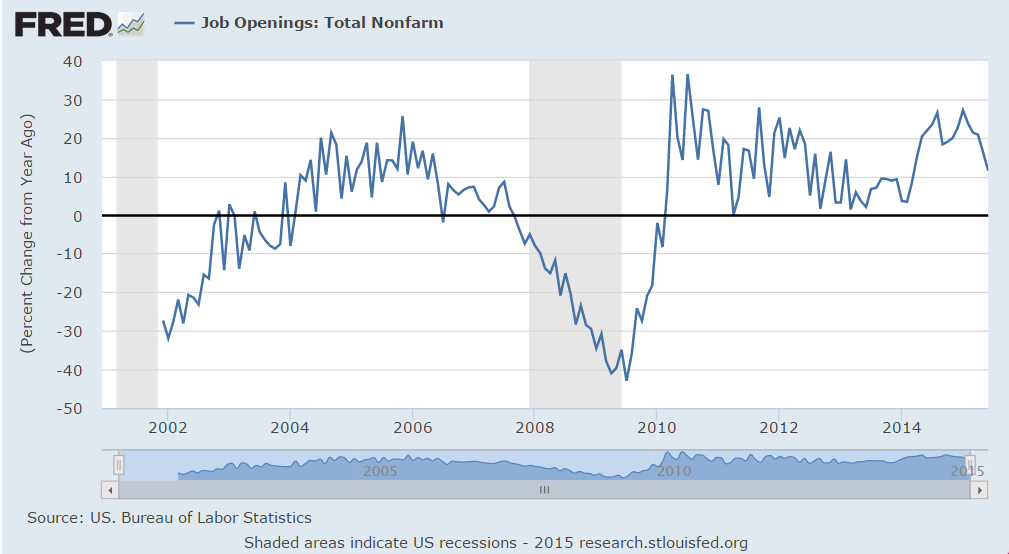
This is not a reason to hike rates, but the Fed has other reasons beginning with their mistaken belief that the current policy is ‘highly accommodative’ and potentially inflationary, etc. etc. etc. when the opposite is the actual case:
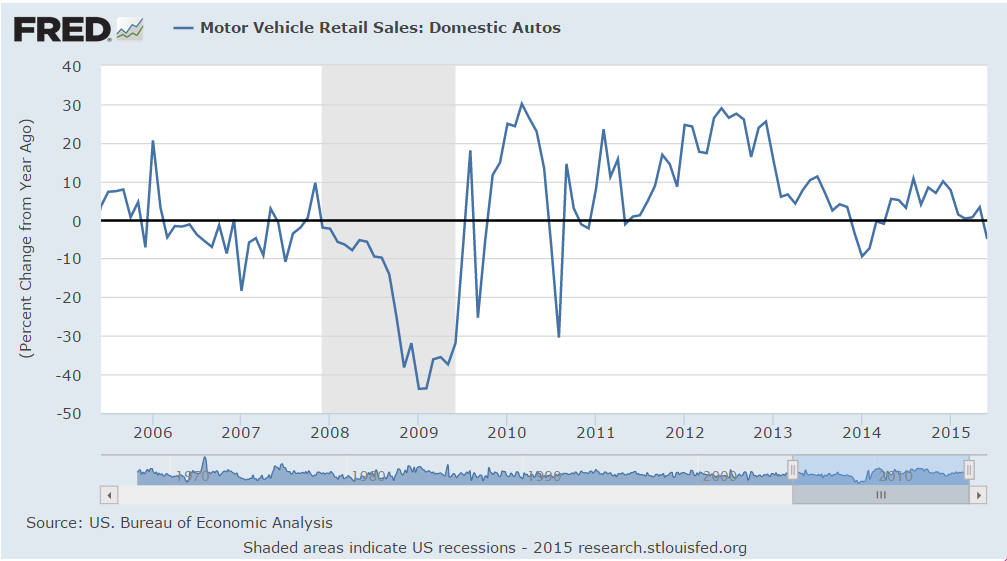
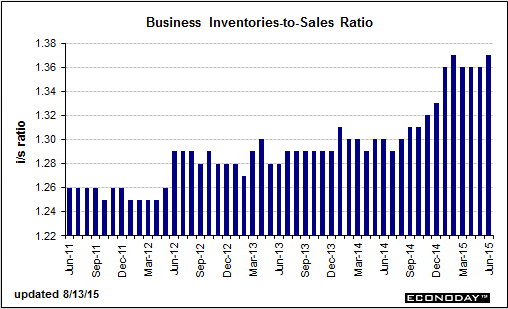
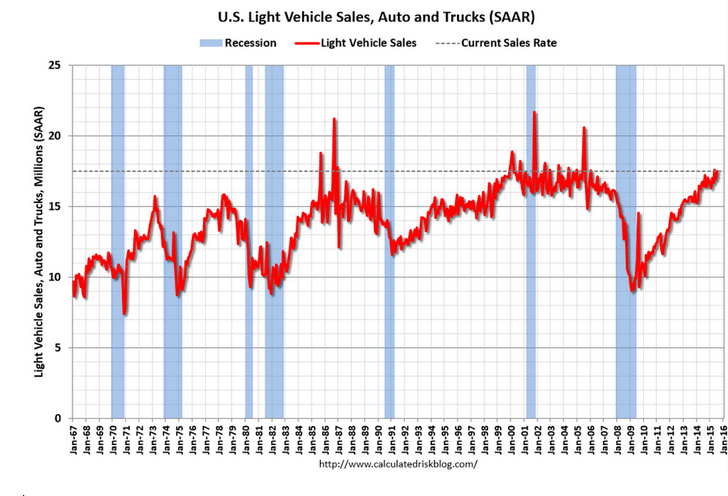
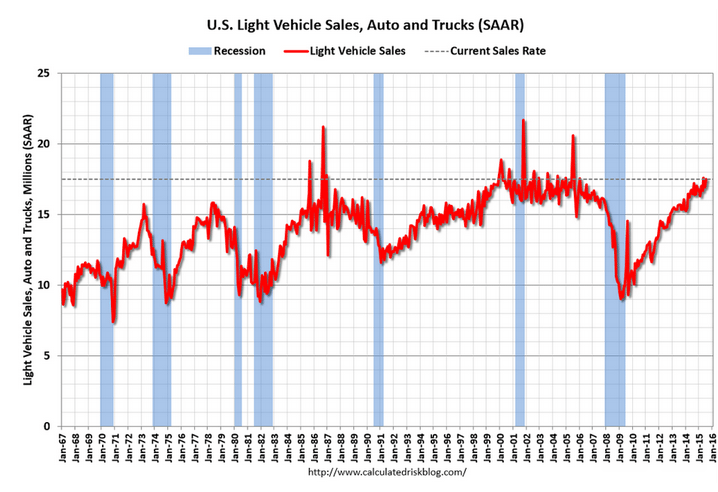
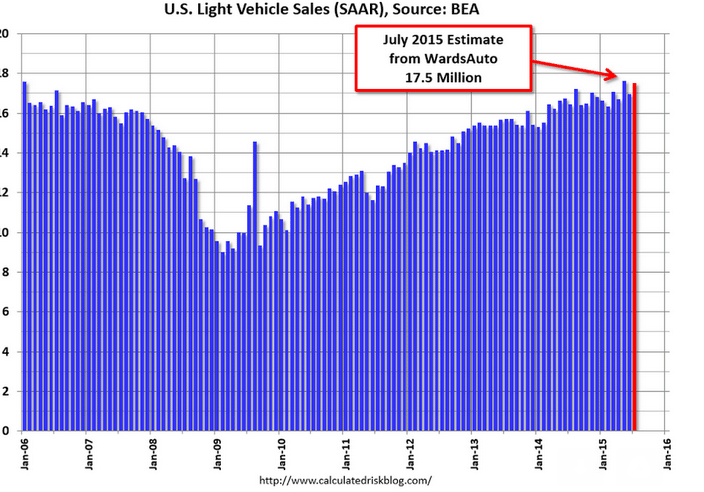
Up a bit more than expected, but all due to auto production, and yesterday’s wholesale trade report told us it all went to building (unsold) inventory, with sales of domestic cars relatively flat, so look for a reversal over the next few months. And note the reference to weak exports:
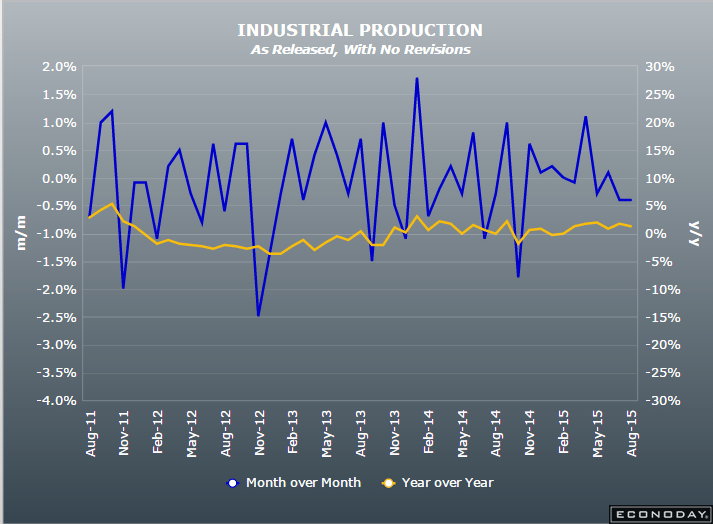
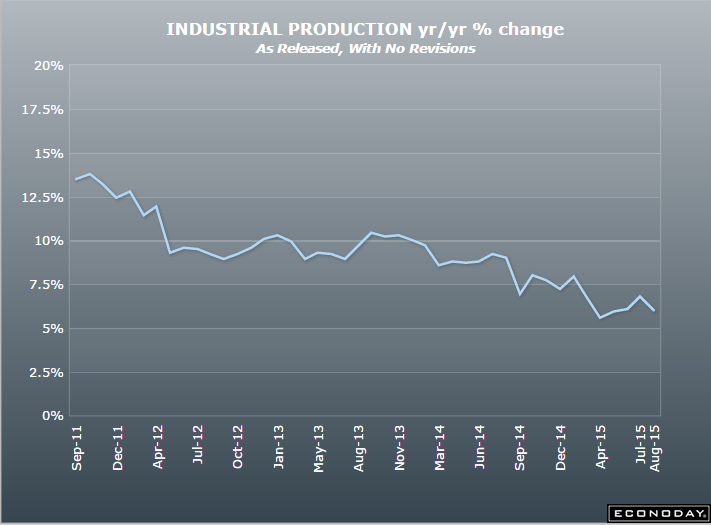
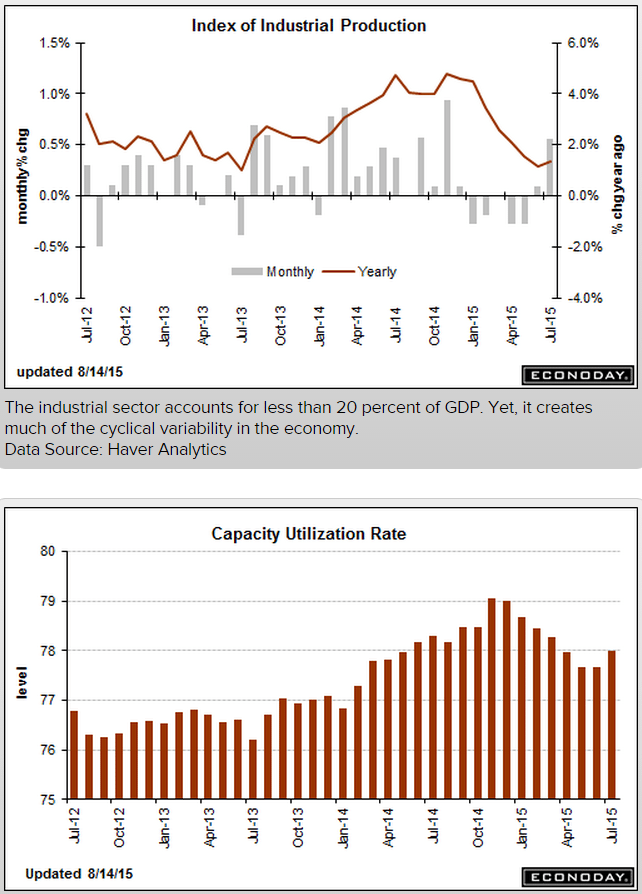
Industrial Production
Highlights
A 10.6 percent surge in motor vehicle production gave a very significant lift to industrial production which rose 0.6 percent in July. The manufacturing component, which has been flat all year, jumped 0.8 percent. Excluding vehicles, however, manufacturing rose only 0.1 percent. The lack of strength here is the result of business equipment which edged only 0.1 percent higher after declining 0.2 percent in June.
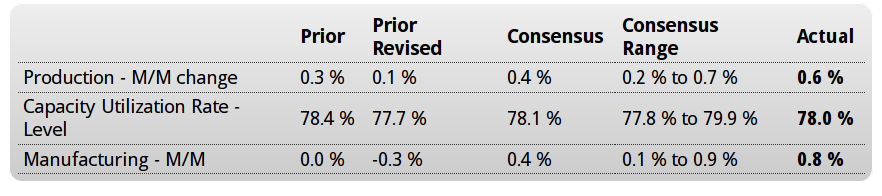
The rise in production drove capacity utilization up 3 tenths to 78.0 percent which is where it was back in April. Capacity utilization for manufacturing rose 5 tenths to 76.2 percent.
The two non-manufacturing components are mixed. Production at utilities, due to July’s cool weather, fell 1.0 percent with capacity utilization down 8 tenths to 79.1 percent, while mining production rose 0.2 percent with capacity utilization down 1 tenth to 84.4 percent.
Weak foreign demand and weakness in the energy sector may be hurting much of the industrial sector but these factors are not at play in the domestic auto industry. The readings in today’s report are mixed but the headline gain, driven by the convincing strength for autos, is an eye catcher and will certainly be ammunition for the hawks at next month’s FOMC meeting.
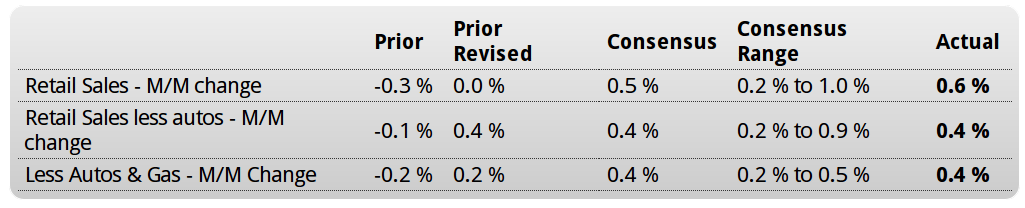
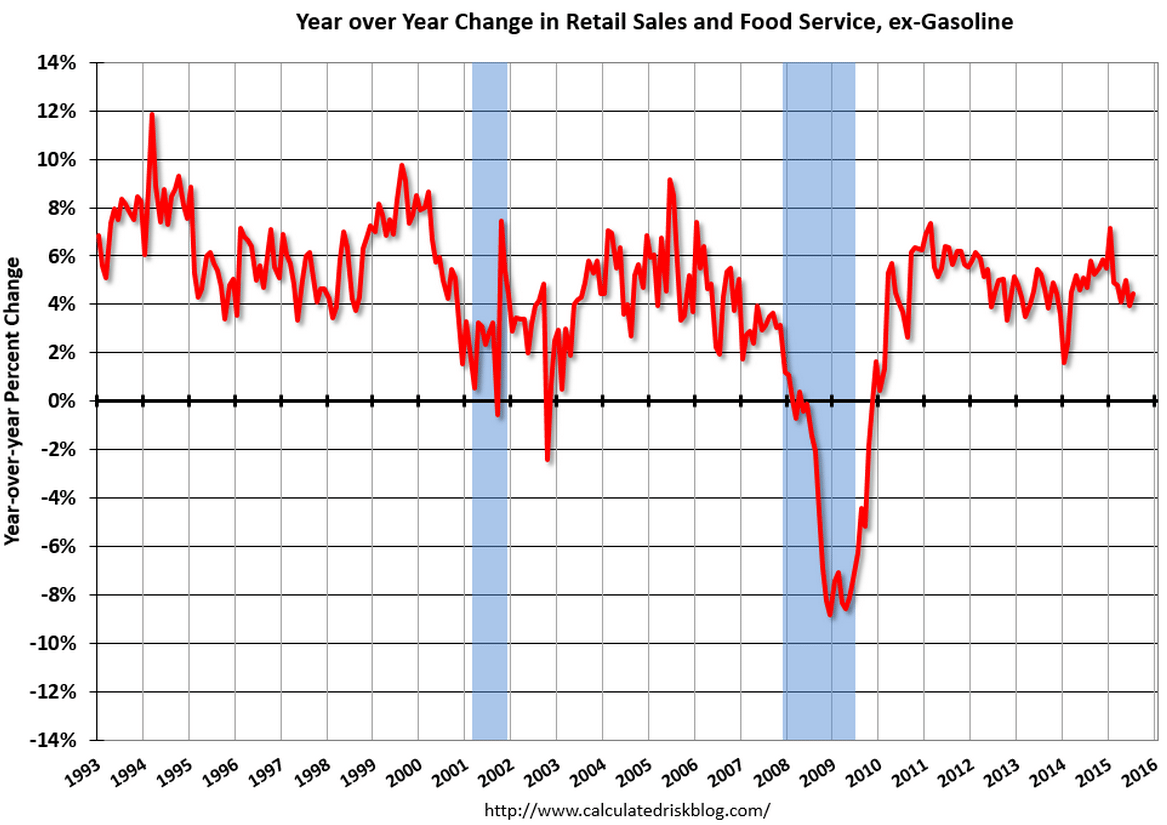
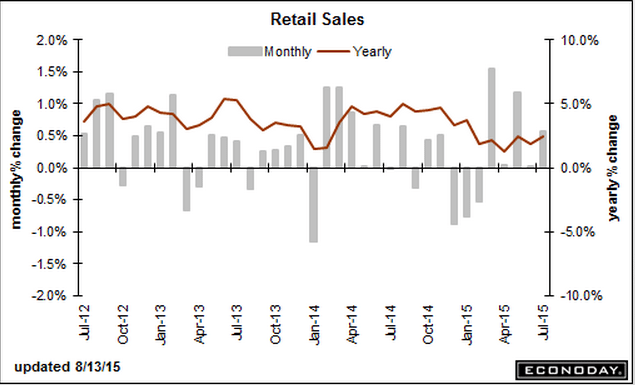
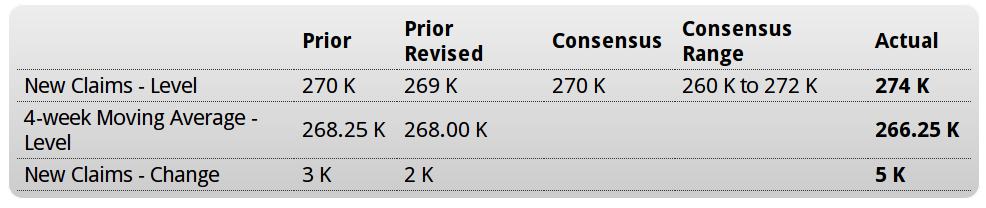
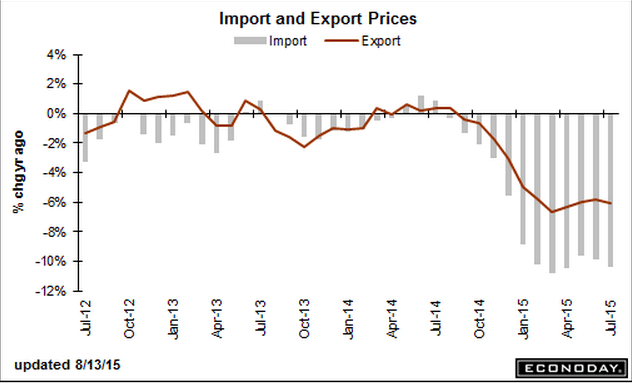
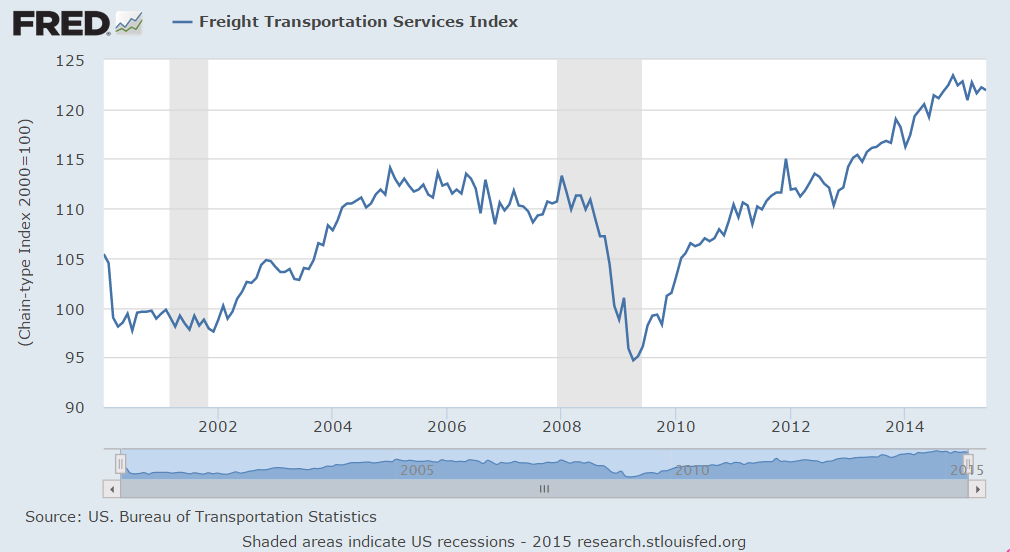
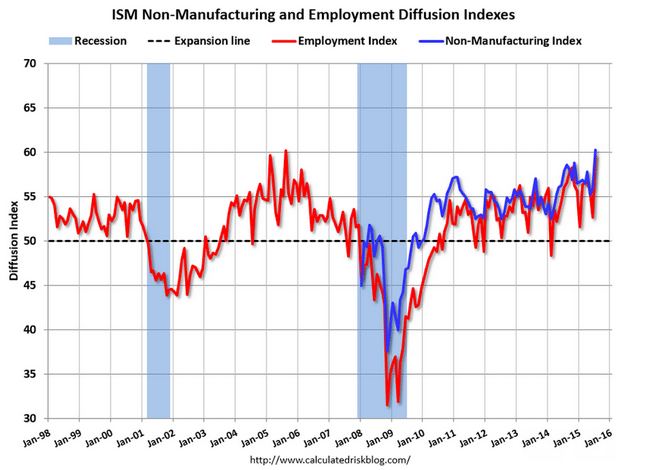
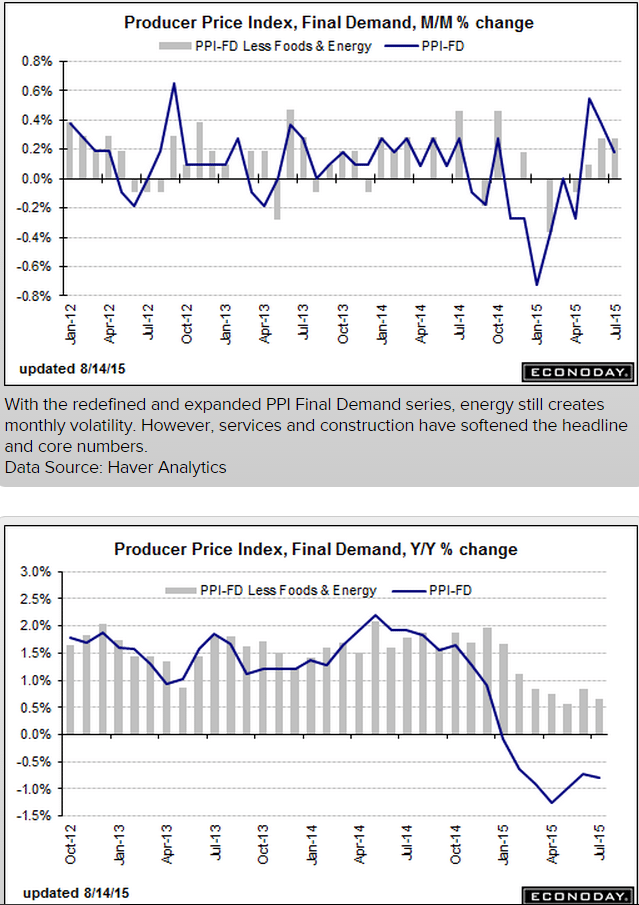
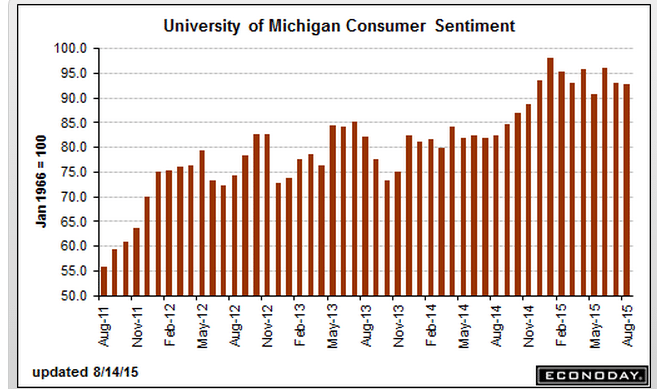
Weaker than expected and continuing to fade some (in line with stocks…), and note that it peaked with the fall in oil prices:
Rail Week Ending 08 August 2015: Continued Decline of One Year Rolling Average
By Steven Hansen
August 13 (Econintersect)
Econintersect: Week 31 of 2015 shows same week total rail traffic (from same week one year ago) contracted according to the Association of American Railroads (AAR) traffic data. Intermodal traffic expanded year-over-year, which accounts for approximately half of movements. and weekly railcar counts continued in contraction.
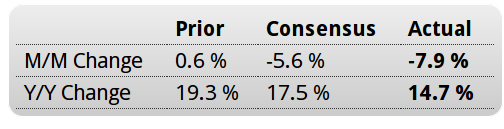
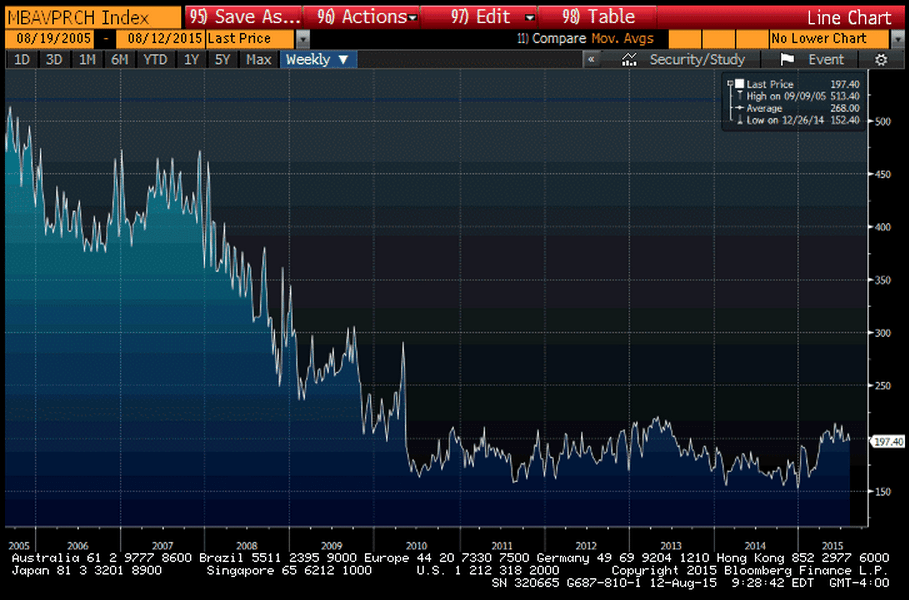
U.S. Containerized Exports Fall Off the Chart
By Wolf Richter
August 13 (Wolf Street)
“Many of our major trading partners are experiencing stalled or slowing economies, and the strength of the US Dollar versus other currencies is making US goods more expensive in the export market.” That’s how the Cass/INTTRA Ocean Freight Index report explained the phenomenon.
What happened is this: The volume of US exports shipped by container carrier in July plunged 5.8% from an already dismal level in June, and by 29% from July a year ago. The index is barely above fiasco-month March, which had been the lowest in the history of the index going back to the Financial Crisis.
The index tracks export activity in terms of the numbers of containers shipped from the US. It doesn’t include commodities such as petroleum products that are shipped by specialized carriers. It doesn’t include exports shipped by rail, truck, or pipeline to Mexico and Canada. And it doesn’t include air freight, a tiny percentage of total freight. But it’s a measure of export activity of manufactured and agricultural products shipped by container carrier.
Overall exports have been weak. But the surge in exports of petroleum products and some agricultural products have obscured the collapse in exports of manufactured goods