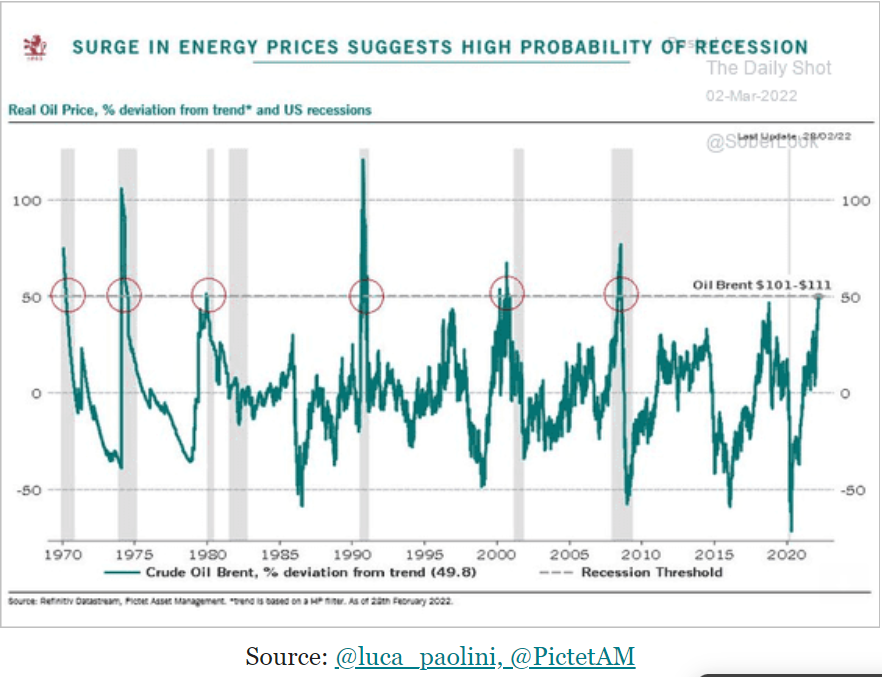
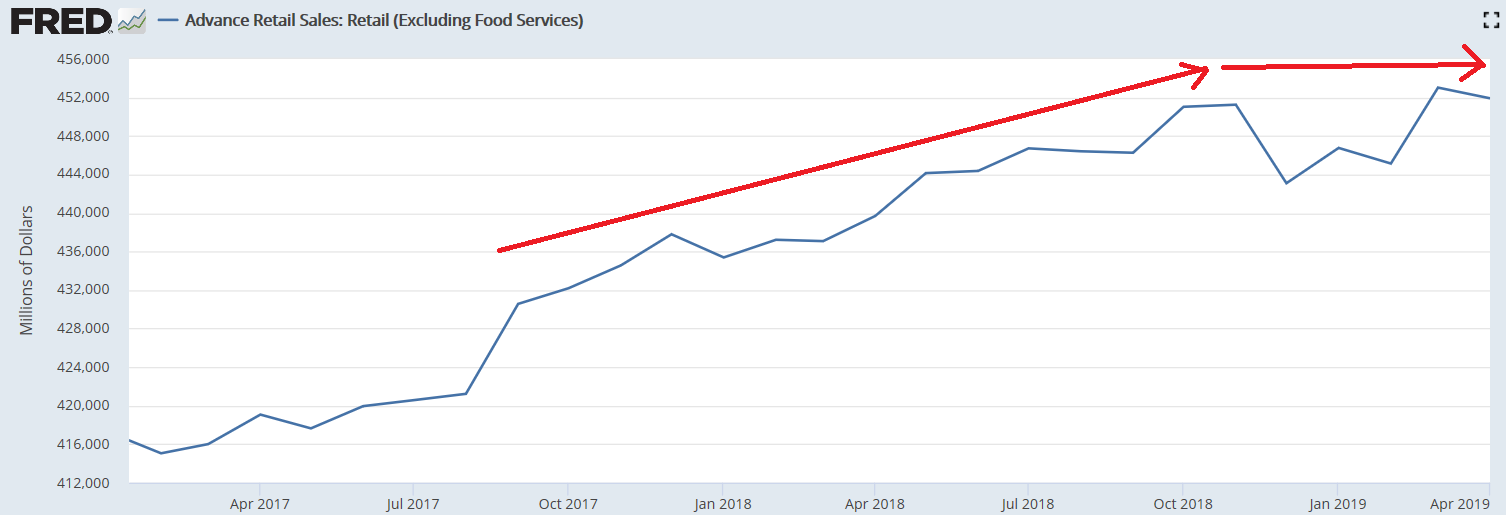
Low and slipping:
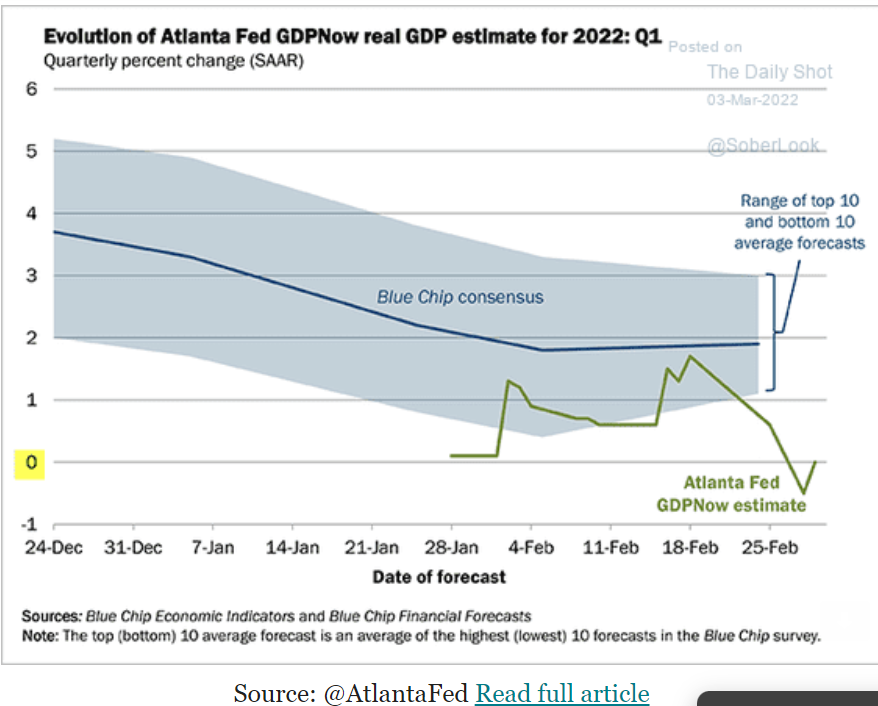
GDP tracking at 0:

Weak and weaker than expected:
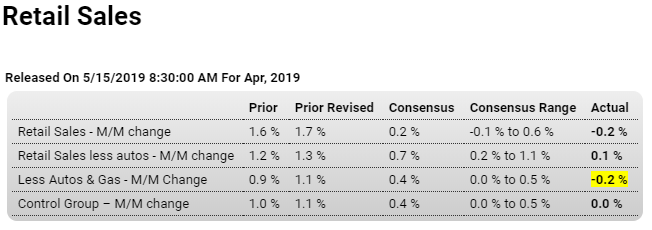
Highlights
The second quarter gets off to a stumbling start pulled down by a 0.2 percent headline decline in an April retail sales report where the core details show unexpected weakness. Excluding autos, in which sales were already expected to fall sharply, April sales managed only a 0.1 percent gain to fall underneath Econoday’s consensus range. Excluding autos and also gasoline sales, which were already expected to rise sharply, sales fell 0.2 percent in April to also fall below the consensus range. Just making the consensus range is a no change result for the control group, a component used in the calculation of GDP and pointing squarely to early second-quarter deceleration in consumer spending which had already decelerated sharply in the first quarter.
A 1.1 percent decline in auto sales (signaled by the prior release of unit sales at manufacturers) is no surprise and neither is a 1.8 percent jump at gasoline stations, signaled here by the price of gas. The big surprise is a 1.3 percent drop at electronics & appliance stores that follows a 4.3 percent tumble in March. Weakness here hints at lower prices for consumer electronics and also lower spending on home improvements. Furniture sales also hint at trouble for residential investment, coming in unchanged following March’s 3.1 percent decline, as do sales of building materials which fell 1.9 percent in April following, however, a 1.2 percent rise in March.
The best news in the report comes from its weakest sub-component, department stores where April sales jumped 0.7 percent. This was enough, however, to give only a small 0.2 percent lift to the overall general merchandise component. Another positive is restaurants where sales rose 0.2 percent on top of a great monthly surge of 5.7 percent in March.
Another negative surprise:
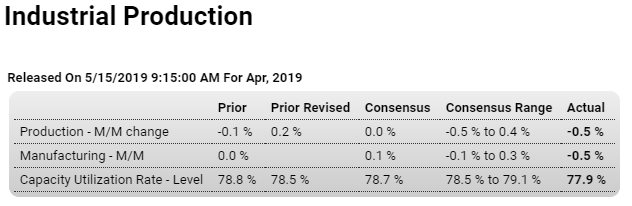
Highlights
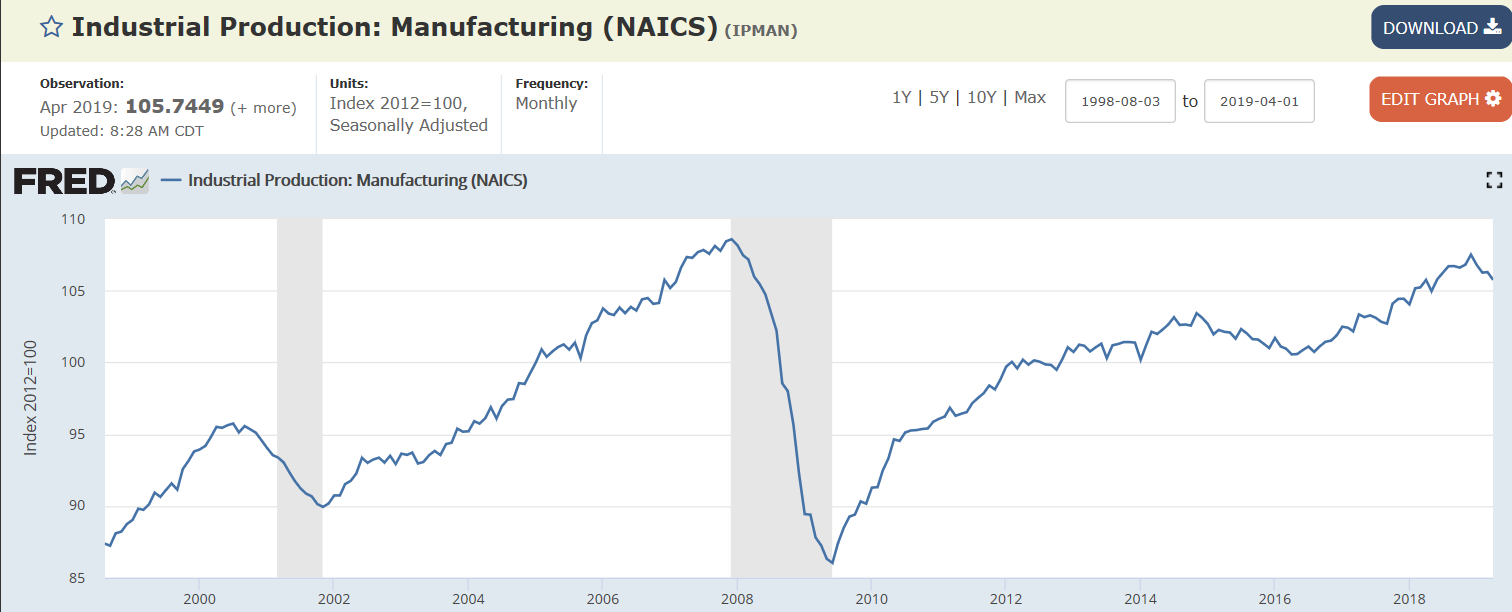
Like retail sales earlier this morning, the headline 0.5 percent decline for April industrial production is not masking strength underneath. Also falling 0.5 percent was production at manufacturers which is even more unexpected than the headline decline.
Motor vehicles and parts, where consumer sales have been mostly soft this year, fell 2.6 percent in April for a second monthly decline and year-over-year contraction of 4.4 percent. Business equipment fell 2.1 percent in the month for yearly growth of only 0.1 percent which doesn’t point to acceleration for business investment. Consumer goods also fell, down 1.2 percent in the month with construction supplies up only 0.1 percent that follows March’s 1.7 percent dip in readings that don’t point to strength for construction in general. Selected hi tech is a positive for April, up 0.6 percent with annual growth here at 3.2 percent.
Also positive is a 1.6 percent jump in mining volumes which rose 1.6 percent in April that follows, however, three straight months of declines. Output at utilities fell 3.5 percent in April with the yearly rate of minus 4.7 percent also pointing to general industrial weakness.
However tight the US labor market may be, capacity does not appear to be tight in the industrial sector as capacity utilization fell 6 tenths in April to a much lower-than-expected 77.9 percent. Utilization in the manufacturing sector is down 5 tenths to 75.7 percent.
This report doesn’t breakdown production of goods aimed for the domestic market and those for the foreign market but it will nevertheless offer a baseline for the overall effects of increased US-China tariffs. Going into those tariffs, the manufacturing sector, which first began to slow late last year, appeared to be flat at best.
Rolling over:
Corporate Japan logs first profit dip in 3 years as China slows
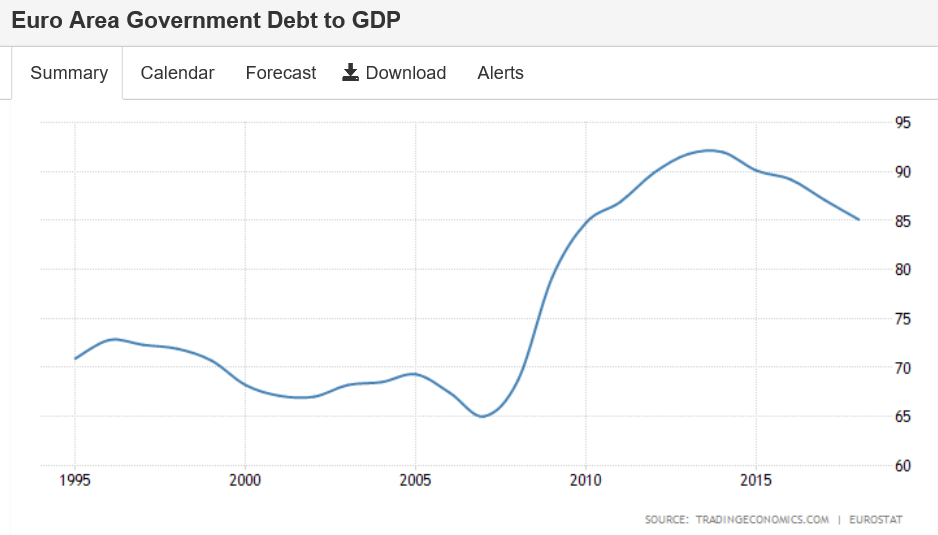
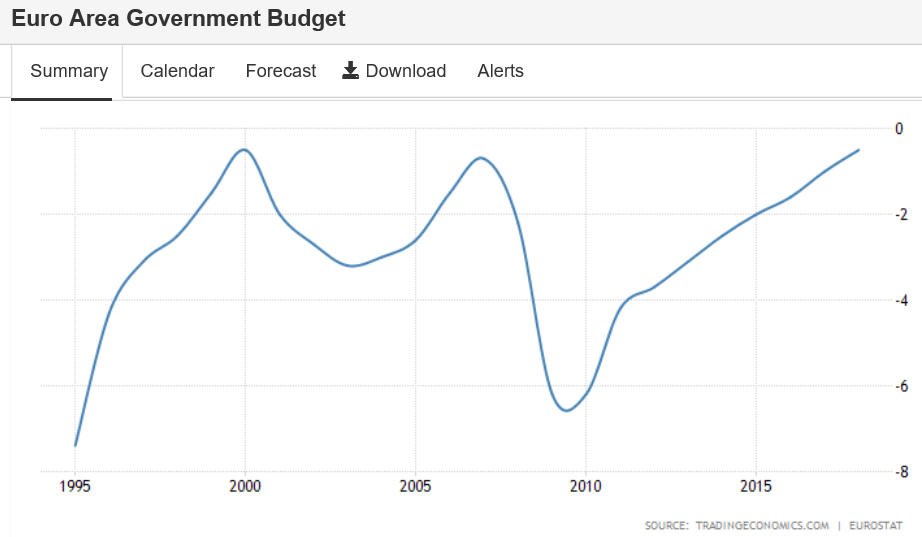
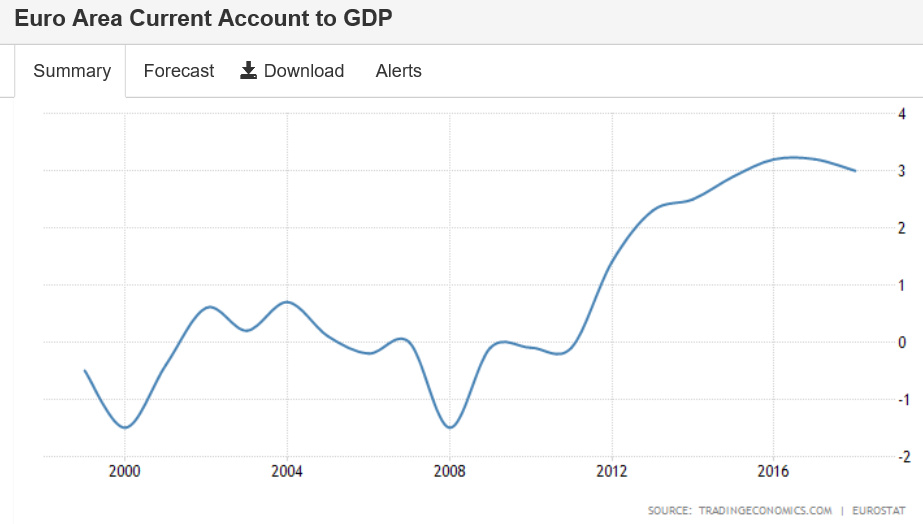
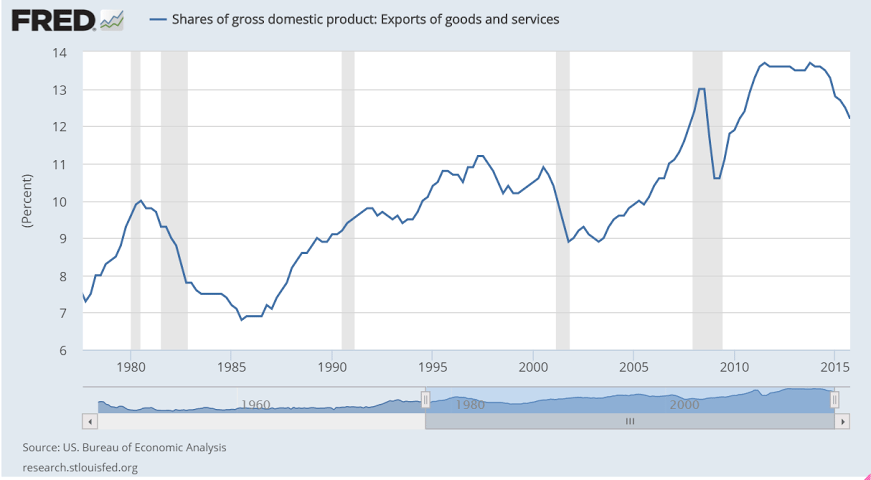
Fiscal has tightened in the euro area, and now with the global trade collapse prospects are looking grim:
Euro Area recorded a Government Budget deficit equal to 0.50 percent of the country’s Gross Domestic Product in 2018. Government Budget in the Euro Area averaged -2.84 percent of GDP from 1995 until 2018, reaching an all time high of -0.50 percent of GDP in 2000 and a record low of -7.40 percent of GDP in 1995.
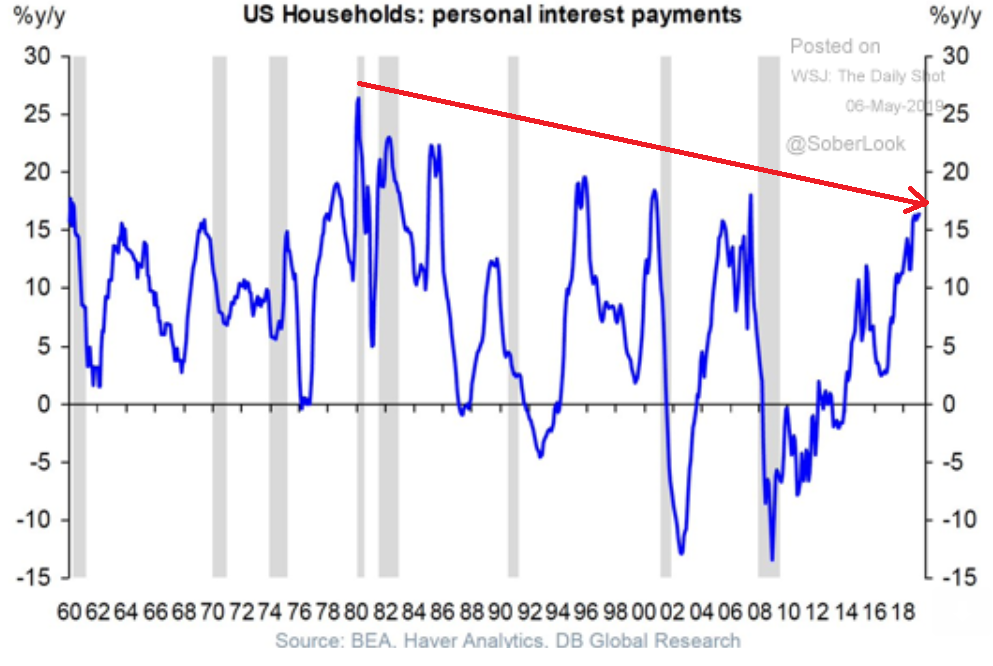
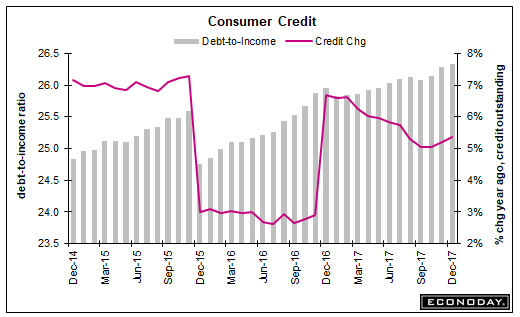
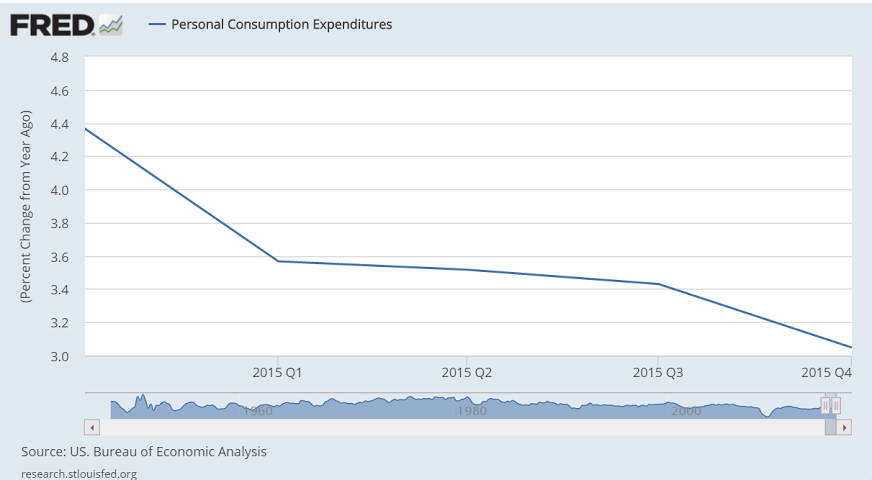
It’s been decelerating all year with a year end move up that’s likely to be reversed as personal income growth continues to be very low:
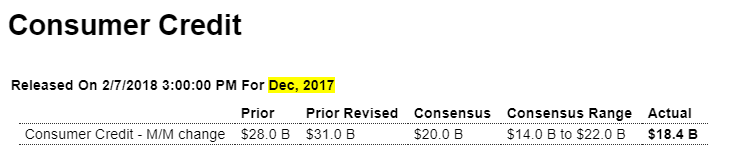
Highlights
Consumer borrowing increased in December, up $18.4 billion vs an upwardly revised $31.0 billion in November which is the largest monthly increase since a break in the series 7 years ago. Revolving credit, a component that tracks credit-card debt, rose a sizable $5.1 billion following a November spike of $11.0 billion. On an annualized basis, revolving credit rose at a 6.0 percent pace in December.
Non-revolving credit rose at a 5.7 percent pace in the month and in month-to-month dollar terms rose $13.3 billion. Gains in this component, which is nearly triple the size of the revolving component, were split between student loans and especially vehicle financing.
The gain for revolving credit does suggest that those shoppers who are cash strapped turned to their credit cards to do their share to fund the holiday shopping season.
To my point about a general ‘mania’ that seems to be fading:
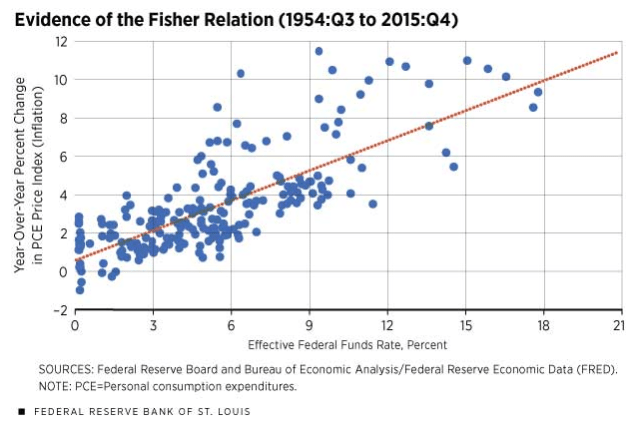
The notion that higher rates from the Fed cause higher inflation seems to be getting a bit of a hearing;
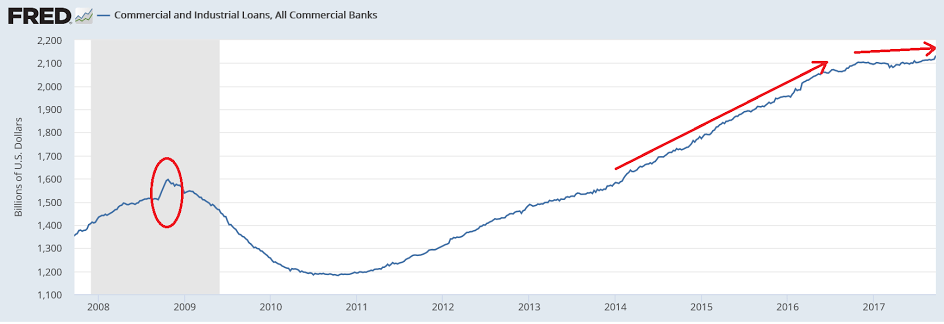
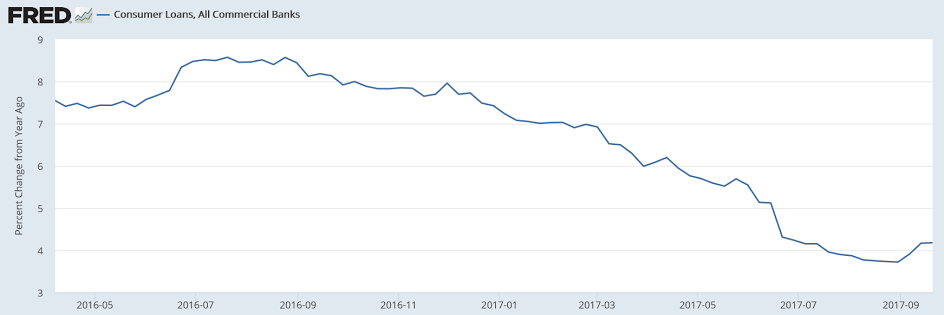
You may be hearing about ‘spike’ in lending last week, so I’ll try to give you some perspective using commercial and industrial lending charts before just showing year over year changes:
In this 10 year chart you can see how the growth in lending suddenly slowed back in November 2016. You can also see that last week’s spike up is something that’s happened many times and looks like ‘normal volatility’ and, at least so far, not an indication of something unusual happening that’s changed the overall outlook. Or, as also happened in prior cycles, a spike in borrowing can be a sign of distress, such as when inventories spike will falling sales, or when other shocks to cash flow force sudden borrowings:
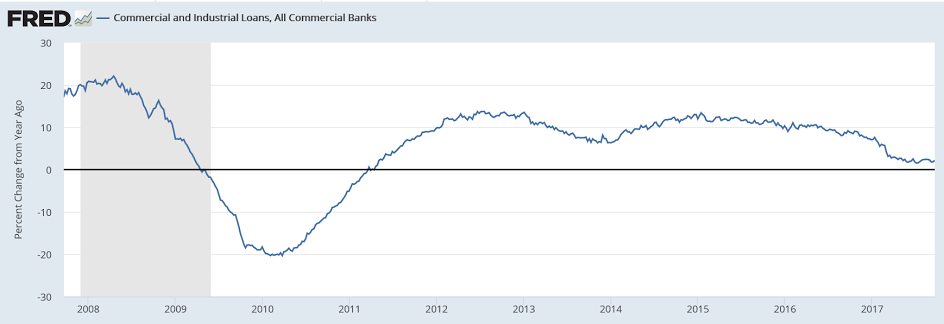
On a year over year basis last week’s increase in lending also doesn’t look to have changed the outlook:

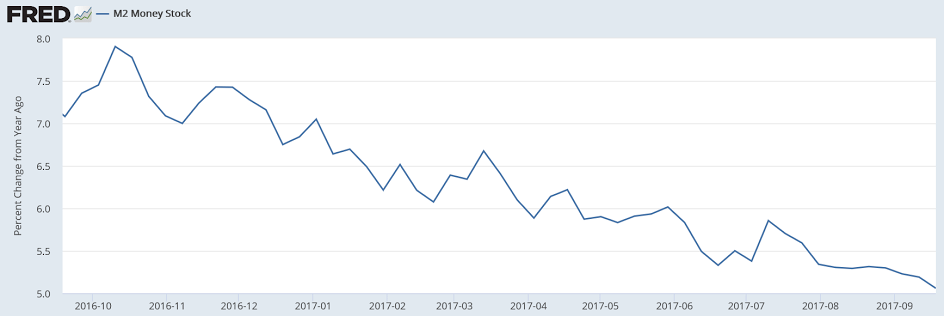
Loans create deposits, with M2 a partial measure of deposits, which can be altered by QE and other operating factors like cash in circulation. But those types of things have been largely quiet recently so M2 growth is currently a not terrible look at overall deposit growth:
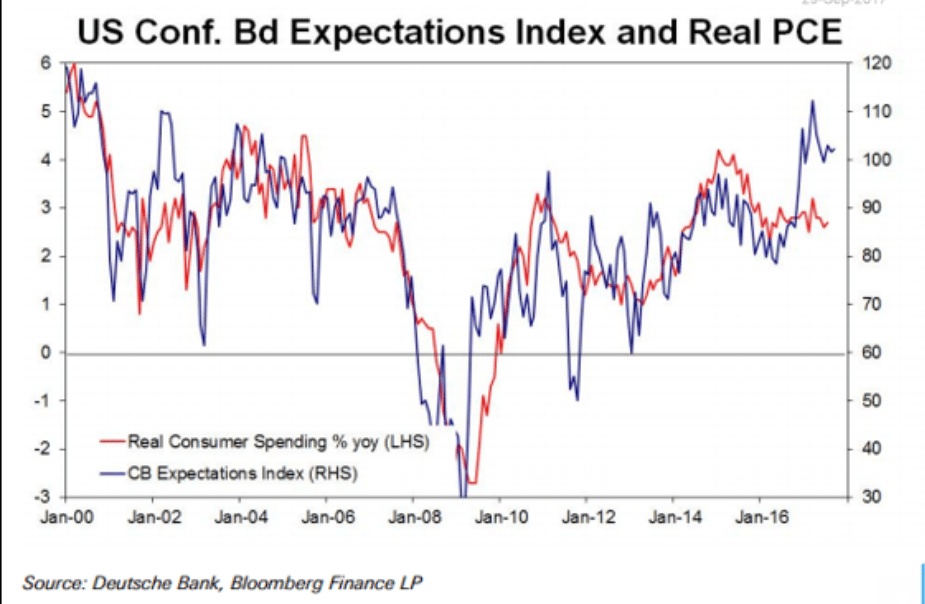
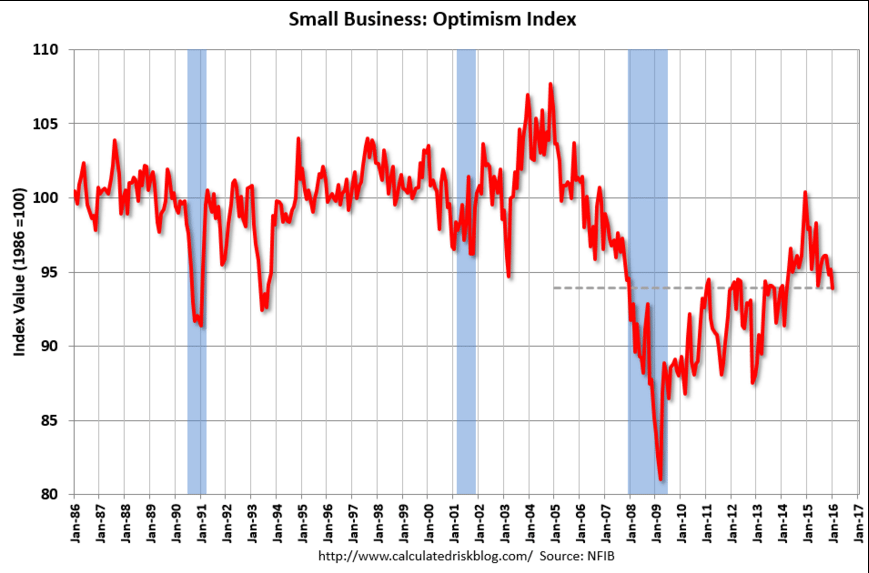
Trumped up expectations and surveys vs real spending, which has been weak:
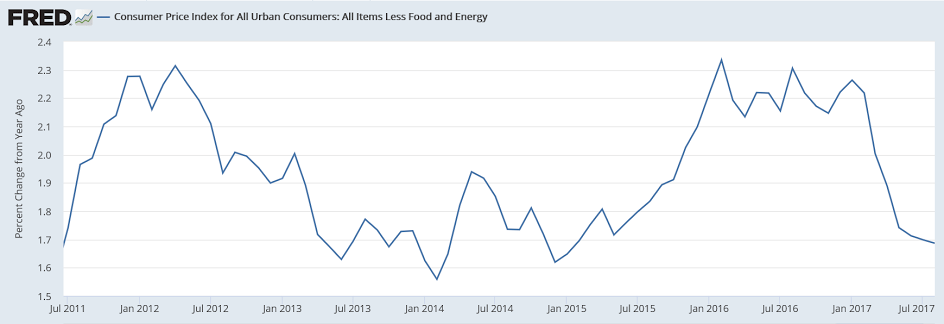
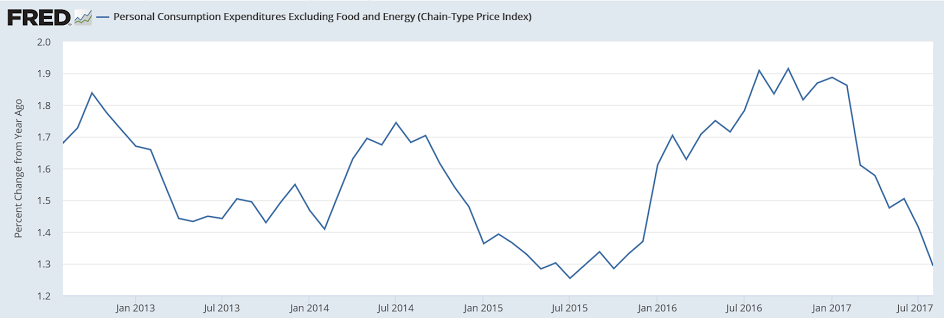
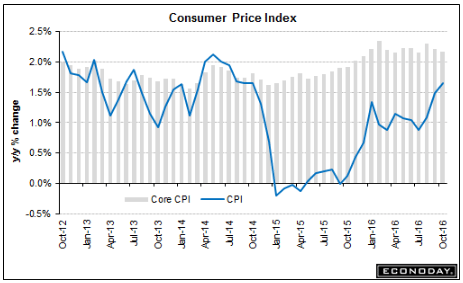
And what is called ‘inflation’ is also looking weak:
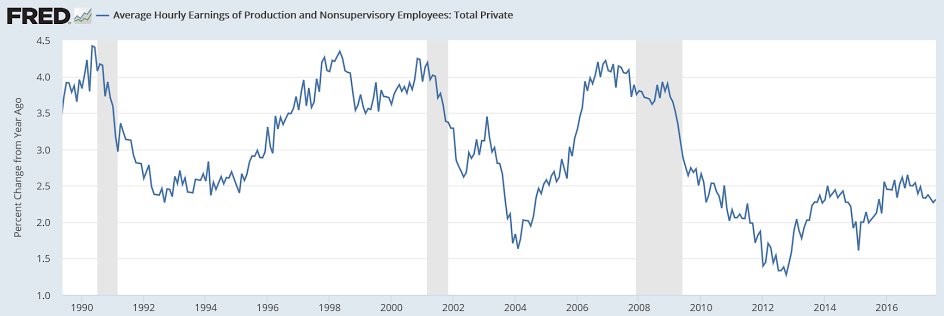
And wage growth remains at what are generally historic lows:
So the Fed sees all this, and indicates that they are leaning to another rate hike in December, as they continue to forecast increases in inflation that, after many years of similar forecasts, have yet to materialize. And they list every reason for the low inflation indicators, except for a lack of aggregate demand (low spending), when all of the above charts support a low demand story, as does all of the other weak data released last week- personal income, housing starts and sales, etc.
Presumably the Fed is raising rates to ‘remove accommodation’ which means they are trying to keep things that aren’t growing all that fast now from growing too fast in the future do to all
the ‘accommodation’ they believe they have embedded in the economy with low rates and qe.
The channel for Fed interest rate policy is credit- lower rates are presumed to encourage borrowing, while higher rates are presumed to discourage borrowing. And so to me the Fed looking at the deceleration of the growth of lending and of M2 as evidence the economy needs more rate hikes and the unwinding of QE doesn’t make sense?
Note how this Fed President is worried about the risk of the emergence of too much demand:
Boston Fed President Eric Rosengren on Wednesday came down on the side of further interest-rate hikes, saying they would be a form of insurance against the possibility of an overheated economy.
Current economic trends suggest an economy “that risks pushing past what is sustainable,” Rosengren said in a speech to The Money Marketeers of New York University. This could result in higher asset prices, or inflation well above the Fed’s 2% target, he warned.
“Steps lowering the probability of such an outcome seem advisable — in other words, seem like insurance worth taking out at this time,” he said.
“As a result, it is my view that regular and gradual removal of monetary accommodation seems appropriate,” he added.
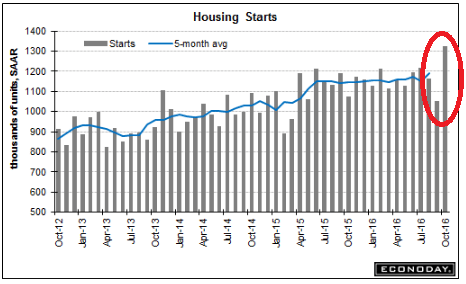
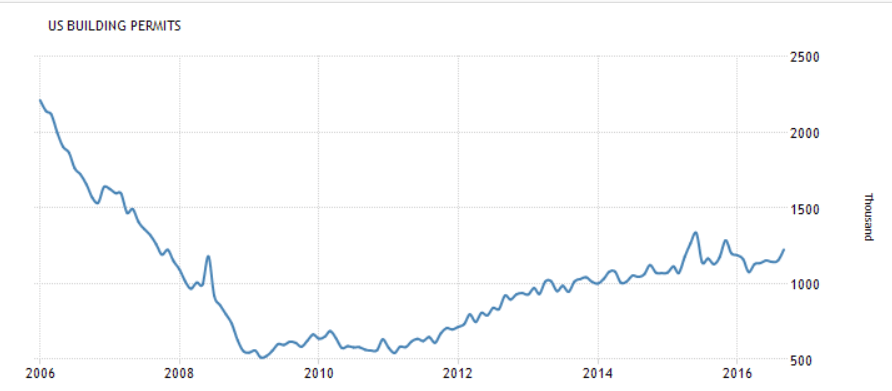
Nice move up after a large move down. Note that the average of the last two months is about where this series has been. And, again, it’s the permits that count, and they are about the same as last month. And not to forget mortgage applications to buy homes fell a full 6% last week after rates went up in response to the election.
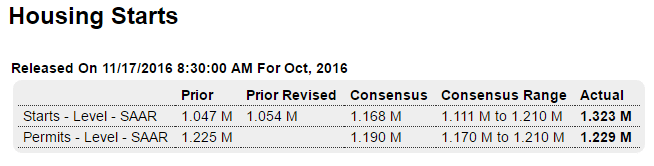
Highlights
In data that will lift estimates for fourth-quarter GDP, housing starts surged 25.5 percent in October to a 1.323 million annualized rate. This is the best rate of the cycle, since August 2007 with the monthly percentage gain the strongest since 1982. The jump reflects a 10.7 percent rise to an 869,000 rate for the report’s key component, single-family homes, that follows an 8.4 percent surge in September. And multi-family homes snapped back from September’s odd 39 percent decline, rising 69 percent in October to a 454,000 rate.
But there’s less strength in permits which, however, did rise 0.3 percent to a 1.229 million rate. Importantly, single-family permits are up 2.7 percent in the data to offset a 3.3 percent dip for multi-family homes.
There’s plenty of strength in this report but it’s centered in the near-term, less so in the coming months. Other data include a 5.5 percent gain for completions to a 1.055 million rate led here by a 9.7 percent gain for the multi-family component with single-family homes up a very solid 3.9 percent. Regionally the West, which is key region for builders, is showing the most strength in this report followed by the Midwest. The South is mixed and the Northeast is mostly soft.
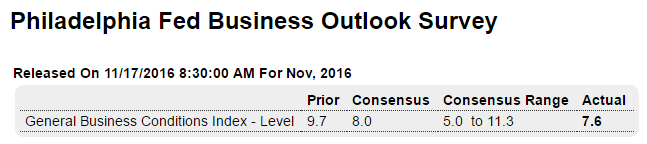
Highlights
The Philly Fed continues to pick up signs of strength in the long dormant factory sector. The November headline looks tame at plus 7.6 but most of the details are very strong. New orders are up for a third month in a row and at very sharp multi-year high of 18.6. And unfilled orders make a rare appearance in the plus column at 4.1.
Shipments are at 19.5 and inventories, which are usually negative, are also in the plus column and strongly so at 13.4. Underscoring all the strength is solid and sudden life in prices with input costs surging nearly 20 points to 27.5 and selling prices also surging nearly 20 points to 16.0. The weakness in the report is in employment which continues to run in the negative column, at minus 2.6. However, if the strength in orders is repeated in the coming months, new hiring in the Mid-Atlantic factory sector is bound to begin.
Today’s report adds to a mix of indications, including the details of yesterday’s industrial production report, that the factory sector appears to be accelerating into the 2016 close.
Getting more obvious it’s ‘spreading’ much like during the sub prime days, as previously discussed?
European banks face major cash crunch
European banks may have to pare down assets to bolster capital reserves as cheap oil is taking a toll on portfolios of energy-exposed loans.
It’s slowing, whatever it is…
;)
Labor Market Conditions Index
Highlights
Payroll growth slowed in Friday’s employment report as did the Fed’s labor market conditions index, to plus 0.4 in January from a downward revised plus 2.3 in December (2.9 initially) and an upward revised plus 2.9 in November (2.8 initially). January’s reading indicates the lowest level of labor market expansion since April last year and also reflects the climbing trends in jobless claims. One big positive for the labor market, however, is the falling unemployment rate, at a recovery low 4.9 percent in January.
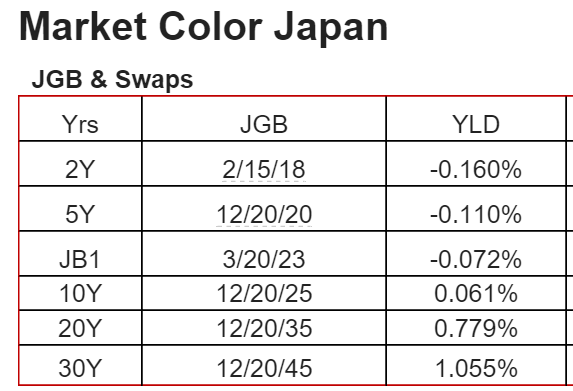
This is the yen yield curve after over 20 years of a 0 rate policy, massive QE, and now negative overnight rates. Maybe now the economy will finally respond.
:(
(And how good can the BOJ think the economy is?)
The western educated kids/monetarists who’ve taken control don’t seem to be doing all that well, as China begins to look like the other countries they’ve taken over, like the EU, US, etc. etc. etc. What they learned is that it’s about balancing the federal budget and using monetary policy to support growth and employment as needed, allowing ‘free markets’ to ‘clear’ as per their general equilibrium models that earned them advanced degrees. Unfortunately they fail to recognize the currency itself is a (simple) public monopoly which obviates all those ‘market clearing’ assumptions in their models:
China official PMI misses in January, Caixin PMI shows contraction
Jan 31 (CNBC) — China’s factory activity skidded to a three-year low point in January, adding to further gloom about the state of the world’s second-largest economy.
The government-compiled January manufacturing purchasing manager’s index (PMI) came in at 49.4, slightly missing Reuters consensus estimates for a 49.6 reading and ticking down from December’s 49.7 figure. It was the weakest result since 2012 and marked the sixth straight month in contraction territory.
The mood was worsened by a private survey by Caixin and Markit that showed January manufacturing activity shrinking for the eleventh straight month. Caixin’s survey, which tracks smaller firms than the official indicator, came in at 48.4, compared to December’s reading of 48.2.
Does this read like an executive who’s organization has a $200 million per year research budget?
They just hiked rates in December with every chart I’ve seen having been heading south for a year or so?
And GDP was right on forecast.
Seems to me this ‘kind of tells him’ the fundamental assumptions behind his models needs a rethink?
Fed’s Williams says sees ‘smidgen’ slower rate hikes
Jan 29 (Reuters) — “Standard monetary policy strategy says a little less inflation, maybe a little less growth … argue for just a smidgen slower process of normalizing rates,” San Francisco Fed President John Williams said. “We got a little stronger dollar, some mixed data on the economy, some weakness in Q4 GDP, all of those coming together kind of tell me that we probably need a little bit more monetary accommodation this year than I was thinking in the middle of December.” Williams said his “modal” forecast, remains fundamentally unchanged for 2016 and 2017. “The thing that has changed is that commodity prices keep coming down,” he said.
The hits keep on coming with no replacement spending in sight:
Chevron Posts Loss, Readies More Layoffs
Jan 29 (WSJ) — Chevron is slashing its capital spending by more than $9 billion this year. Chevron plans to sell up to $10 billion in oil fields and other assets through 2017. A $26.6 billion spending plan detailed in December will have to be reduced given how much oil-market conditions have since deteriorated, he company said. Chevron reported a loss of $588 million, or 31 cents a share, in the fourth quarter, down from a profit of $3.47 billion, or $1.85 a share, in the year-earlier period. Revenue tumbled 37% to $29.25 billion. In Chevron’s refining division profits were cut nearly in half, falling to $496 million.
For Mining Chiefs, Doomsday Scenarios Could Become Reality
Jan 29 (WSJ) — Refined-copper supply jumped 36% to 22.5 million tons from 2005 to 2014, according to ICSG data. Over that same period, annual copper consumption increased 38% to 22.9 million tons. Total Chinese copper imports fell to 8.6 million tons in 2015, down 2.2% from the year before. Global refined supply rose 1.8% over the same period, largely because of a 4% increase in refined production from China. China imports of unfinished copper and products in December rose 26% in annual terms to 530,000 tons. More than 600,000 tons of copper supply have been taken out of the market over the past 12 months, according to Morgan Stanley.
Not the worst indicator for global growth:
South Korean Exports Fall at Fastest Pace Since Financial Crisis
Jan 31 (WSJ) — Korean exports, the first shipments data released each month in Asia, slid 18.5% to $36.74 billion in January, the steepest fall since August 2009. The decline extended a run of monthly falls into a 13th month. Imports plunged 20.1% from a year earlier to $31.42 billion in January. For all of 2015, Korean shipments overseas contracted 8%—the steepest fall in six years and the first 12-month contraction in three years, the government said. The Nikkei PMI reading for January came in at 49.5, down from 50.7 in December.
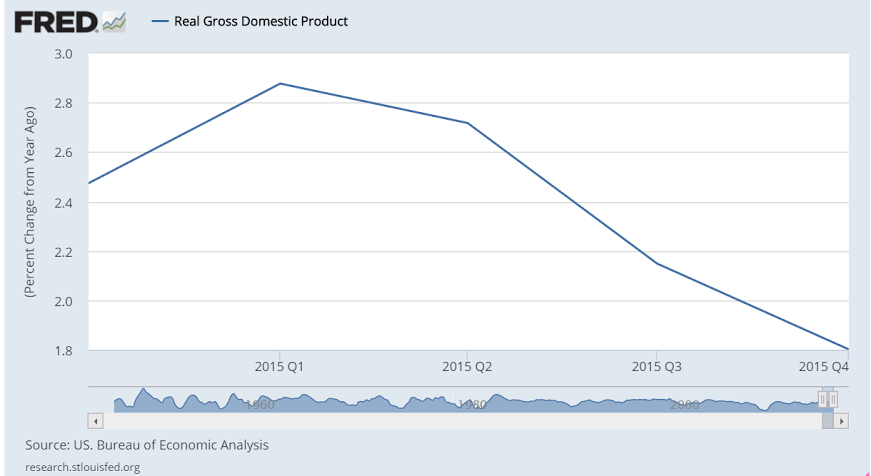
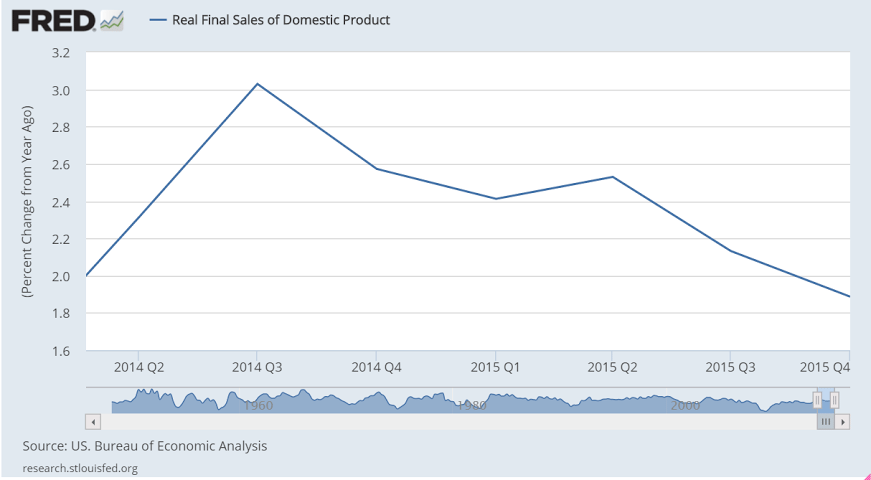
As expected, the deceleration continues, and over the next couple of years it wouldn’t surprise me if the entire year gets revised down substantially:
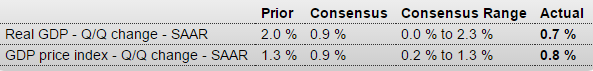
GDP
Highlights
Consumer spending is the central driver of the economy but is slowing, at least it was during the fourth quarter when GDP rose only at a 0.7 percent annualized rate. Final demand rose 1.2 percent, which is the weakest since first quarter last year but is still 5 tenths above GDP.
Spending on services, adding 0.9 percentage points, was a leading contributor to the quarter as was spending on goods, at plus 0.5. Residential investment, another measure of consumer health, rose very solidly once again, contributing 0.3 percentage points. Government purchases added modestly to growth.
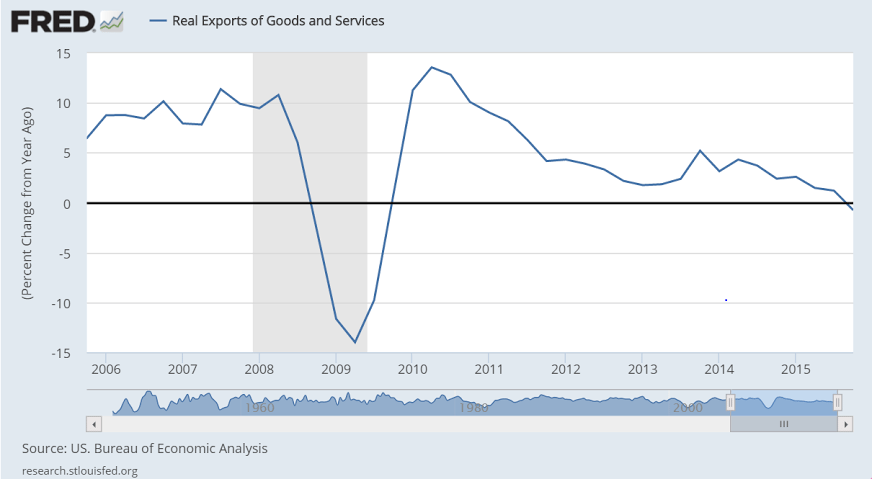
The negatives are on the business side especially those facing foreign markets. Net exports pulled down GDP by 0.5 percentage points. Non-residential investment pulled down GDP by more than 0.2 percentage points. Reduction in inventory investment, which the FOMC warned about on Wednesday, pulled the quarter down by 0.5 percentage points.
Price data are not accelerating, at plus 0.8 percent for the GDP price index which is the lowest reading since plus 0.1 in the first quarter last year. The core price reading is only slightly higher, at plus 1.1 percent which is also the weakest reading in a year.
There are definitely points of concern in this report, especially the weakness in exports and business investment, but it’s the resilience in the consumer, despite a soft holiday season, that headlines this report and should help confirm faith in the domestic strength of the economy.
And this from JPM:
Consumer spending slowed to a 2.2% pace of advance, while business fixed investment spending contracted at a 1.8% rate, the first decline since 2012. A slowing in inventory investment subtracted 0.5%-point from growth last quarter. Even so, the pace of stockbuilding—a $69 billion annual rate—is still faster than is sustainable and poses an ongoing headwind to producers early in 2016. As such, after today’s report we see some more downside risk to our 2.0% projection for Q1 GDP growth.
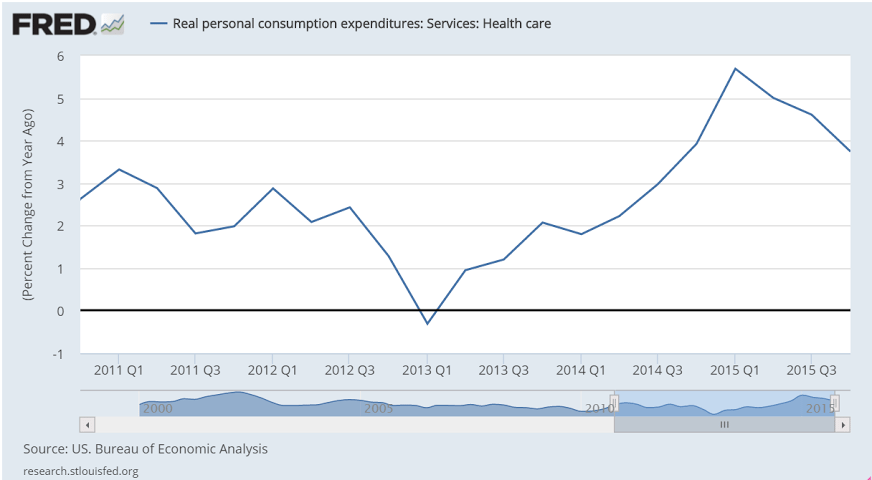
The consumer looks to be going down hill to me, and this includes increases in total health care premiums due to the newly insured under Obamacare. This chart is not adjusted for inflation, which shows the growth of nominal spending has slowed dramatically. Fortunately the ‘deflator’ indicates that with prices down real purchases have been sustained. But consumers on average tend to spend most all of their incomes, which means fortunately for them prices didn’t rise as fast or they would have bought fewer real goods and services.
Here’s the last year of GDP year over year growth, after oil capex collapsed:
This is nominal GDP, not adjusted for inflation:
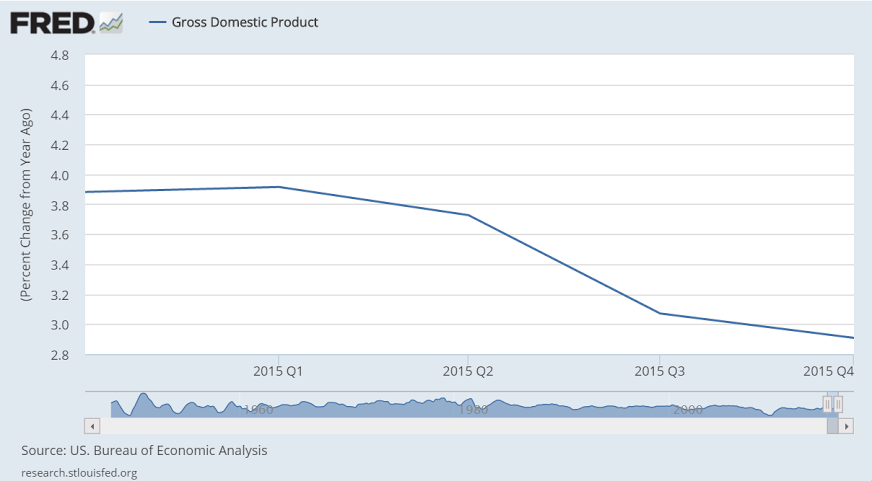
Note the relation between export collapses and recessions:
The increase in premium expenditures for the newly insured is a ‘one time’ event that offered support last year and won’t be repeated this year.
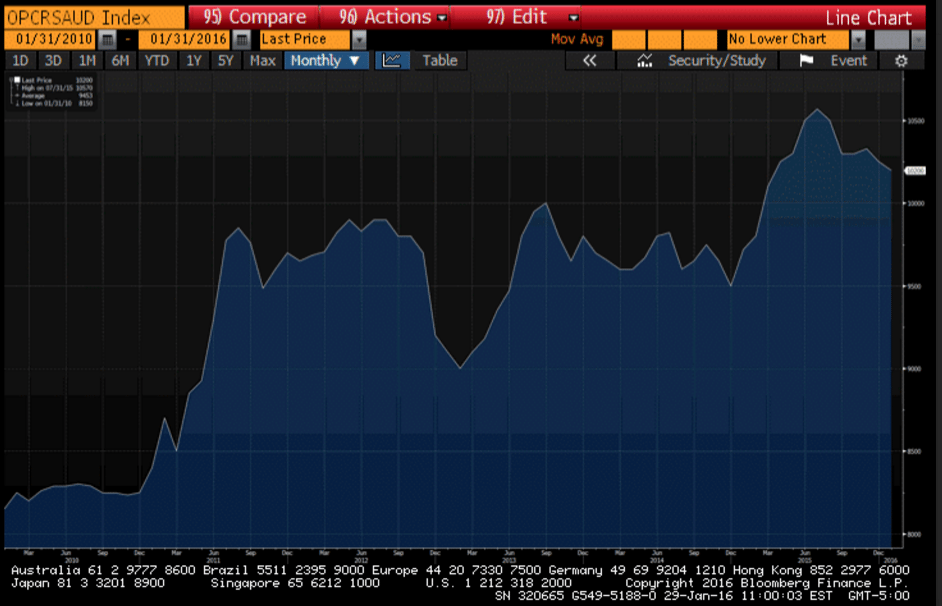
Interesting how even at the dramatically lowered prices due to increased discounts the Saudis appear to be selling less oil. Patiently waiting for March pricing to be released:
Yet another bad one:
Kansas City Fed Manufacturing Index
Highlights
Kansas City manufacturing, along with that of Dallas, are suffering the worst of any regions in the nation’s factory contraction. Kansas City came in at minus 9 for the ninth contraction in 10 months.
Minus signs sweep nearly all readings including new orders and backlogs which are in extremely deep contraction, at minus 27 and minus 36 respectively. Production is at minus 8 with shipments at minus 7. Employment is at minus 7 with price readings moving deeper into contraction, at minus 14 for raw materials and, ominously for inflation expectations, at minus 15 for finished products.
One of the few pluses in the report, ironically, is the index for new export orders which came in at a very modest plus 1. But it’s not only exports that have been pulling down the factory sector but also energy equipment, the latter which is especially sinking the nation’s energy patch.
Chicago PMI: Jan Chicago Business Barometer Jumps 12.7 Points to 55.6
The Chicago Business Barometer bounced back sharply in January, increasing 12.7 points to 55.6 from 42.9 in December, the highest pace of growth in a year.
Chief Economist of MNI Indicators Philip Uglow said, “While the surge in activity in January marks a positive start to the year, it follows significant weakness in the previous two months, with the latest rise not sufficient to offset the previous falls in output and orders. Previously, surges of such magnitude have not been maintained so we would expect to see some easing in February. Still, even if activity does moderate somewhat next month, the latest increase supports the view that GDP will bounce back in Q1 following the expected slowdown in Q4.”
“At current prices U.S. shale producers are losing more than $2 billion a week, according to consulting firm AlixPartners LLP.”
” Italian gross domestic product per capita has hardly changed in 20 years.”
And all they needed was a fiscal adjustment sufficient to get aggregate demand to appropriate levels:
Amari’s fall leaves Abenomics in lurch
Jan 29 (Nikkei) — “I bear responsibility for appointing him,” a visibly pained Abe told reporters Thursday following the resignation of Akira Amari, who also served as his right-hand man in the Trans-Pacific Partnership trade negotiations. Amari devised the basis for Abenomics. He helped alter LDP economic policy’s traditional bias toward public works, shifting the emphasis to a pro-growth strategy of making Japanese companies more competitive and innovative. After Abe led the LDP back to power in 2012, he put Amari in charge of the government’s new industrial competitiveness council and the reconstituted Council on Economic and Fiscal Policy.
Nor will this work, negative rates are just another tax:
BOJ adopts negative interest rates
Jan 29 (Nikkei) — The Bank of Japan decided to adopt negative interest rates at its policy meeting on Friday, voting 5-4 to apply an interest rate of -0.1 percent on current accounts that financial institutions hold at the central bank. At the same time, the BOJ revised its inflation forecast for fiscal 2016 down to 0.8% from a previous level of 1.4%. In a statement, the BOJ said it adopted the negative interest rate policy in order to achieve its price stability target of 2% at the earliest possible time, and signalled that it will “cut the interest rate further into negative territory if judged necessary.”
This might have had something to do with their decision:
Japan’s industrial output falls 1.4% in December, down for 2nd month
Jan 29 (Kyodo) — Japan’s industrial output in December fell a seasonally adjusted 1.4 percent from the previous month, in sharp contrast with a rise of 0.9 percent the government had projected based on hearings with manufacturers last month. The government said the trend of output is fluctuating without clear direction, maintaining its basic assessment of production from the previous month. For 2015, the industrial output index fell 0.8 percent from the previous year. The production index increased 2.1 percent in 2014. Polled manufacturers said they expect output to rise 7.6 percent in January and then fall by 4.1 percent in February.
Also tracing the weakness back to the oil capex collapse:
Econintersect’s Economic Index declined and is barely positive – and still remains at the lowest value since the end of the Great Recession. The tracked sectors of the economy which showed growth were mostly offset by the sectors in contraction. Our economic index remains in a long term decline since late 2014.
The Fed got this highlighted first part right:
Information received since the Federal Open Market Committee met in OctoberDecember suggests that labor market conditions improved further even as growth slowed late last year.
No growth here:
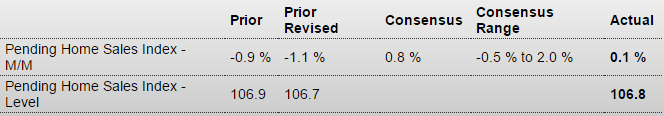
Pending Home Sales Index
Highlights
Sales of existing homes popped higher in December but a further gain for January is uncertain given only a 0.1 percent rise in pending home sales which follows a downward revised 1.1 percent decline in November. It usually takes one to two months for contract signings to close with greater delays possible given new mortgage documentation rules that were implemented in November. Also raising doubts whether January will prove to be a solid month is this report’s narrow breakdown with the Northeast, the smallest of the housing regions, the only one in the positive column in the month, at 6.1 percent. The other three regions show declines with the sharpest in the West at minus 2.1 percent. Despite this report, recent news on the housing sector has been positive including gains for sales and also respectable appreciation for prices.
Negative and decelerating:
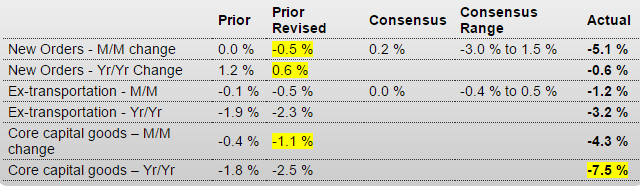
Durable Goods Orders
Highlights
The factory sector ended 2015 with a giant thud. Durable goods orders fell 5.1 percent in December vs expectations for a 0.2 percent gain and a low-end estimate of minus 3.0 percent. Aircraft orders didn’t help but they weren’t the whole cause of the problem as ex-transportation orders fell 1.2 percent vs expectations for no change and a low-end estimate of minus 0.4 percent. Core capital goods, which exclude defense equipment and also aircraft, are especially weak, down 4.3 percent following a 1.1 percent decline in November. Shipments for core capital goods, which are an input into GDP, slipped 0.2 percent following a downward revised 1.1 percent decline in November (initially minus 0.4 percent).
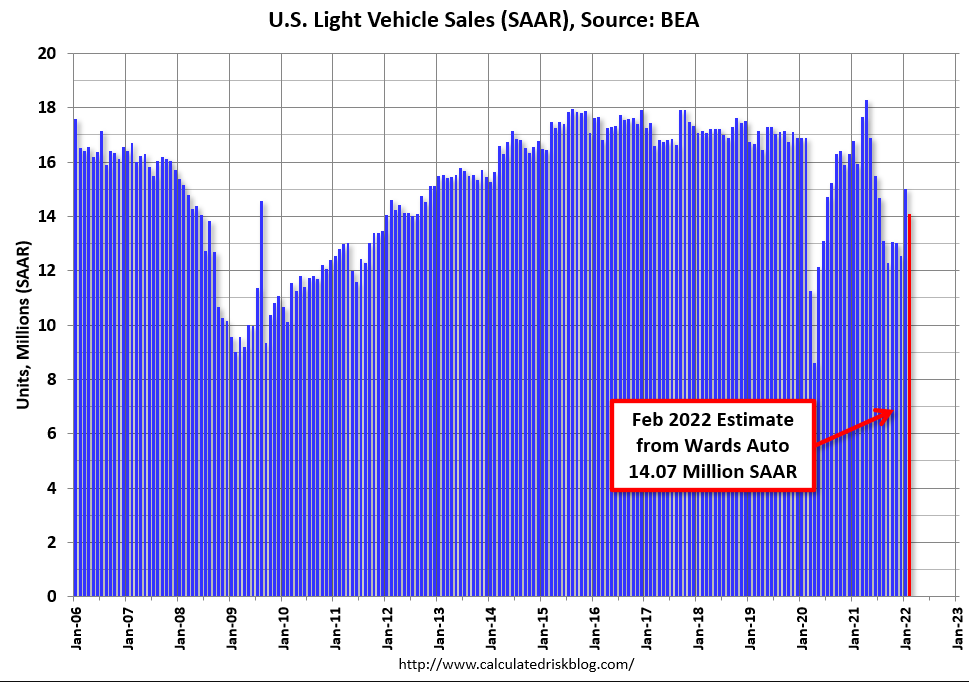
Orders for civilian aircraft lead the dismal list, down 29 percent in December. The other main subcomponent for transportation, motor vehicles, also fell, down 0.4 percent in a reminder that vehicle sales were slowing at year end. Capital goods industries show deep declines: machinery down 5.6 percent, computers down 8.7 percent, communications equipment down 21 percent, and fabricated metals down 0.5 percent.
Other readings include a surprising 2.2 percent monthly drop in total shipments and a 0.5 percent drop in total unfilled orders. All this weakness isn’t a plus for inventories which rose 0.5 percent to lift the inventory-to-shipments ratio sharply, to 1.69 from 1.64. The rise in inventories poses a headwind to the sector and will dampen future shipments as well as employment and is a reminder of the inventory warning in yesterday’s FOMC statement.
There’s been trouble brewing in the factory sector, recently indicated by the Empire State and Dallas Fed reports and also by the ISM index which has fallen below breakeven 50. Weak export markets, made weaker for U.S. manufacturers by the strength of the dollar, together with contraction in the energy sector may now be pushing the factory into an accelerated breakdown, at least that’s the concern.
Reads like we are already in recession…
Recession Warnings May Not Come to Pass
Jan 24 (WSJ) — Every U.S. recession since World War II has been foretold by sharp declines in industrial production, corporate profits and the stock market. Industrial production has declined in 10 of the past 12 months, and is now off nearly 2% from its peak in December 2014. Corporate profits peaked around the summer of 2014 and were off by nearly 5% as of the third quarter of last year. The Dow Jones Industrial Average is down 7.6% so far this year. A Goldman Sachs analysis found that profit margins among the companies in the S&P 500 stock index—if energy companies are excluded—have been little changed over the past year.
So does this:
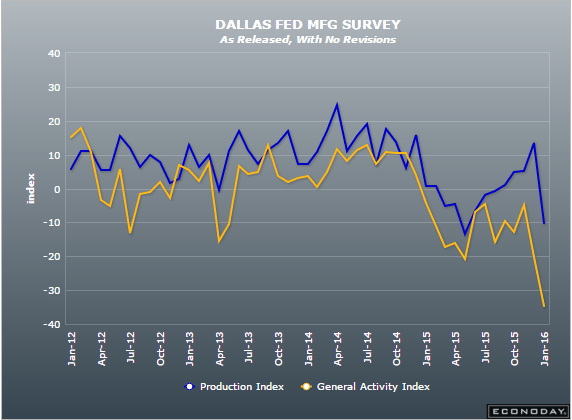
Dallas Fed Mfg Survey
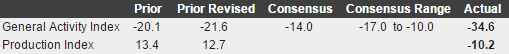
Highlights
Manufacturing data from the Dallas Fed, along with that of the Kansas City Fed, have been offering the most striking evidence of oil-related contraction. Dallas’ general activity index came in at an extremely negative score of minus 34.6 for the January report which is the lowest reading since the beginning of the recovery in 2009.
New orders are falling deeper into contraction as are unfilled orders. Hours worked are now in the negative column as is employment. And finally falling into contraction — and in a big way — is the production index which had through last year, despite long weakness in orders, held in positive ground, but not anymore with the reading at minus 10.2 for a nearly 23 point monthly plunge. Price data in this report remain well into the minus column, at nearly double-digit monthly declines.
Manufacturing reports this month have been mixed, with this and Empire State pointing to another buckling but not the most closely followed report, the Philly Fed which is pointing to stability for the sector. Watch for the Richmond Fed report tomorrow and the Kansas City report on Thursday.
Recent History Of This Indicator
The Dallas Fed general activity index has been buried in deep contraction and, along with the Kansas City Fed report, have been suffering the greatest effects from the collapse in oil. The Econoday median is calling for a 13th straight month of contraction, at a steep minus 14.0 for January vs December’s minus 20.1. Production has held in the plus column for this report but the outlook for continued strength is not supported by new orders which have been in contraction for 14 months.