NY Mfg survey, Home builder’s index, oil losses, Japan, China trade, euro trade

A lot worse than expected and still deep in contraction:

Empire State Mfg Survey
er-2-16-1
Highlights
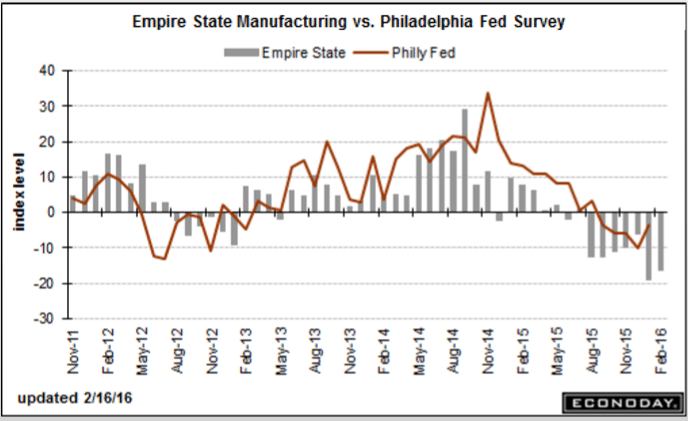
For the seventh straight month, the Empire State report is signaling significant contraction for the manufacturing sector. The general business conditions index for February came in below low-end expectations, at minus 16.64 vs even deeper contraction of minus 19.37 in January. New orders, at minus 11.63, are in contraction for a ninth month in a row while employment, though improving to minus 0.99 from minus 13.00, is in contraction for an eighth month in a row.

Shipments are in contraction at minus 11.56 with unfilled orders at minus 6.93. The workweek is at minus 5.94. One reading in the plus column is the six-month outlook, up nearly 5 points to 14.48 which, however, is unusually low for this reading which usually tracks in the 30s and 40s. Price data show marginal improvement for inputs but contraction for finished goods.

This report is showing its weakest run by far of the recovery and, unfortunately, points to extended weakness for the nation’s factory which is getting hit by weak exports and weak energy markets at home.
er-2-16-2
This is going the wrong way for what’s been promoted as the ‘driver’ of the economy for the year:

Housing Market Index
er-2-16-3
Highlights
Optimism among home builders is cooling noticeably, based on the housing market index for February which is down 3 points to 58 for the lowest reading since May last year. But 58 is still well over breakeven 50 with the future sales component actually rising 1 point to 65. The current sales component, however, is down 3 points to 65 which points to expected slowing for tomorrow’s starts & permits data. The traffic component has been holding down this report throughout the whole recovery and continues to do so, down a steep 5 points to 39 and the lowest reading since also May last year. Weakness here reflects lack of first-time buyers and also perhaps the major snowstorm that hit the East Coast at mid-month.

Details show step backwards for all four regions with the West, a key region for the new home sector, down 5 points to a still standout composite score of 68. The South and Midwest are both at 57 with the Northeast continuing to trail far behind, down 2 points to 45.

Builders are citing scarcity of both labor and available lots as negatives right now. Momentum in the housing sector was bumpy last year and, based on this report, looks to remain so, at least through the early part of this year.

As previously discussed, not good for bank, either:

High risk of bankruptcy for one-third of oil firms: Deloitte

Feb 16 (Reuters) — Roughly a third of oil producers are at high risk of slipping into bankruptcy this year as low commodity prices crimp their access to cash and ability to cut debt, according to a study by Deloitte. The report is based on a review of more than 500 publicly traded oil and natural gas exploration and production companies across the globe. The roughly 175 companies at risk of bankruptcy have more than $150 billion in debt, with the slipping value of secondary stock offerings and asset sales further hindering their ability to generate cash, Deloitte said in the report.

Pro active currency depreciation tends to have these kinds of consequences:

Japan’s household spending falls 2.7% in 2015

Feb 16 (Kyodo) — Japan’s average monthly household spending in 2015 fell 2.7 percent in price-adjusted real terms from the previous year to 247,126 yen for the second straight year of decrease. The drop followed a demand surge in the January to March period in 2014 before the consumption tax increase in April as well as weak sales of clothing due to an unusually warm winter, according to an official of the Internal Affairs and Communications Ministry. The decline compares with a 3.2 percent drop in 2014. Household spending figures are a key indicator of private spending, which accounts for around 60 percent of the nation’s gross domestic product.

Two things. First, weak exports tend to reflect weak global demand. Second, reduced imports tend to reflect weak domestic demand.

And the ‘solid’ -;)- trade surplus is a fundamental force that works to support the currency:

China Trade Surplus Hits Fresh Record High in January

China trade surplus stood at USD63.29 billion in January of 2016, widening from USD60.03 billion reported a year earlier and beating market consensus. It is the largest trade surplus on record, as exports and imports fell far worse than expected. In January, exports plunged by 11.2 percent year-on-year to USD177.48 billion, following a 1.4 percent fall in December 2015.Imports tumbled by 18.8 percent year-on-year to USD114.19 billion, following a 7.6 percent decline in the preceding month, the 14th straight month of contraction, as a result of declining commodity prices and weak demand.
Same for the euro:
er-2-16-4

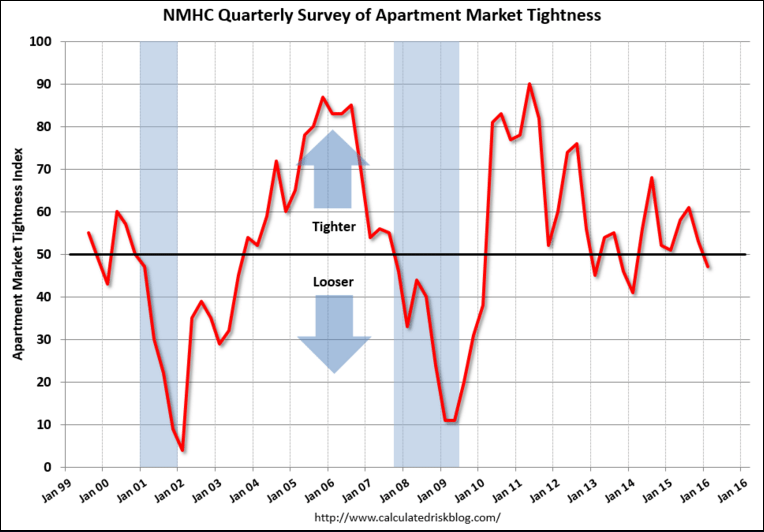
Apartment market tightness, Euro area trade surplus, Spain

er-1-15-1

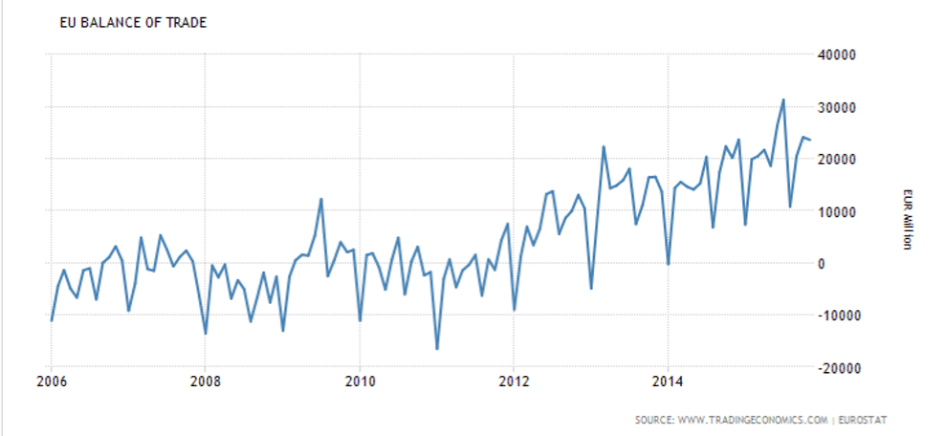
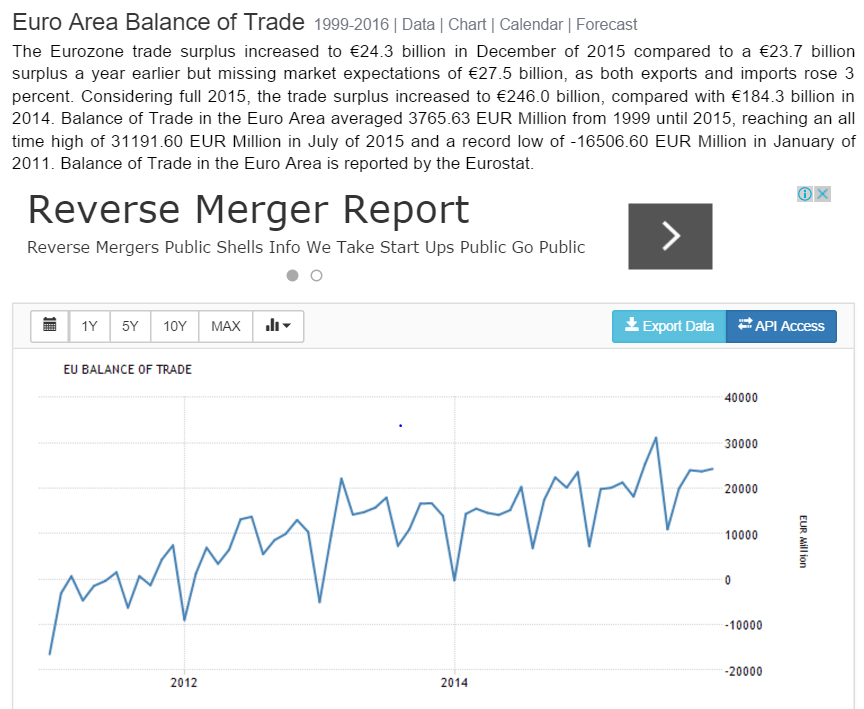
This just keeps going up, which fundamentally tends to drive up the euro which tends to continue to be subject to said upward pressure until the trade picture reverses:

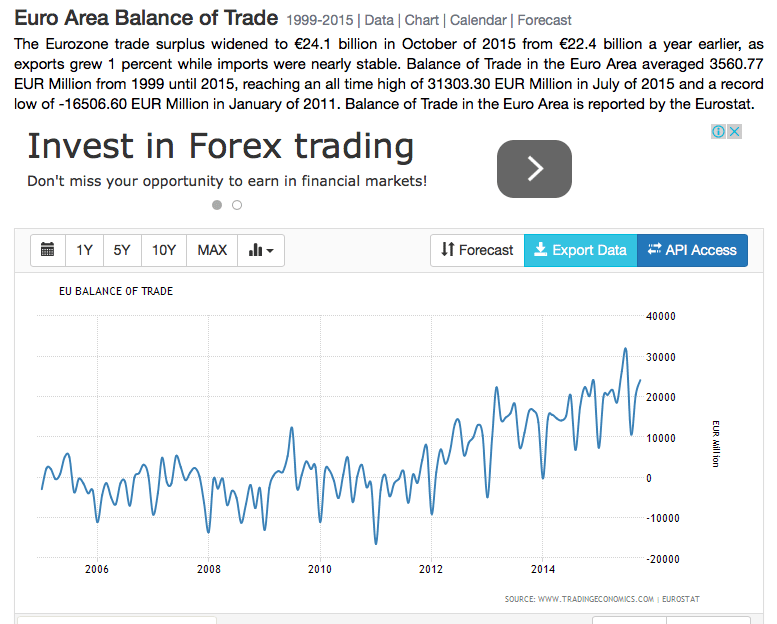
Euro Area Balance of Trade

The Eurozone trade surplus increased to €23.6 billion in November of 2015 compared to a €20.2 billion surplus a year earlier. Exports recorded the highest annual gain in four months and imports rebounded.
er-1-15-12

Potential showdown that could drive up Spanish rates:

Guindos Ditches Pledge on Spain Deficit to Push Growth

By Maria Tadeo

Jan 14 (Bloomberg) — Spanish finance chief Luis de Guindos ditched his promise to meet European Union budget goals saying shoring up economic growth is more important for his country’s future.

De Guindos said worrying about whether the budget deficit comes in a few tenths of a percentage point above the country’s 4.2 percent target for 2015 would be a distraction from the fundamental challenge of protecting the economic recovery.

“What is important is to maintain the pace of growth of the Spanish economy,” he told reporters on Thursday before meeting euro-area finance ministers for the first time since December’s general election left the parliament divided between four major parties.

“The biggest risk for budget policy is that the Spanish economy slows down,” de Guindos added.

Spain risks being drawn into a clash with the European Commission which has been warning since October that the spending plans acting Prime Minister Mariano Rajoy pushed through ahead of the election don’t do enough to curb the currency union’s biggest budget shortfall. Eurogroup chief Jeroen Dijsselbloem, who saw off a challenge from de Guindos to hang on to his job last year, said this month that Spain won’t be allowed any more flexibility over its target, according to El Pais newspaper.

Speaking to reporters on Thursday, Dijsselbloem said Brussels would “wait for the outcome of the domestic political process,” before taking further action.

Mtg prch apps, Housing starts, Industrial production, Euro trade

Yes, up vs last year’s dip, but remain depressed and have been
heading south since early this year:

MBA Mortgage Applications
er-12-16-12
Highlights
Application activity was little changed in the December 11 week, up 1 percent for refinancing and down 3.0 percent for home purchases. Year-on-year, purchase applications remain very high, up 34 percent in a gain that in part reflects a pulling forward of demand ahead of what is expected to be a rate hike at today’s FOMC. Rates were little changed in the week with the average 30-year fixed loan for conforming loan balances ($417,000 or less) unchanged at 4.14 percent. The rise in purchase applications points to strength for today’s housing starts and permits data.

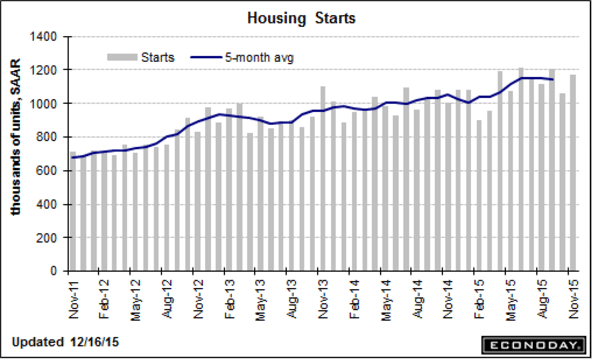
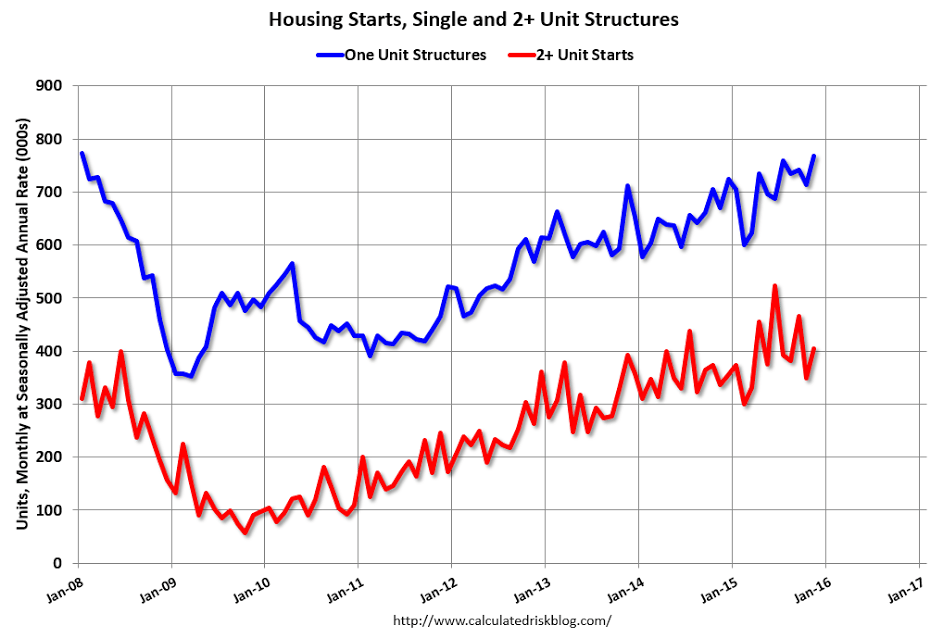
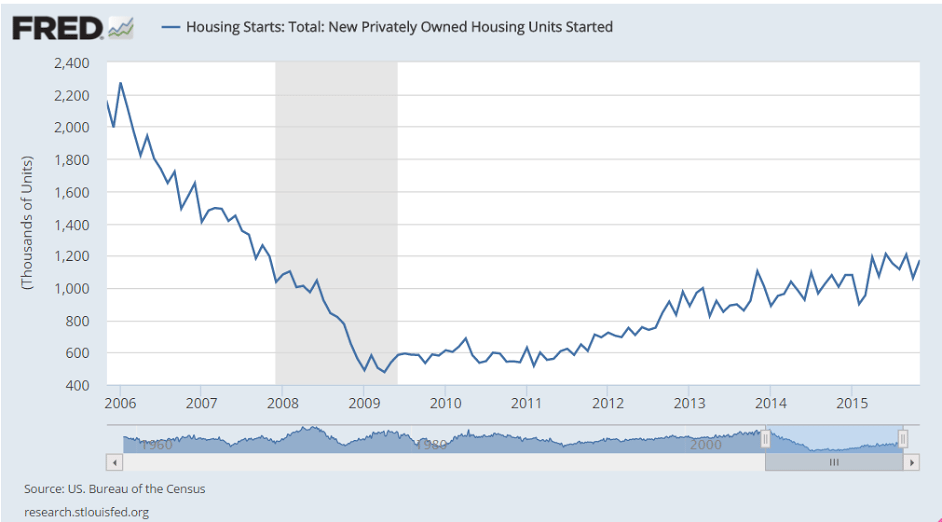
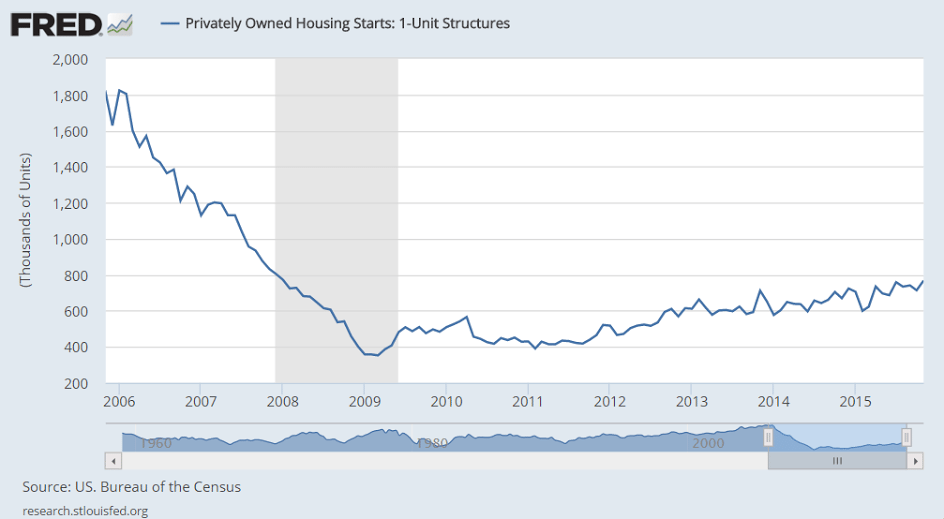
Up, which may give the Fed an excuse to hike rates, but remains severely depressed and gains again are in lower cost multifamily units, and even then the chart shows it’s all only been going sideways since February, with multifamily starts decelerating since the NY tax break expired in June:

Housing Starts
er-12-16-11

Highlights
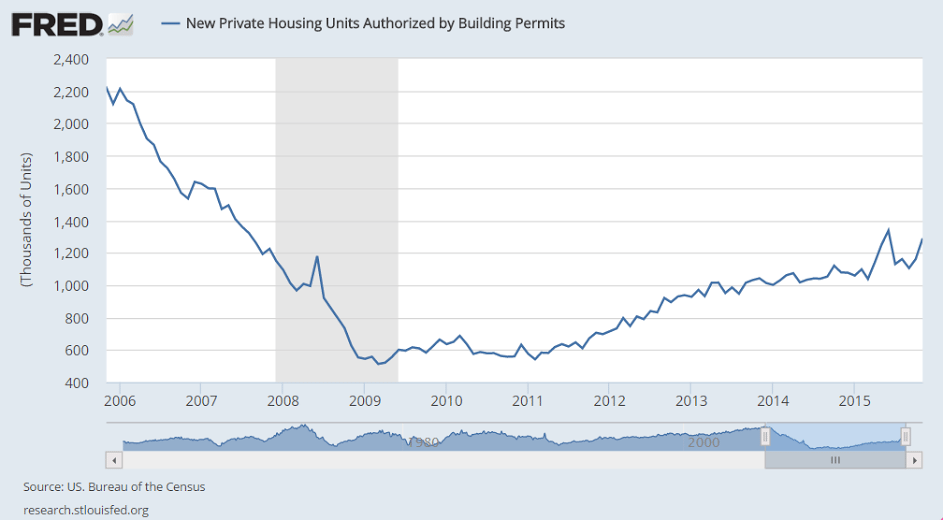
Housing permits surged in November, up 11.0 percent to a far higher-than-expected annualized rate of 1.289 million and reflecting a 27 percent monthly jump for multi-family units though permits for single-family homes also increased, up 1.1 percent. Starts were also very strong, up 10.5 percent to a 1.173 million rate with multi-family homes again leading the way, up 16.4 percent with single-family homes up 7.6 percent.

Year-on-year rates are robust, up 19.5 percent for permits (single-family up 9.0 percent, multi-family up 36 percent) and up 16.5 percent for starts (single-family up 14.6 percent, multi-family up 20 percent).

Homes under construction offer more good news, up a monthly 2.2 percent to a recovery best rate of 965,000 and up a very strong 18.3 percent year-on-year. Housing completions fell back for a second month in November, down 3.2 percent to a 947,000 to indicate that there’s still plenty of building underway. Year-on-year, completions are up 9.2 percent.

Strength for starts is certainly getting a boost from this winter’s mild weather while the gain in permits points in part to speculative demand, especially for multi-family units. Housing readings have been inconsistent but this report is very constructive for the new home and construction outlooks.

er-12-16-10

er-12-16-9

er-12-16-8

er-12-16-7

er-12-16-6

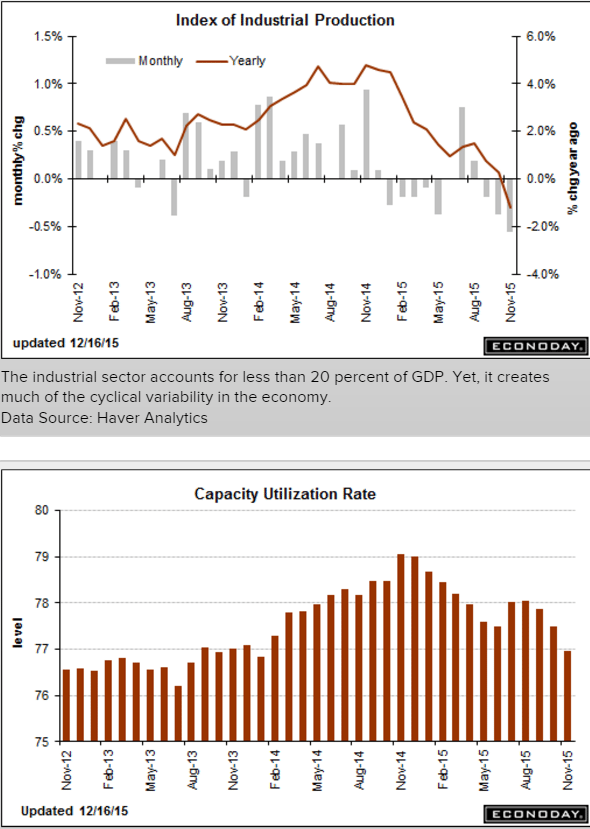
Yet another abysmal report from the industrial sector, which continues the tumble that began when oil capex collapsed about a year ago, and has yet to be ‘replaced’ by some other sector. And lost sales and output also means that much lost income in a downward spiral that can only be reversed by some sector ‘dipping into savings’ to spend that much more. And declining capacity utilization is one measure of slack for the Fed to consider:

Industrial Production
er-12-16-5
Highlights
November was another weak month for the industrial economy, in part reflecting unusually warm temperatures that are driving down utility output. Industrial production came in at the Econoday low forecast, down a very sharp 0.6 percent in November. This is the biggest drop in 3-1/2 years. Utility output fell a monthly 4.3 percent after falling 2.8 percent in October. Mining, reflecting low commodity prices and contraction in energy extraction, has also been week, down 1.1 percent for a third straight decline.

This brings us to the most important component, manufacturing where October’s 0.3 percent bounce higher (revised downward from 0.4 percent) now unfortunately looks like an outlier. Manufacturing production came in unchanged in November reflecting weakness in motor vehicles, down 1.0 percent in the month, and also a dip back for construction supplies which fell 0.2 percent after a weather-related surge of 2.3 percent in October. One positive is a slight snapback for business equipment which, after declines in the two prior months, rose 0.2 percent.

All the weakness is pulling down capacity utilization, to 77.0 percent in November for a heavy 5 tenths dip. Utilization is running more than 3 percentage points below its long-term average. Mining utilization is now under 80 percent, down 1.1 points in the month to 79.4 percent. Utility utilization fell 3.4 points in the month to 74.5 percent with manufacturing utilization down 1 tenth to 76.2 percent. Excess capacity, though not cited as a major factor behind the lack of inflation in the economy, does hold down the cost of goods.

Year-on-year rates confirm the weakness, down 1.2 percent overall with utilities down 7.6 percent and mining down 8.2 percent. Manufacturing is in the plus column but not by much at plus 0.9 percent.

Weather factors are skewing utility output but otherwise, readings are fundamentally soft and reflect the downturn in global demand made more severe for U.S. producers by strength in the dollar.

er-12-16-4
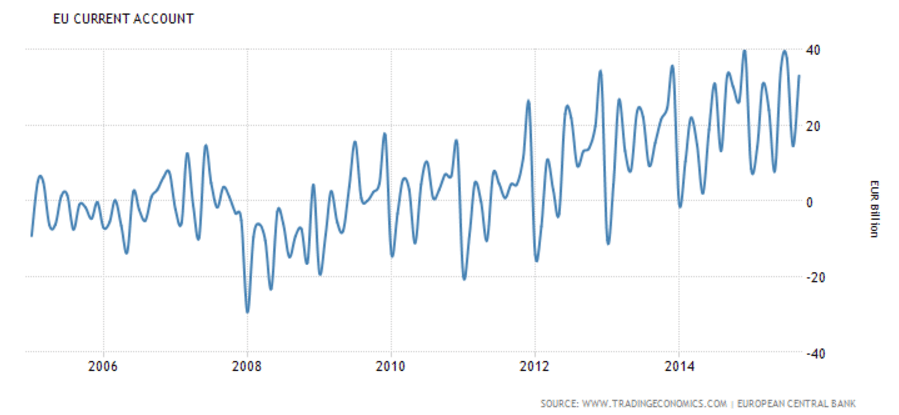
Euro area surplus high and continues to trend higher.

This is super strong currency stuff:
er-12-16-3
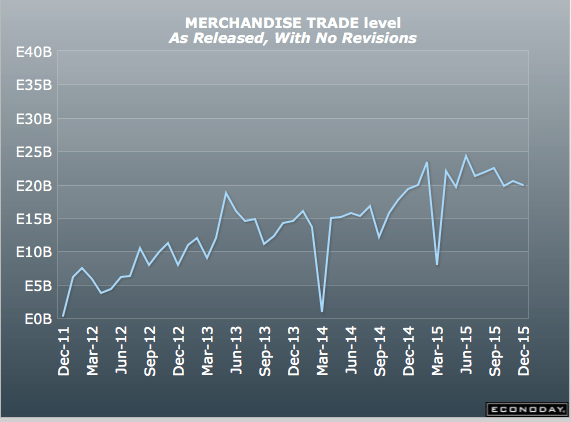
Different aggregate than the above, same message. And note exports growing with a weak global economy:

European Union : Merchandise Trade
er-12-16-2
Highlights
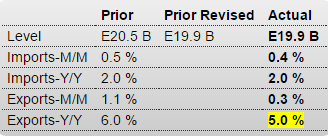
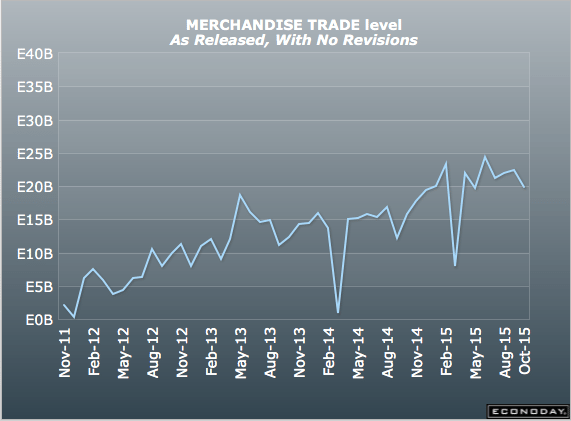
The seasonally adjusted trade balance returned a E19.9 billion surplus in October, matching the downwardly revised outturn in September.

The stability of the headline reflected a 0.3 percent monthly increase in exports and a 0.4 percent gain in imports. Exports stood at their highest level since July and were 5.0 percent above their year-ago level. Imports also recorded a 3-month peak and now show a yearly increase of 2.0 percent.

The October black ink was 3.1 percent below the average level in the third quarter when net exports subtracted 0.2 percentage points from quarterly GDP growth. Lower oil prices are helping to bias down nominal imports but the weakness of the euro should help to ensure a stronger performance from the real external trade sector moving through 2016.

er-12-16-1

Labor market conditions index, Euro and yen charts, Fed discussion

This is the Fed’s own index and it’s on the very weak side:

Labor Market Conditions Index
er-12-7-1
Highlights
Friday’s employment report, led by a 211,000 rise in non-farm payrolls, was solid but didn’t give the labor market conditions index much of a boost, coming in at only plus 0.5 vs expectations for plus 1.7. The October index, however, was revised 6 tenths higher to plus 2.2 reflecting in part the upward revision to that month’s nonfarm payroll growth which now stands at a very impressive 298,000. After dipping in the spring, this indicator, despite November’s soft outcome, is now on a seven-month winning streak.

Do you really want to bet against a currency with this kind of trade balance (surplus) and teetering on deflation? Looking like the yen fundamentals used to look when it was the strongest currency in the world, before the tsunami closed the nukes and the surplus turned to deficit? ;)
er-12-7-2
er-12-7-3
er-12-7-4

er-12-7-5
Fed comment:

The Fed uses models that use oil futures as indicators of the future price of oil, so they are currently forecasting a rise in oil prices and therefore a rise in inflation,vwhich feeds into their decision regarding interest rate policy.

Unfortunately, the FOMC doesn’t seem to understand the difference between the analysis of perishable vs non perishable commodities, and therefore they don’t recognize the higher oil futures prices express the cost of storage, rather than an indicator of future spot prices.

Atlanta Fed, Investor poll, Fed surveys

er-11-19-6

The crowd is not always wrong, but it’s not always right, either:

Fund managers polled at the start of November have significantly hiked their allocation to equities and cut cash holdings to levels not seen since July, according to research from Bank of America Merrill Lynch.

Of the 200 investors managing $576 billion of assets that were quizzed by the bank for its monthly fund manager survey, four-fifths now expect the U.S. Federal Reserve to raise rates this quarter.

Some 43 percent of managers are now “overweight” stocks, up 17 percentage points from the previous month.

Long dollar is the most crowded trade according to the survey, with 32 percent of the investors polled anticipating further strength in the greenback.

er-11-19-7

SNB $US reserves

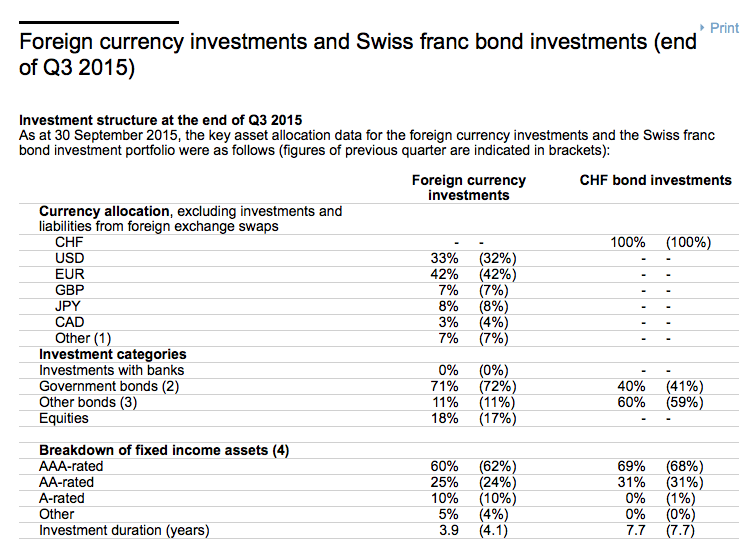
Note the ‘currency allocation’ of 33% to $US.

The SNB was buying euro and selling swiss francs to keep the franc from strengthening beyond 1.20 vs euro. To then get the $US exposure, they would have to sell some of their euro to buy $US.

So that means, on average, that for euro sold to buy swiss francs, 33% of those euro were then sold for $US.

So agents ‘fleeing the euro’ by buying swiss francs were in fact partially selling their euro to buy $US, with the SNB their ‘agent’.

It’s just one of the channels for portfolio selling of euro that’s been driving down the euro. Meanwhile, this type of driving down the euro supports the euro area trade surplus which is increasingly ‘draining’ euro from global markets, leaving the sellers of euro ‘short’ and ‘under allocated’ with, collectively, no way to get back their euro (financial assets).

Also, in case, the SNB never has to sell it’s $ or euro, as it can hold them indefinitely and let its currency float. That could trigger a weakening of the swiss franc vs the euro should holders of swiss francs someday want to sell them to get their euro back, which is likely since most likely ultimately have euro liabilities to fund:

snb

Employment chart, China trade, SNB

The red line tends to drag down the blue line, often when deficit spending gets too low:
er-11-9-1

er-11-9-2

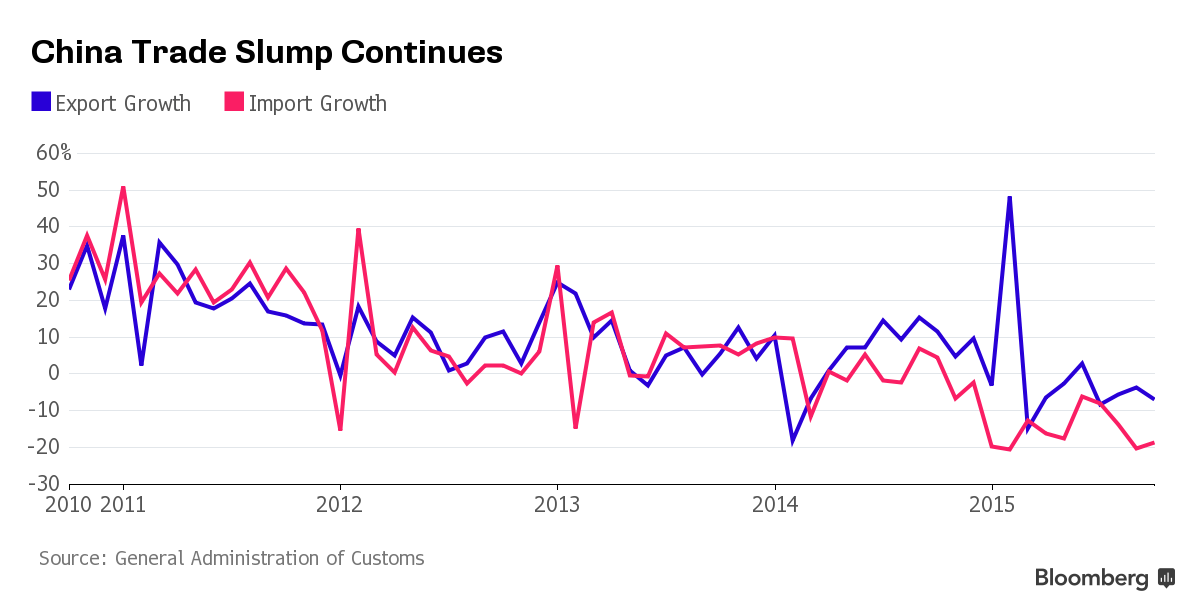
Exports drop again, imports drop more, so the trade surplus grows, and the US should see more imports and fewer exports, while euro zone imports are down which adds to their trade surplus:

China’s Trade Drop Means More Stimulus Measures Are Coming

Exports drop for a fourth month, import declines match record

Trade surplus to help ease currency depreciation pressure

China’s exports fell for a fourth straight month and imports matched a record stretch of declines, signaling that the mounting drag from slower global growth will push policy makers toward expanding stimulus.

Overseas shipments dropped 6.9 percent in October in dollar terms, the customs administration said Sunday, a bigger decline than estimated by all 31 economists in a Bloomberg survey. Weaker demand for coal, iron and other commodities for China’s declining heavy industries helped drag imports down 18.8 percent in dollar terms, leaving a record trade surplus of $61.6 billion.
er-11-9-3
Fiscal stimulus this year includes more infrastructure spending and expanding the lending capacity for the China Development Bank and other policy banks. The PBOC has also made repeated reductions to the amount of reserves required of lenders.

Exports to Japan slumped 9 percent in the first 10 months from a year earlier, while those to the European Union declined 3.7 percent. Shipments to Hong Kong dropped 11.7 percent during the same period.

Slowing Growth

Exports to the U.S., China’s largest trading partner, jumped 5.8 percent in the first 10 months from a year earlier, while those to the Association of Southeast Asian Nations increased 4.2 percent. Shipments to India rose 8.9 percent.

Imports from all 10 of the major trade partners listed by the customs administration declined in the first 10 months. Imports from Australia, a major source of China’s iron ore during the real estate boom, plunged 25.7 percent.

The record trade surplus helped spur a surprise increase in foreign-exchange reserves in October despite an erosion of holdings after the PBOC intervened to boost the yuan. The central bank’s stockpile rose to $3.53 trillion last month from $3.51 trillion at the end of September, the PBOC said Saturday.

“The large trade surplus could offset capital outflow” and curb expectations for the yuan’s depreciation, Liu Ligang, chief Greater China economist at Australia & New Zealand Banking Group Ltd. in Hong Kong, wrote in a note.

Looks like the Swiss National Bank, with about 550 billion in reserves in its portfolio obtained selling it’s currency for euro to hold the peg, may have been selling some of those euro to buy $ to buy US stocks:

SNB’s Stake in Apple, Microsoft, Exxon Rose in Third Quarter

By Catherine Bosley

Nov 4 (Bloomberg) — The Swiss National Bank owned more shares of Apple Inc., Microsoft Corp. and Exxon Mobil Corp. in the third

quarter, taking its U.S. equity portfolio to $38.95 billion.

Switzerland’s central bank held 10.3 million shares in the iPhone maker on Sept. 30, according to a regulatory filing made to the U.S. Securities and Exchange Commission and published on Wednesday. That compares with 9.4 million shares at the end of June, an increase of nearly 10 percent.

The SNB’s stake in Exxon rose by a similar extent, while in Microsoft it registered an increase of just over 9 percent.

Crude Oil, Euro, Opec Spending Cuts

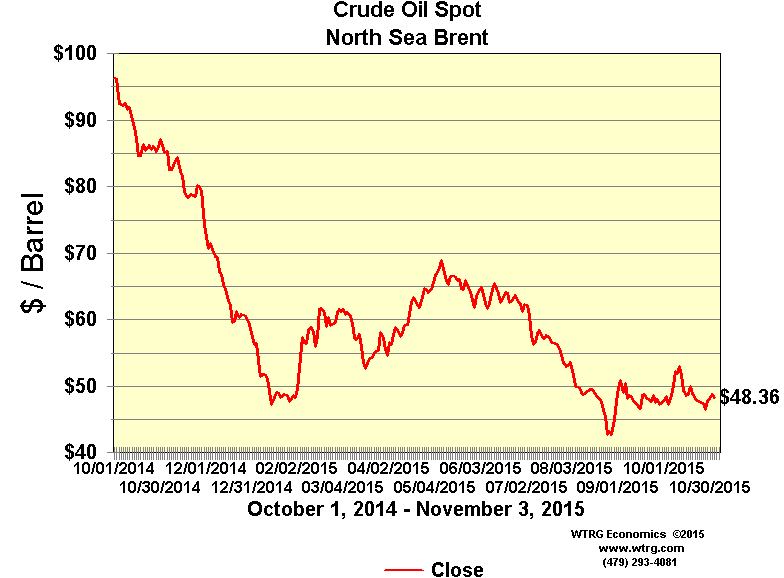
So when the Saudis widened their discounts on October 5 it looked to me like they were inducing a downward price spiral that would continue until either they altered pricing or their output increased to full capacity so they couldn’t sell any more at those discounts. So far neither has happened:
er-11-4-1

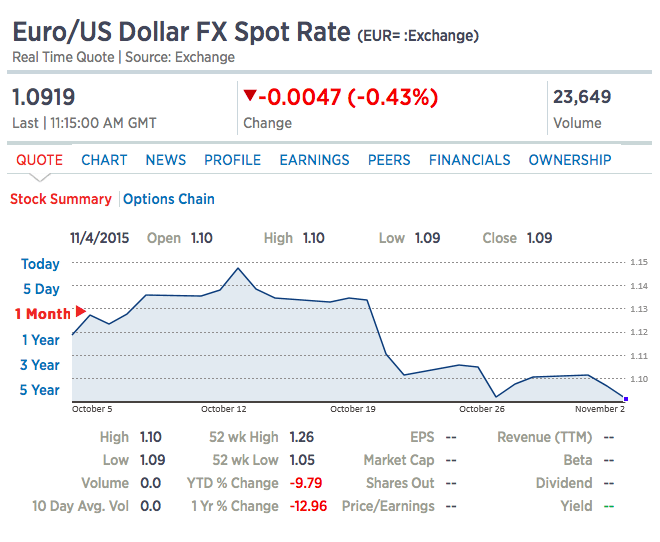
Fundamentally the euro also looks very strong to me, with a large and rising trade surplus vs a rising trade deficit for the US, and negative rates and QE ultimately further remove euro income from the economy likewise fundamentally making it stronger, while higher rates ultimately do the reverse. And deflation *is* a stronger currency, and inflation *is* a weaker currency. Yet the euro has most recently been moving lower on threats from Draghi of lower rates and more QE. So portfolio type selling, until exhausted, continues to dominate even as the fundamentals continue to improve. And there is only one portfolio that can sell indefinitely, and that’s the ECB. And I’ve been assured by all I’ve spoken to that the ECB is not selling euro:
er-11-4-2
It’s not just OPEC, but most entities with oil related income seem to have only partially cut back on spending as prices collapsed, perhaps ‘betting’ on a price recovery. This includes US states with oil and gas revenues, oil companies, and individuals collecting royalty checks. So seems there’s lots more to go:
OPEC Moves to Rein in Costs Amid Oil Price Slump

By Benoit Faucon

Nov 3 (WSJ) — The Organization of the Petroleum Exporting Countries is moving to rein in costs as its members struggle to pay their dues amid a protracted period of low oil prices, OPEC officials said. The producers’ group has delayed new hires, reduced training sessions for staff and scaled back travel. Staff-level OPEC officials are meeting this week in Vienna to discuss adjusting spending at the secretariat, the organization’s central body, officials said. Other topics over three days of talks ending Wednesday include the group’s long-term strategy report, they said.

Truck tonnage, Philly Fed Coincident Index, ECB policy, Credit Check

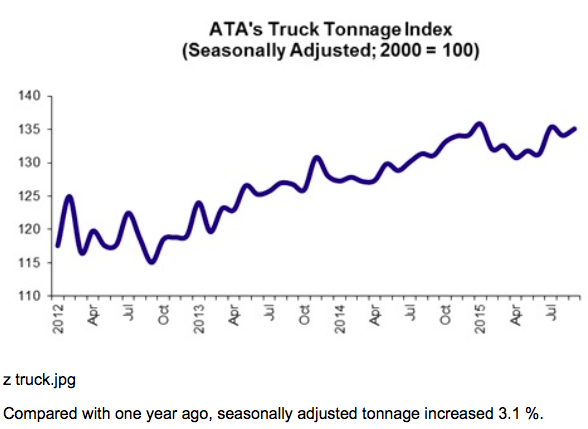
Signs of stabilizing:
er-10-25-1
er-10-25-2

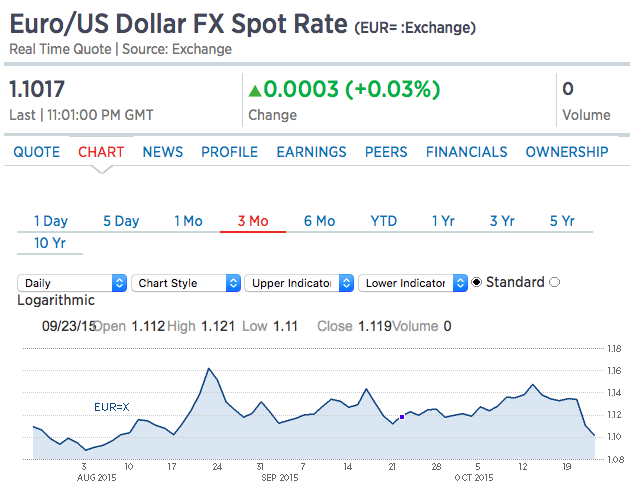
So the ECB threatened more negative rates and QE, both placebos at best, analogous to spraying the crowd with a barrage of blanks, which nonetheless dispersed the crowd. However, with the record and growing euro area 31 billion trade surplus last month and a growing US trade deficit augmented by increased petro imports as domestic production falls, I expect those fundamentals to dominate:
er-10-25-3

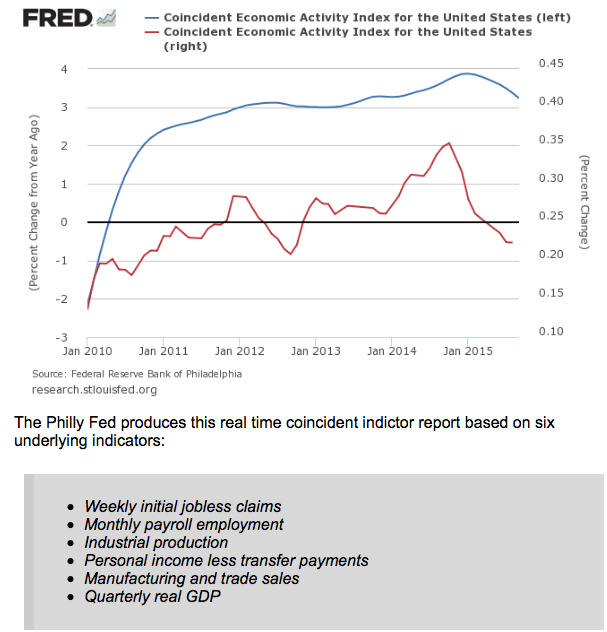
Interesting how growth that supported GDP in 2014 peaked as oil price broke down:
er-10-25-4
This new indicator now shows 2 weeks flattening, but not enough history to make a call based on it:
er-10-25-5
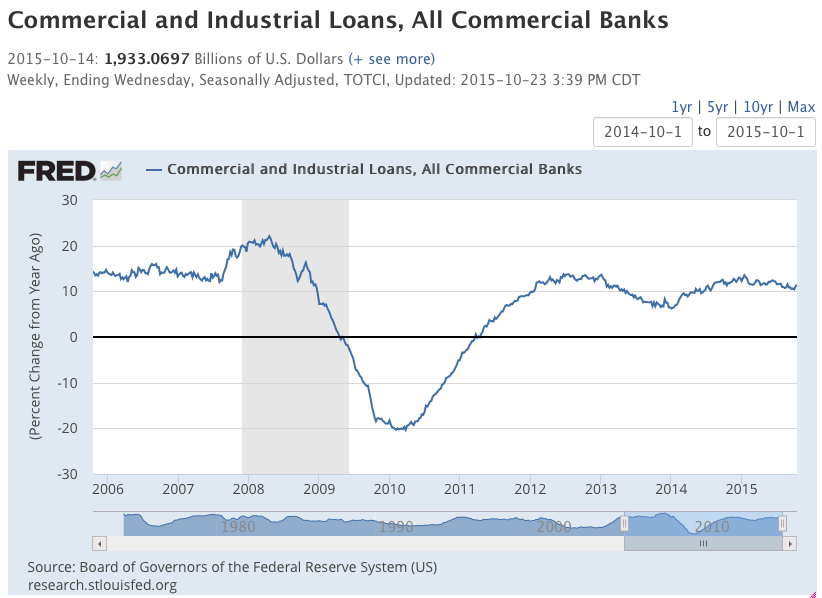
This, too, changed slope after oil supported growth reversed:
er-10-25-6
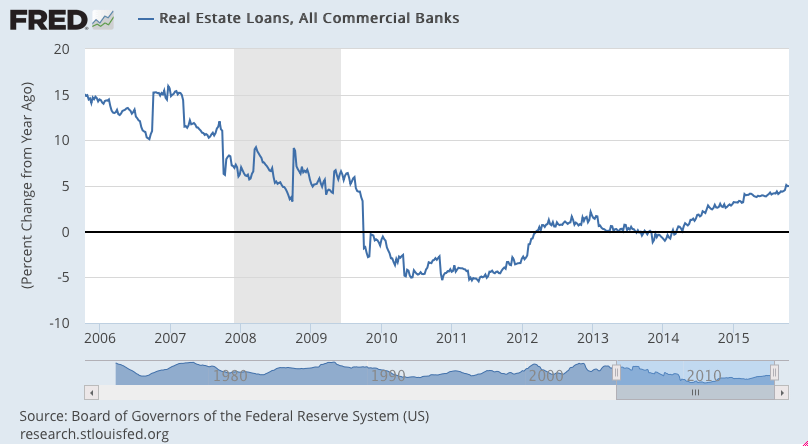
The growth rate remains historically very low (particularly given the ultra low rates?). Some of the increase is due to the drop in ‘all cash’ purchases, some due to the higher sales prices, etc.
er-10-25-7

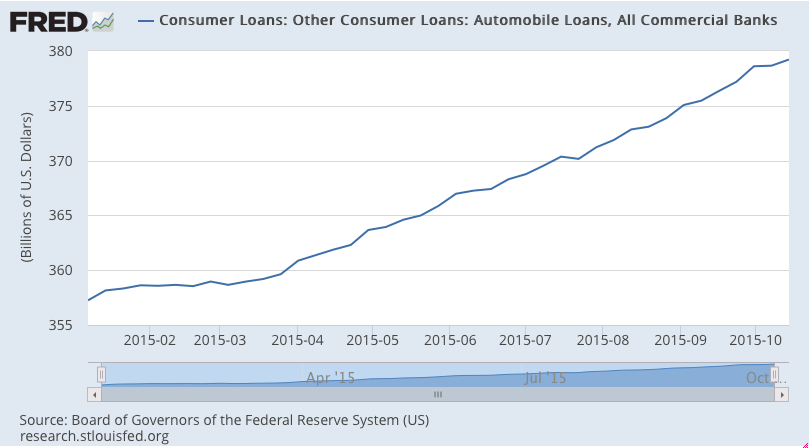
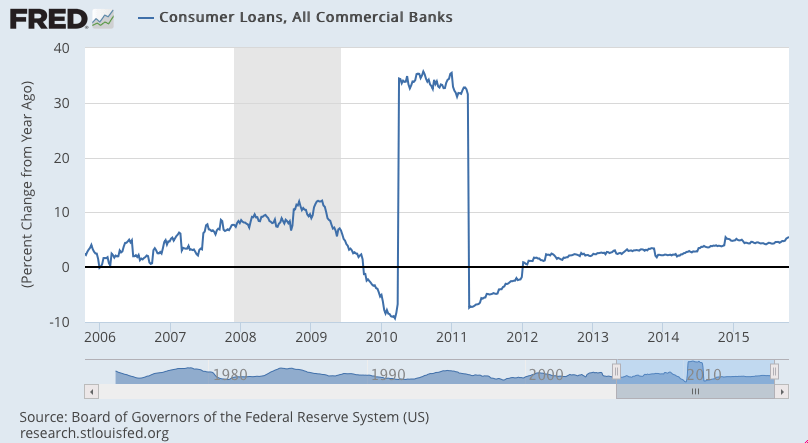
The growth rate has picked up some as it tends to do when entering a recession and consumers borrow extra for a while as incomes are stretched before breaking:
er-10-25-8

Euro Trade Surplus, Euro Inflation

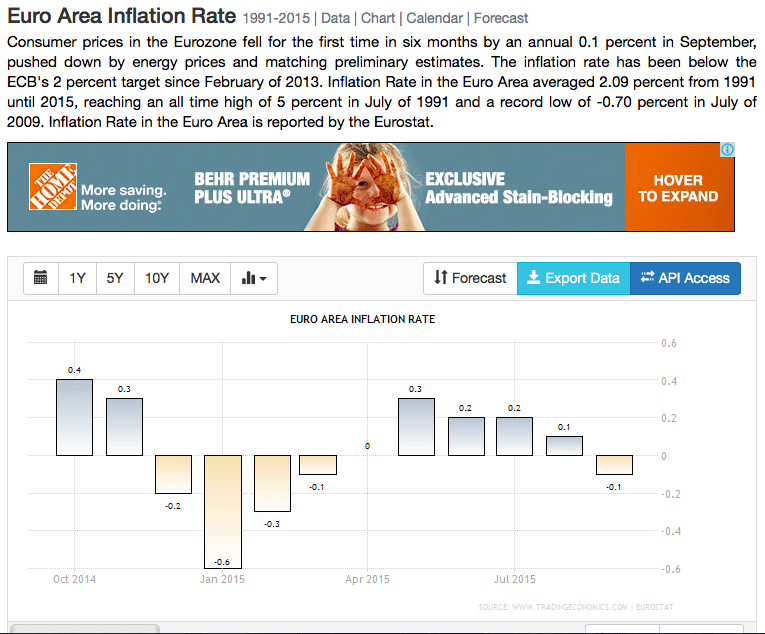
Trade surplus still trending higher along with deflation both make the euro ‘harder to get’ and ‘more valuable’:

European Union : Merchandise Trade
er-10-16-1
Highlights
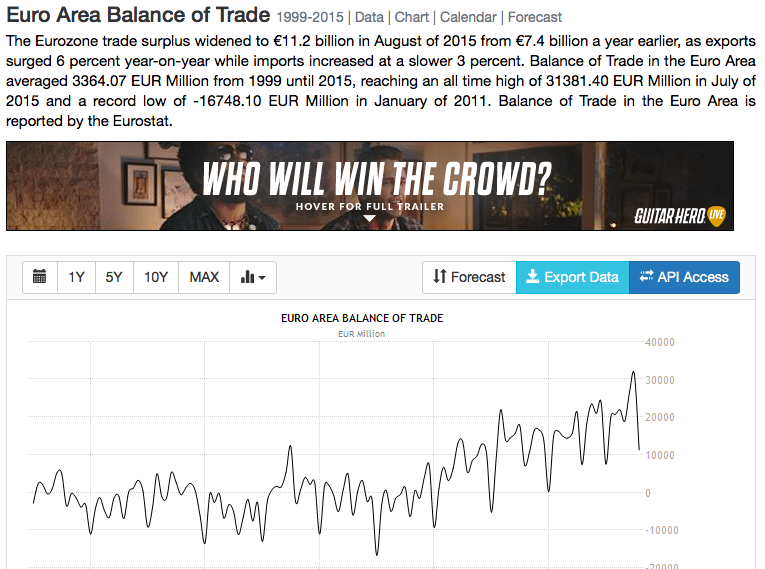
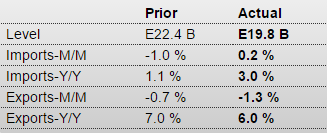
The seasonally adjusted merchandise trade balance returned a E19.8 billion surplus in August after an unrevised E22.4 billion excess in July. This was the least black ink since March. The unadjusted surplus was E11.2 billion, up from E7.4 billion in August 2014.

The headline reduction reflected mainly a 1.3 percent monthly fall in exports to E169.5 billion, their second successive decline and their lowest level since February. Imports were up 0.2 percent at E149.7 billion, only partially reversing July’s fall. Compared with a year ago, exports now show an unadjusted gain of 6.0 percent and imports a rise of 3.0 percent.

The average surplus in July/August was E21.1B, a drop of only 1.4 percent from the second quarter average. This is probably indicative of, at best, a much smaller contribution from total net exports to third quarter real GDP growth than the 0.3 percentage point boost provided in April-June. Further reason for being cautious about the speed of the Eurozone’s economic recovery.
er-10-16-2
er-10-16-3
er-10-16-4