payrolls

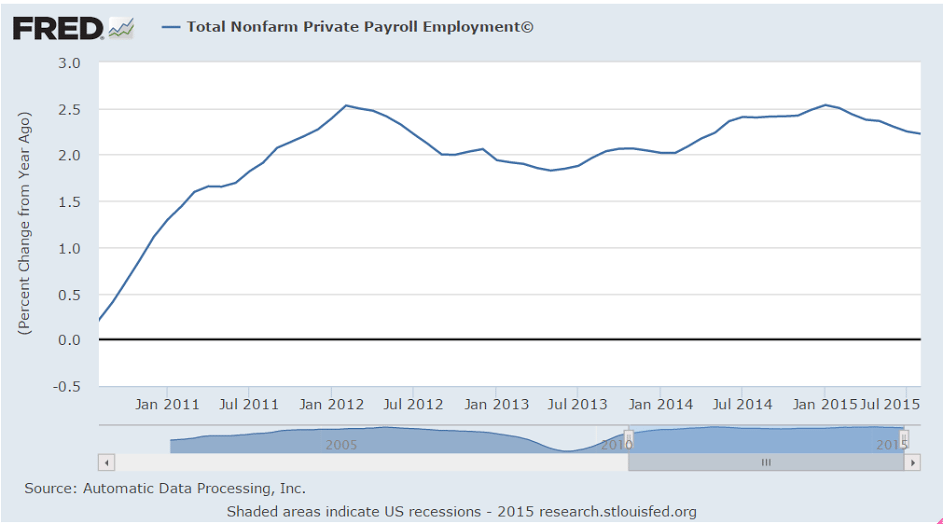
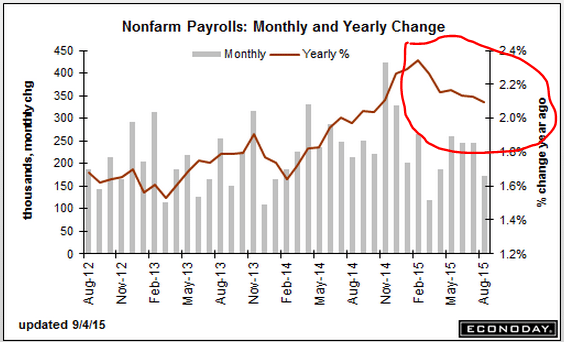
First, note that the year over year growth rate has been decelerating since the oil price collapse:
er-9-5-1
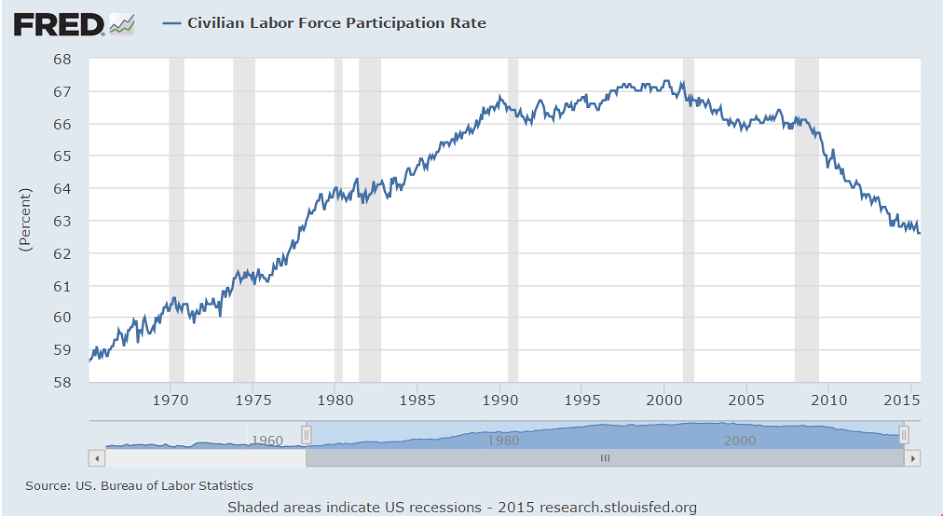
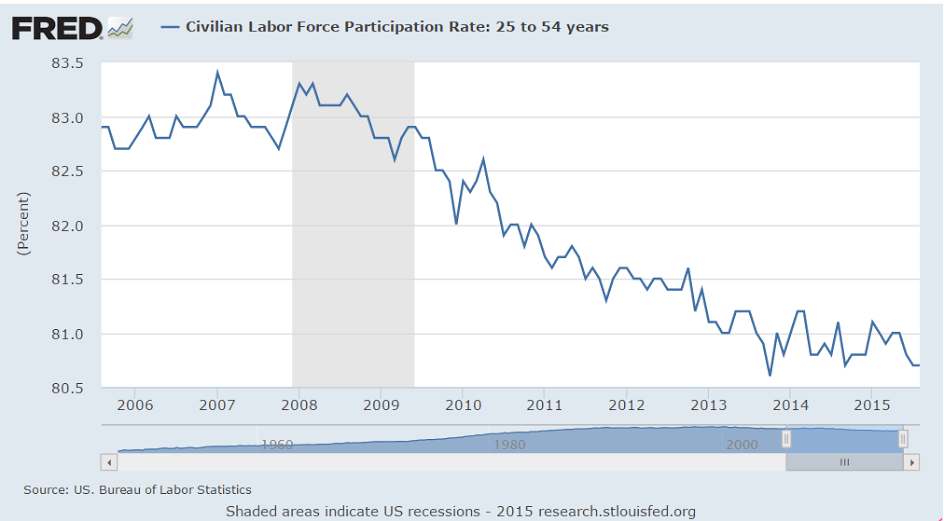
And that for all practical purposes the decline in the unemployment rate is due to the decline in the labor force participation rate, which is unique to this cycle and to me entirely due to a lack of aggregate demand (sales):
er-9-5-2
No demographics here, just plain weakness:
er-9-5-3
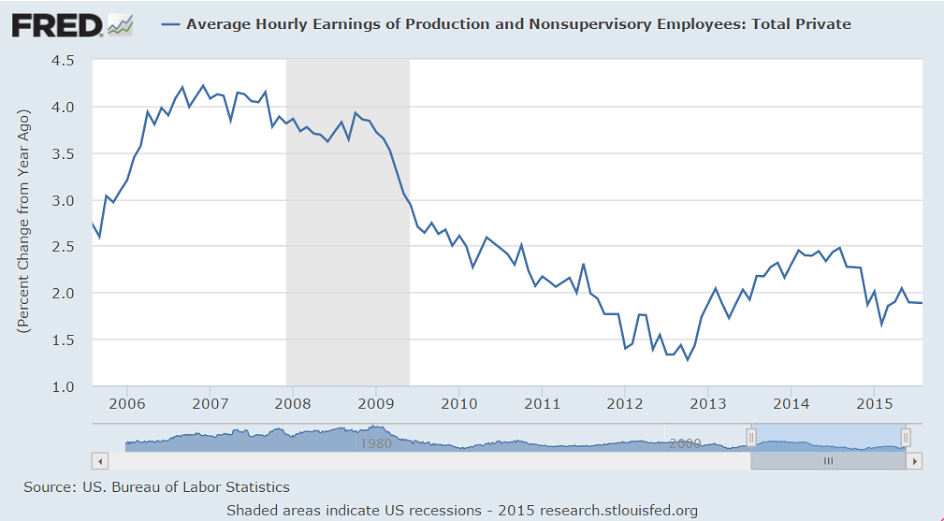
This remains depressed, and is not adjusted for inflation, also indicating the same lack of aggregate demand:
er-9-5-4
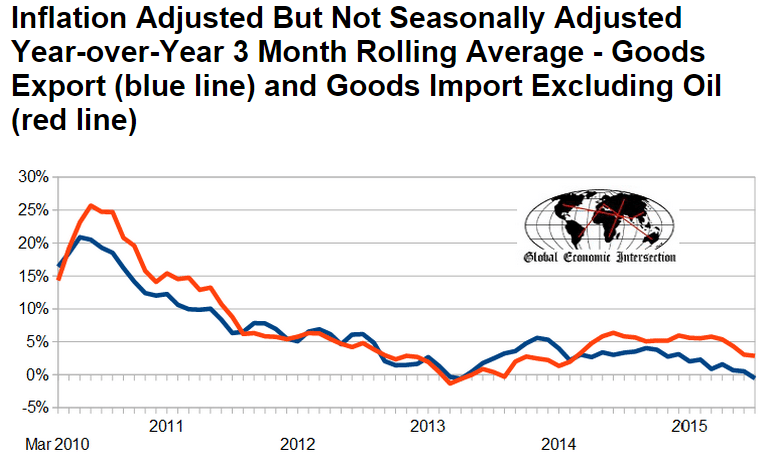
Again, note the reference to weak exports, which leads me to expect either prior export reports to be revised lower or new releases to gap down.

And the decline of the growth of private payrolls since the oil price collapse speaks to the underlying economic strength as well:

Employment Situation
er-9-5-5
Highlights
The headline may not look it but there’s plenty of strength in the August employment report. Nonfarm payrolls rose only 173,000 which is at the low-end estimate, but the two prior months are now revised up a total of 44,000. The unemployment rate fell 2 tenths to 5.1 percent which is below the low end estimate and the lowest of the recovery, since April 2008. And wages are strong, with average hourly earnings up 0.3 percent for a 2.2 percent year-on-year rate that’s 1 tenth higher than July. Debate will definitely be lively at the September 17 FOMC!

Private payroll growth proved very weak, at only 140,000. Government added 33,000 jobs vs July’s 21,000. Manufacturing, held back by weak exports and trouble in energy equipment, shed a steep 17,000 jobs followed by a 9,000 loss for mining which is getting hit by low commodity prices. A plus is a 33,000 rise in professional & business services and a respectable 11,000 rise in the temporary help subcomponent. This subcomponent is considered a leading indicator for long-term labor demand. Retail rose 11,000 with vehicle dealers, who have been very busy, adding 2,000 jobs following July’s gain of 11,000.

The participation rate remains low, unchanged at 62.6 percent. Other details include a 1 tenth downtick in the broadly defined U-6 unemployment rate to 10.3 percent. The workweek rose to 34.6 from 34.5 hours.

Seasonality, especially the timing of the beginning of the school year, always plays an outsized role in August employment data which are often revised higher. Policy makers are certain to take this into consideration at this month’s FOMC. There’s something for everybody in this report which won’t likely settle expectations whether the Fed lifts off or not this month.
er-9-5-6

So is this the ‘some improvement’ the Fed is looking for before hiking? ;)

Nor is there any (floating exchange rate) theory or evidence that any of this is a function of rates the way the Fed acts as if it is. But that’s another story…

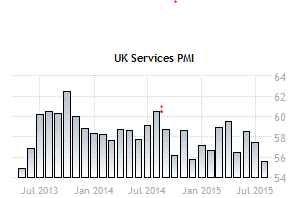
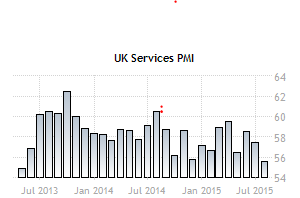
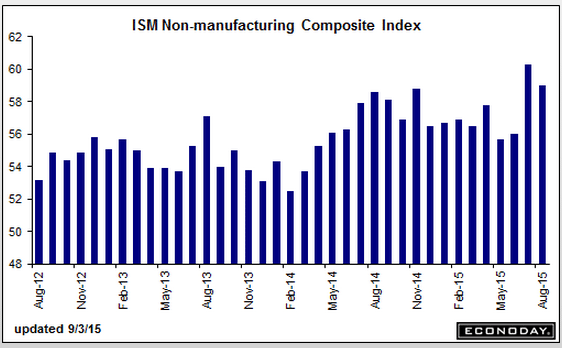
France PMI, Germany PMI, EU PMI, EU Retail Sales, UK service PMI, US Trade, ISM Non Manufacturing, Saudi Pricing

France : PMI Composite
er-9-4-1
Highlights
French private sector activity in August expanded at a significantly slower pace than indicated in the flash report according to the final PMI data for the month. At just 50.2, a 7-month low, the key composite output index was revised down an unusually large 1.1 points versus its preliminary reading to stand 1.3 points below its final July mark and close enough to 50 to signal a period of virtual stagnation in economic activity.

The flash service sector PMI was reduced by 1.2 points to 50.6, also a 7-month trough. As previously indicated, what growth there was reflected stronger new orders and rising backlogs although the growth rate of both hit multi-month lows. Certainly firms were not confident enough to add to headcount although, rather surprisingly, business expectations still climbed to their highest level since March 2012.

Meantime, another increase in input costs saw margins squeezed still further as service provider charges continued to fall.

The final PMI figures suggest that the French economy was really struggling last month. Total output was only flat in the April-June period and the survey data so far suggest little better this quarter.

Germany : PMI Composite
er-9-4-2
Highlights
August’s flash composite output index was revised up a full point to 55.0 in the final data for the month. The new level was 1.3 points above July’s final reading, a 5-month high and strong enough to indicate a solid performance by the economy in mid-quarter.

The adjustment to the composite output gauge came courtesy of the service sector for which the preliminary PMI was revised some 1.3 points firmer to 54.9, also its best reading in five months. New orders rose strongly, backlogs were up and employment posted its largest gain since February. Against this backdrop, business expectations for the year ahead climbed to a 4-month peak.

What little progress they continue to make will evaporate with a strong euro, which I see as inevitable given their trade surplus:

European Union : PMI Composite
er-9-4-3
Highlights
The final composite output index for August weighed in at 54.3, a couple of ticks stronger than its flash estimate and 0.4 points above its final July mark.

The flash services PMI was nudged just 0.1 points higher but, at 54.4, now matches June’s 4-year high. Increased output was supported by rising new orders and a sizeable increase in backlogs which, in turn, helped to ensure that employment growth remained respectably buoyant. Firms also became more optimistic about the economic outlook and business expectations for the year ahead climbed higher following July’s 7-month low. Meantime, inflation developments were mixed. Hence, although higher wages and salaries prompted another rise in input costs, margins were squeezed further as service provider charges declined for a remarkable forty-fifth consecutive month.

Regionally, the best performer in terms of the composite output measure was Ireland (59.7) ahead of Spain (58.8) and Italy (55.0 and a 53-month high). Germany (55.0) also had a good month but France (50.2 and a 7-month low) all but stagnated and remains a real problem for Eurozone economic growth.

The final PMI figures suggest that the Eurozone economy is on course for something close to a 0.4 percent quarterly growth rate in the current period, a slight improvement on the second quarter’s 0.3 percent rate. While this would be good news, faster rates of expansion will likely be needed if inflation is to meet the ECB’s near-2 percent target over the central bank’s 2-year policy horizon.

European Union : Retail Sales
er-9-4-4
Highlights
Retail sales were slightly weaker than expected in August but with July’s decline more than halved, annual growth of purchases still comfortably exceeded the market consensus. Volumes were 0.4 percent firmer on the month after a 0.2 percent drop in June for a workday adjusted yearly rise of 2.7 percent, up from 1.7 percent last time.

July’s monthly rebound was led by a 0.8 percent jump in purchases of auto fuel and without this, non-food sales were just 0.1 percent higher having only stagnated in June. Food recorded a 0.2 percent advance. As a result, overall sales in July were 0.3 percent above their average level in the second quarter when they also increased 0.3 percent.

Regionally the advance was dominated by a 1.4 percent monthly jump in Germany. Spain (0.6 percent) also made a positive contribution but France (minus 0.2 percent) saw its first decline since March. Elsewhere, there were solid gains in Estonia (2.5 percent), Malta and Portugal (both 1.1 percent) but Slovakia (minus 0.2 percent) struggled.

Growth of retail sales has slowed in recent months, in keeping with signs that consumer confidence may have peaked, at least for now. According to the latest EU Commission survey, household morale improved slightly in August but still registered its second weakest reading since January. Consumption may continue to rise over coming months but the signs are that its contribution to real GDP growth will be only limited.
er-9-4-5

I’ve been suggesting exports would slow more than what’s been reported so far, though year over year numbers are in decline. It may show up in revisions down the road:
er-9-4-6

er-9-4-7

International Trade
er-9-4-9

Highlights
The nation’s trade gap narrowed to a nearly as expected $41.9 billion in July following an upward revised gap of $45.2 billion in June (initially $43.8 billion). The improvement reflects a monthly rise of 0.4 percent in exports, which were led by autos, and a 1.1 percent contraction in imports that reflected a decline in pharmaceutical preparations and cell phones which helped offset a monthly rise in imports of oil where prices were higher in July.

Aside from autos, exports of industrial supplies, specifically nonmonetary gold, were strong in July while exports of capital goods also expanded. This helped offset a monthly decline in exports of civilian aircraft and consumer goods. Turning again to imports, other details include a rise in capital goods in what is the latest sign of life for business investment.

By nation, the gap with China widened slightly, to an unadjusted $31.6 billion in the month, while the gap with the EU widened more substantially to $15.2 billion, again unadjusted which makes month-to-month conclusions difficult. Gaps with Mexico and Canada both narrowed.

This report is another positive start to the quarter and will lift early third-quarter GDP estimates. But these will be cautious estimates as recent market turbulence pushes back conclusions and will make August’s trade data especially revealing.

Lower but still indicating ok expansion:
er-9-4-1

Saudi price setting adjustment:

Aramco Cuts All October Crude Pricing to U.S., Northwest Europe

By Anthony DiPaola

Sept 3 (Bloomberg) — Saudi Arabia, the world’s largest crude exporter, cut pricing for all October oil sales to the U.S. and Northwest Europe and reduced the premium on its main Light grade to Asia by 30 cents a barrel.

State-owned Saudi Arabian Oil Co. cut its official selling price for October sales to Asia of Arab Light crude to 10 cents a barrel more than the regional benchmark, the company said in an e-mailed statement. The discount for Medium grade crude for buyers in Asia widened 50 cents to $1.30 a barrel less than the benchmark.

Brent, a global oil benchmark, fell almost 50 percent last year as Saudi Arabia and other OPEC members chose to protect market share over cutting output to boost prices. Brent fell from over $100 a barrel in July 2014 to less than half that six months later. It traded at about $50 on Thursday.

The Organization of Petroleum Exporting Countries led by Saudi Arabia decided on June 5 to keep its production target unchanged to force higher-cost producers such as U.S. shale companies to cut back. The producer group has exceeded its target of 30 million barrels a day since May 2014.

Saudi Arabia reduced production in August to 10.5 million barrels a day, the first decline this year, according to data compiled by Bloomberg.

PMI’s, Saudi pricing, Redbook, ISM, Construction Spending

Saudi Arabia to Cut Oil Premium to Asia Buyers for Oct.: Survey

By Serene Cheong and Sharon Cho

(Bloomberg) — World’s biggest crude exporter may reduce premium by 20c/bbl for Oct. sales of Arab Light grade to Asia, accord. to median est. in Bloomberg survey of 7 refiners and traders.

Oct. Arab Light official selling price est. at 20c/bbl above Oman-Dubai bmark vs 40c premium for Sept.

Sept. OSP was raised by 50c vs increase of 70c estd. in Bloomberg survey

Fcasts from 7 participants range from no change to 30c less than OSP for Sept.

Redbook
er-9-1-9
er-9-1-10

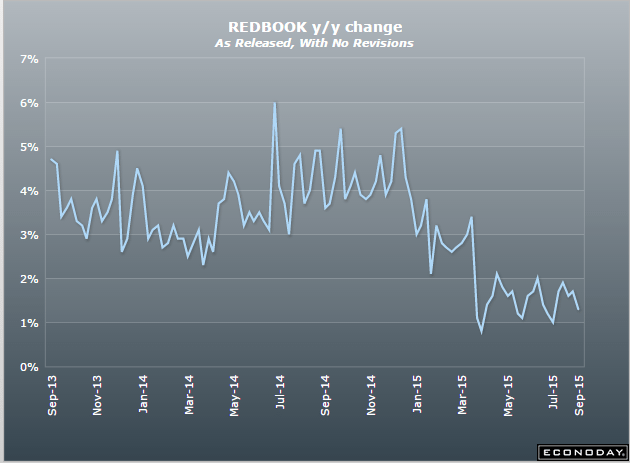
Still trending lower:

ISM Mfg Index
er-9-1-12
Highlights
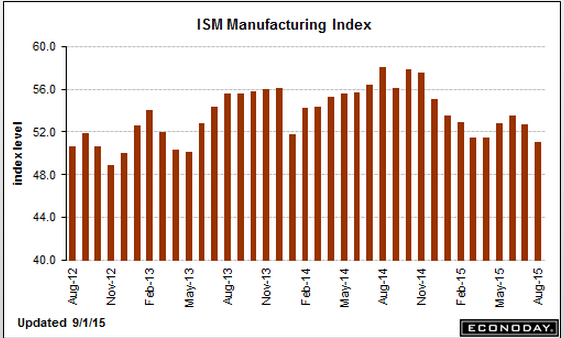
The ISM index, at a lower-than-expected 51.1, is signaling the slowest rate of growth for the factory sector since May 2013. And the key details are uniformly weak.

New orders, at 51.7, are at one of the slowest rates of monthly growth of the recovery, since April 2013. Backlog orders, at 46.5, are in a third month of contraction. New export orders, at 46.5, are also in their third straight month of contraction and are at the lowest rate since July 2012.

ISM’s sample wasn’t hiring much in August, at 51.2 for a 1.5 point decline from July and the weakest reading since April. Production slowed and prices paid, at only a 39.0 level last since in March, points to deflationary pressures.

The good news for the economy is that this report failed to pick up the auto-led surge that lifted the factory sector noticeably in June and July. Still, the ISM is followed closely and will raise doubts, justifiably or not, over a September 17 rate hike.
er-9-1-13

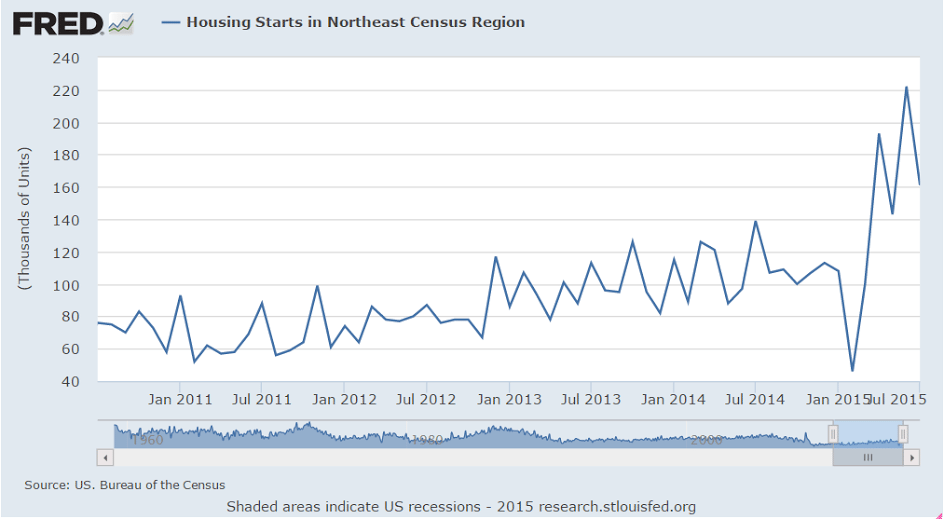
Still climbing but note that multifamily is falling off since the NY tax breaks expired:

Construction Spending
er-9-1-14
Highlights
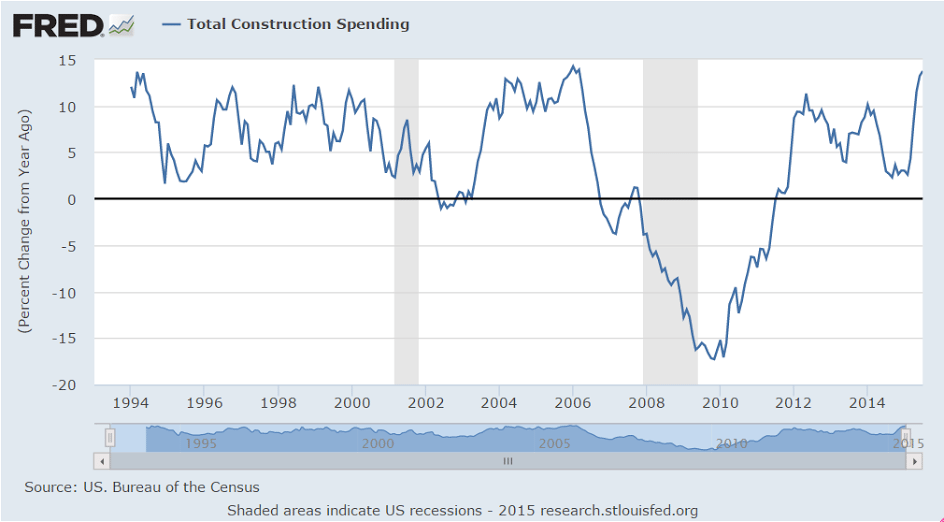
Led by strength in single-family homes, construction spending rose 0.7 percent in July while an upward revision to single-family homes added to a sharp upward revision to June, up 6 tenths and also at plus 0.7 percent. Year-on-year, total construction spending was up 13.7 percent in July.

Private residential construction rose 1.3 percent in July with construction spending on single-family homes up 2.1 percent vs a 0.5 percent gain in June that was initially reported at a 0.3 percent contraction. Spending on the more volatile multi-family category, which is much smaller in scale, fell 2.2 percent after spiking 5.5 percent in June. Year-on-year, both categories show robust gains, at 15.8 percent for single-family homes and 21.2 percent for multi-family.

Turning to private nonresidential construction, spending rose 1.5 percent in the month. In gains that belie concerns over weakness in business investment, manufacturing was very strong at plus 4.7 with power and transportation both at plus 2.1 percent in the month. But spending on public construction was negative, at minus 3.0 percent for educational buildings and minus 0.2 percent for highways & streets.

Housing and construction, which are domestic sectors insulated for global volatility, are posting some of the best numbers of any sectors in the economy right now and look to give 2015 substantial support.

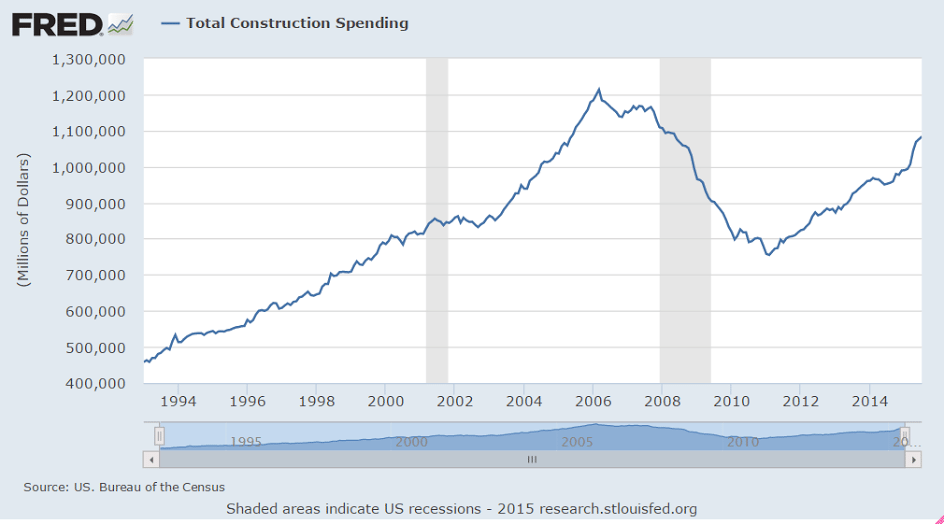
These numbers aren’t inflation adjusted, so you can see real construction is still far below prior levels:
er-9-1-15
The last spike correlates with the NY tax break that ended June 15, so it may be in the process of reversing:
er-9-1-16

er-9-1-17

er-9-1-18

Personal Income and Outlays, Consumer Sentiment, Japan Household Spending, China Profits

Everything pretty much as expected and the same, helped by vehicle sales which are both volatile and leveling off:

United States : Personal Income and Outlays
er-8-28-1
Highlights
There’s no hurry for a rate hike based on the July personal income and outlays report where inflation readings are very quiet. Core PCE prices rose only 0.1 percent in the month with the year-on-year rate moving backwards, not forwards, to a very quiet plus 1.2 percent. Total prices are also quiet, also at plus 0.1 percent for the monthly rate and at only plus 0.3 percent the yearly rate.

On the consumer, the data are very solid led by a 0.4 percent rise in income that includes a 0.5 percent rise in wages & salaries which is the largest since November last year. Other income details, led by transfer receipts, also gained in the month. Spending rose 0.3 percent led by a 1.1 gain in durables that’s tied to vehicle sales. The savings rate is also healthy, up 2 tenths to 4.9 percent.

The growth side of this report is very favorable and marks a good beginning for the third quarter. This at the same time that inflation pressures remain stubbornly dormant. And remember this report next month will reflect the August downturn in fuel prices. With the core PCE index out of the way, next week’s August employment report looks to be the last big question mark going into the September 17 FOMC.

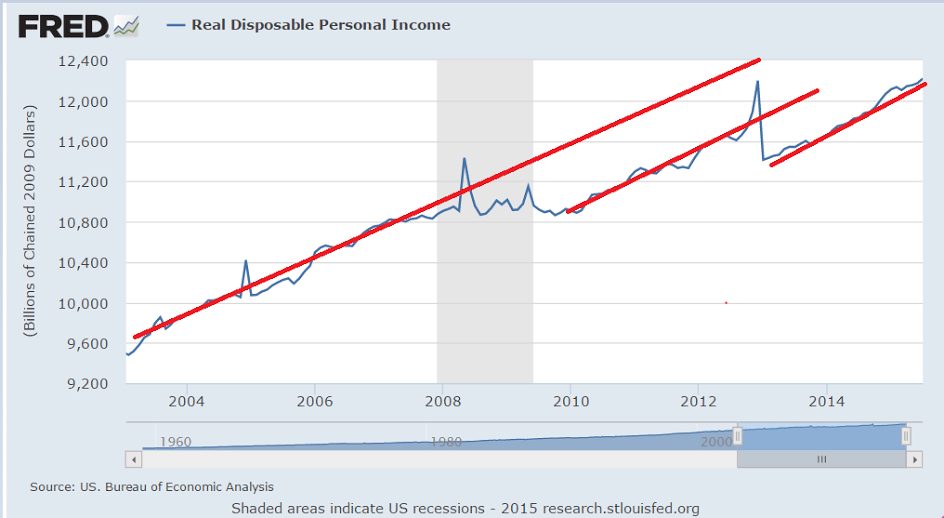
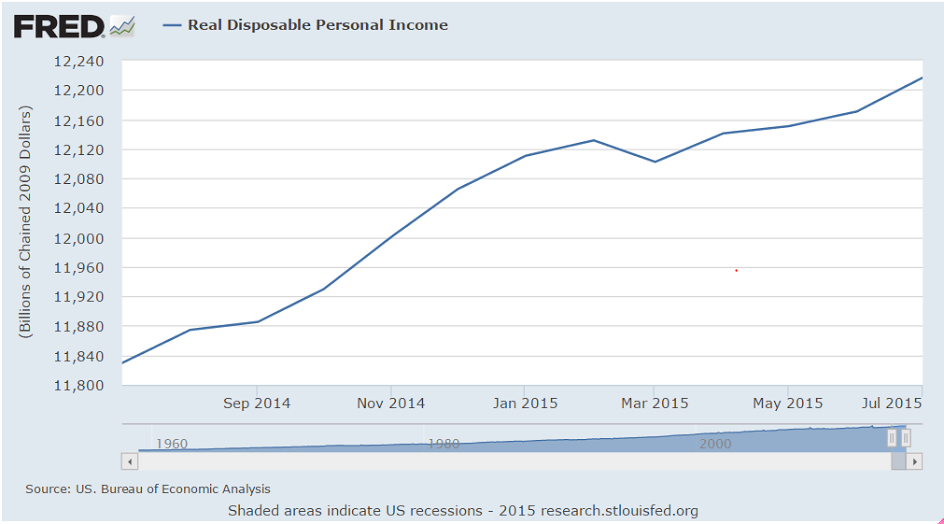
First the recession then the tax hikes and sequesters ratchet down after tax income, and the growth rate is both low and never enough to ‘catch up’:
er-8-28-2
And over the last year you can see how the drop in oil capex after the price fell did the same thing though on a smaller scale, at least so far:
er-8-28-3

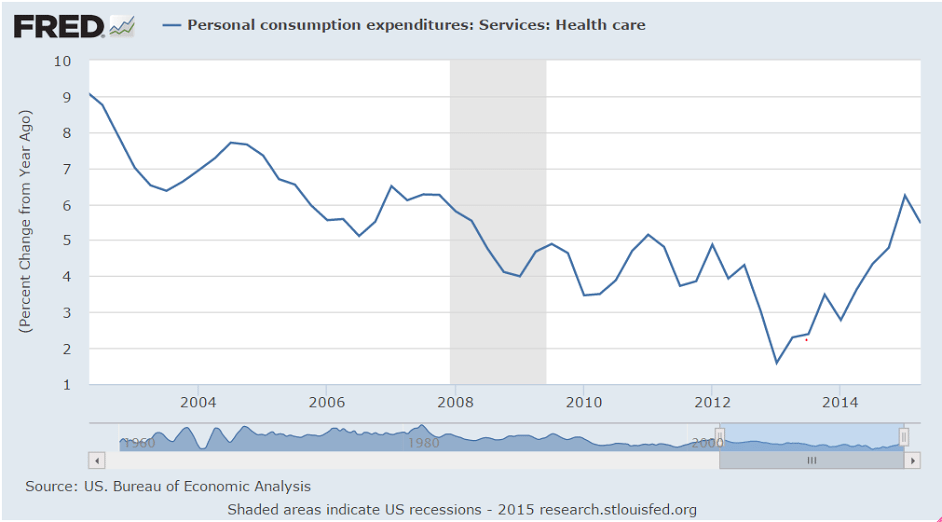
This is further decelerating from already weak numbers, not to forget health care premiums count as consumption expenditures, with a one time adjustment in progress as previously uninsured people become insured and begin paying premiums:
er-8-28-4

This is a quarterly number updated yesterday. The ‘one time’ increase may be cresting:
er-8-28-5
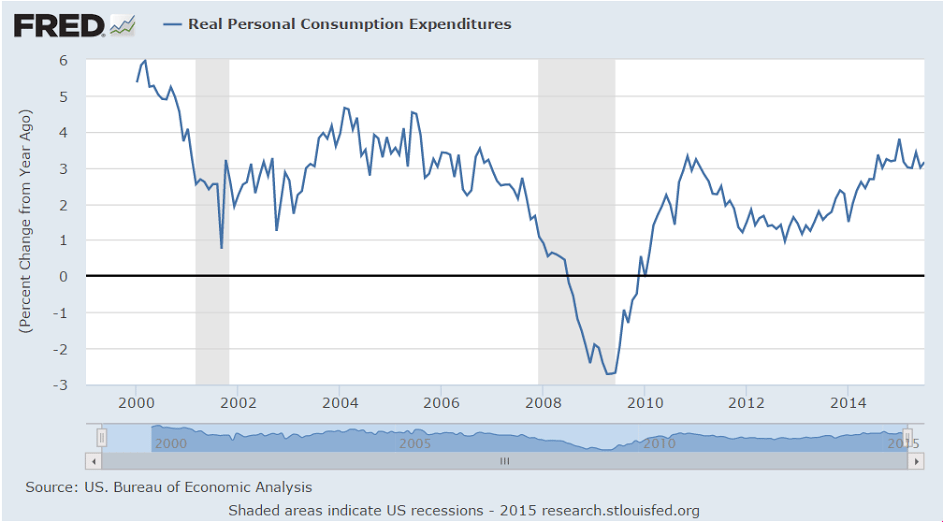
Starting to decelerate, even with low gas prices:
er-8-28-6

Japan : Household Spending
er-8-28-7

China’s industrial profits fell faster in July

Aug 28 (Xinhua) — Profits of China’s major industrial firms fell 2.9 percent year on year in July, sharply down from the 0.3-percent decline posted in June. The NBS attributed the poor performance to weak domestic demand and a continuous fall in factory gate prices, which have suffered 41 consecutive months of declines. Profits at industrial companies with annual revenues of more than 20 million yuan (about 3.1 million U.S. dollars) totaled 471.6 billion yuan in July. During the first seven months, industrial profits dropped one percent from a year earlier, compared with a fall of 0.7 percent registered in the first half of the year, the NBS said.

Redbook retail sales, Inflation adjustment, China, House prices, Consumer confidence

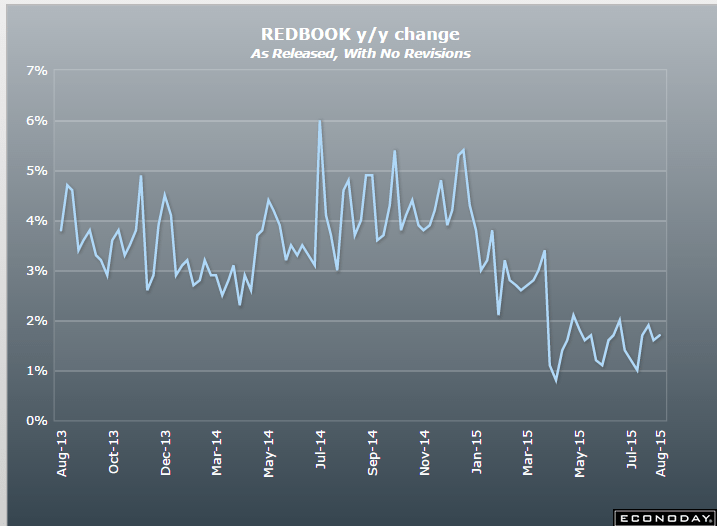
Still depressed
er-8-25-1
Lower than the Fed thought:

U.S. inflation probably lower than reported, Fed study says

Aug 24 (Reuters) — U.S. inflation in the first half of the year was probably “markedly lower” than reported according to the San Francisco Federal Reserve Bank. Researchers at the regional Fed bank had earlier found that the very weak readings for economic growth in the early part of the year were likely due to inadequate adjustments for seasonal fluctuations. The same researchers applied similar methodology to inflation data and found that core PCE inflation was probably overstated by 0.3 and 0.2 percentage points in the first two quarters of the year, respectively.

This does nothing for output and employment:

China’s central bank pumps in billions to ease liquidity strain

Aug 25 (Xinhua) — The People’s Bank of China (PBOC) conducted 150 billion yuan (23.4 billion U.S. dollars) of seven-day reverse repurchase agreements (repo). The reverse repo was priced to yield 2.5 percent, unchanged from the yield on a net injection last week of 150 billion yuan using reverse repos, according to a PBOC’s statement. The PBOC also channelled another 110 billion yuan via its medium-term lending facility. Despite the cash injection the benchmark overnight Shanghai Interbank Offered Rate (Shibor) climbed by 1.3 basis points to 1.879 percent.

Not a good sign:

S&P Case-Shiller HPI
er-8-25-2
Highlights
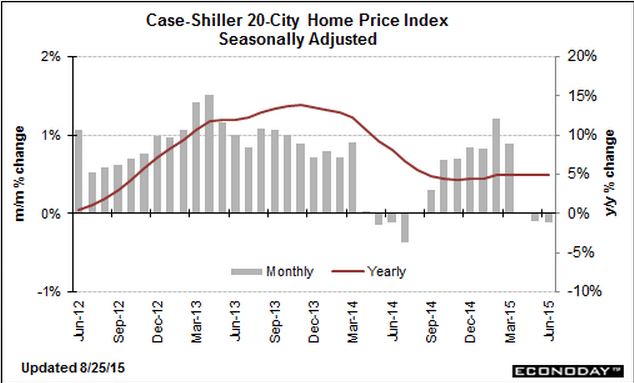
Inventories may be low and sales rates firm, but both Case-Shiller and FHFA are pointing to a surprising flat spot for home-price appreciation. Case-Shiller’s 20-city adjusted index fell 0.1 percent in June vs Econoday expectations for a 0.1 percent rise. Year-on-year, 20-city prices, whether adjusted or unadjusted, are unchanged at plus 5.0 percent. This rate has been inching higher but looks like it may be ready to fall back unless prices pick up.
er-8-25-3

A bit less than expected and still at very depressed levels:

New Home Sales
er-8-25-4

Settled back to depressed levels from last month’s blip up:

Richmond Fed Manufacturing Index
er-8-25-5

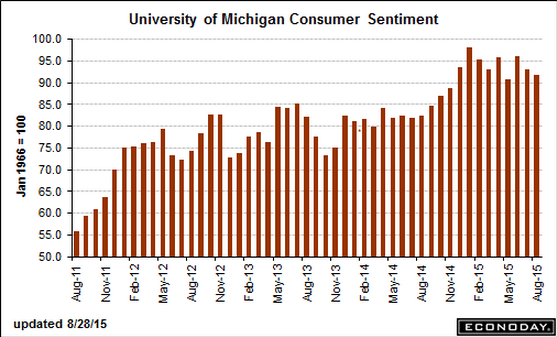
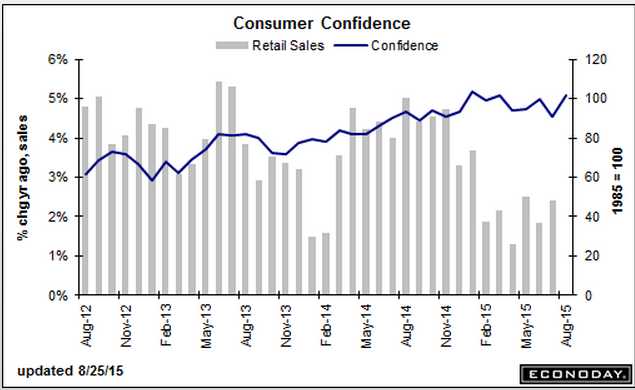
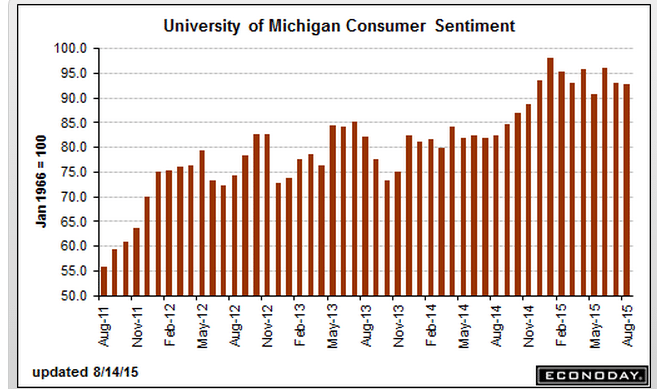
Consumer confidence bounced up with lower gas prices, as it’s one man one vote, not one dollar one vote, and so hasn’t been a reliable indicator of retail sales.
er-8-25-6

Krugman on debt

Debt Is Good

By Paul Krugman

Aug 21 (NYT) — Rand Paul said something funny the other day. No, really — although of course it wasn’t intentional. On his Twitter account he decried the irresponsibility of American fiscal policy, declaring, “The last time the United States was debt free was 1835.”


Which consequently was followed by the worst depression in US history.

Wags quickly noted that the U.S. economy has, on the whole, done pretty well these past 180 years, suggesting that having the government owe the private sector money might not be all that bad a thing. The British government, by the way, has been in debt for more than three centuries, an era spanning the Industrial Revolution, victory over Napoleon, and more.

But is the point simply that public debt isn’t as bad as legend has it? Or can government debt actually be a good thing?

Believe it or not, many economists argue that the economy needs a sufficient amount of debt out there to function well.


Yes, to offset desires to not spend income (save) when private sector borrowing to spend isn’t sufficient, as evidenced by unemployment.

And how much is sufficient? Maybe more than we currently have. That is, there’s a reasonable argument to be made that part of what ails the world economy right now is that governments aren’t deep enough in debt.


Yes, it’s called unemployment, which is the evidence that deficit spending is insufficient to offset desires to not spend income. Something economists have known by identity for at least 300 years.

I know that may sound crazy. After all, we’ve spent much of the past five or six years in a state of fiscal panic, with all the Very Serious People declaring that we must slash deficits and reduce debt now now now or we’ll turn into Greece, Greece I tell you.

But the power of the deficit scolds was always a triumph of ideology over evidence, and a growing number of genuinely serious people — most recently Narayana Kocherlakota, the departing president of the Minneapolis Fed — are making the case that we need more, not less, government debt.

Why?


This is the right answer- because the US public debt, for example, is nothing more than the dollars spent by the govt that haven’t yet been used to pay taxes. Those dollars constitute the net financial dollar assets of the global economy (net nominal savings), as actual cash, or dollar balances in bank accounts at the Federal Reserve Bank called reserve accounts and securities accounts. Functionally, it is not wrong to call these dollars the ‘monetary base’. And a growing economy that generates increasing quantities of unspent income likewise needs an increasing quantity of spending that exceeds income- private or public- for a growing output to get sold.

One answer is that issuing debt is a way to pay for useful things, and we should do more of that when the price is right.


Wrong answer. It’s never about ‘when the price is right’. It is always a political question regarding resource allocation between the public sector and private sector.

The United States suffers from obvious deficiencies in roads, rails, water systems and more; meanwhile, the federal government can borrow at historically low interest rates.


Wrong answer. Yes, there is a serious infrastructure deficiency. The right question, however, is whether the US has the available resources and whether it wants to allocate them for that purpose.

So this is a very good time to be borrowing and investing in the future, and a very bad time for what has actually happened: an unprecedented decline in public construction spending adjusted for population growth and inflation.


I agree it’s a good time to fund infrastructure investment, due to said deficiencies.

However, whether or not it’s a good time to increase deficit spending is a function of how much slack is in the economy, as evidenced by the unemployment rates, participation rates, etc. And not by infrastructure needs.

And my read based on that criteria is that it’s a good time for proactive fiscal expansion.

Nor in any case is deciding whether or not to increase deficit spending rightly about whether or not to increase borrowing per se for a government that, under close examination, from inception necessarily spends or lends first, and then borrows. As Fed insiders say, ‘you can’t do a reserve drain without first doing a reserve add.’

Beyond that, those very low interest rates are telling us something about what markets want.


Wrong, they are telling is something about what level market participants think the fed will target the Fed funds rate over time.

I’ve already mentioned that having at least some government debt outstanding helps the economy function better. How so?


Right answer- deficit spending adds income and net financial assets to the economy to support sufficient spending to get the output sold.

The answer, according to M.I.T.’s Ricardo Caballero and others, is that the debt of stable, reliable governments provides “safe assets” that help investors manage risks, make transactions easier and avoid a destructive scramble for cash.


Wrong answer. Net govt spending provides in the first instance provides dollars (tax credits) in the form of dollar deposits in reserve accounts at the Federal Reserve Bank. Treasury securities are nothing more than alternative deposits in securities accounts at the Federal Reserve Bank for those dollars. Both are equally ‘safe’.

Now, in principle the private sector can also create safe assets, such as deposits in banks that are universally perceived as sound. In the years before the 2008 financial crisis Wall Street claimed to have invented whole new classes of safe assets by slicing and dicing cash flows from subprime mortgages and other sources.

But all of that supposedly brilliant financial engineering turned out to be a con job: When the housing bubble burst, all that AAA-rated paper turned into sludge. So investors scurried back into the haven provided by the debt of the United States and a few other major economies. In the process they drove interest rates on that debt way down.


Rates went down in anticipation of future rate setting by the fed.

What investors did was reprice financial assets. Investors can’t change total financial assets. The total only changes with new issues and redemptions/maturities.

And those low interest rates, Mr. Kocherlakota declares, are a problem. When interest rates on government debt are very low even when the economy is strong, there’s not much room to cut them when the economy is weak, making it much harder to fight recessions.


True, but cutting rates doesn’t fight recessions. In fact low rates reduce interest income paid by govt to the economy, thereby weakening it.

There may also be consequences for financial stability: Very low returns on safe assets may push investors into too much risk-taking — or for that matter encourage another round of destructive Wall Street hocus-pocus.


That would be evidenced by an increase in the issuance of higher risk securities, but there has been no evidence of that. In fact, it was $100 oil that at the margin drove the credit expansion that supported GDP growth, as evidenced by the collapse when prices fell.

What can be done? Simply raising interest rates, as some financial types keep demanding (with an eye on their own bottom lines), would undermine our still-fragile recovery.


It would more likely very modestly strengthen it from the increase in the govt deficit due to the increased interest income paid by govt to the economy. However, I’d prefer a tax cut and/or spending increase to support GDP, rather than an interest rate increase. But that’s just me…

What we need are policies that would permit higher rates in good times without causing a slump. And one such policy, Mr. Kocherlakota argues, would be targeting a higher level of debt.


Mr. K isn’t wrong, but again I’d rather just have a larger tax cut to get to the same point, but, again, that’s just me…

In other words, the great debt panic that warped the U.S. political scene from 2010 to 2012, and still dominates economic discussion in Britain and the eurozone, was even more wrongheaded than those of us in the anti-austerity camp realized.


True, and this author…

Not only were governments that listened to the fiscal scolds kicking the economy when it was down, prolonging the slump; not only were they slashing public investment at the very moment bond investors were practically pleading with them to spend more; they may have been setting us up for future crises.


True but for differing reasons. It’s never about investors pleading. It’s always about the public purpose behind the policies.

And the ironic thing is that these foolish policies, and all the human suffering they created, were sold with appeals to prudence and fiscal responsibility.


The larger problem with this editorial is that the wrong reasons it gives for what’s largely the right policy are out of paradigm reasons that the opposition routinely shoots down and shouts down, easily convincing the electorate that they are correct and the ‘headline left’ is wrong.

Feel free to distribute
euro area trade, housing comments, consumer prices

Continues very strong. This is for member using the euro:
er-8-19-6

Size of New Homes in U.S. Shrinks by One Closet

By Kris Hudson

Aug 18 (WSJ) — Of the 206,000 homes that went under construction in the second quarter, the median size was 2,479 square feet. That was 40 square feet smaller—or about the size of a walk-in closet—than the high set in the first quarter. The National Association of Home Builders estimates that first-time buyers, who tend to purchase entry-level homes, will account for 18% of new-home sales this year. That is up from 16% last year but still well short of their share of 25% to 27% from 2001 to 2005. Then, quarterly median sizes for new homes ranged from 2,051 to 2,263 square feet.

Maybe reduced value conflicts between boomers and their kids vs boomers and their parents are contributing to keeping kids at home?

No improvement in purchase apps here. Been largely flat for the last several months now:

MBA Mortgage Applications
er-8-19-7
Consumer Price Index
er-8-19-8
Highlights
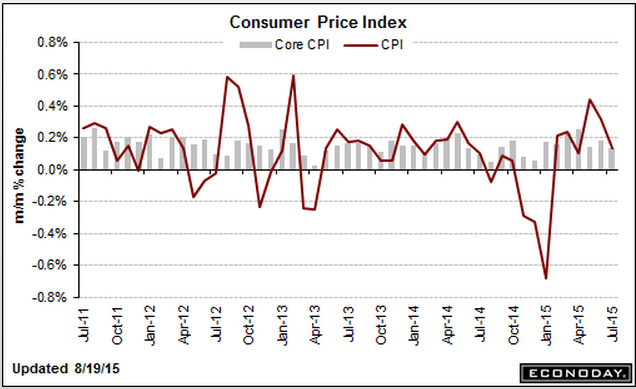
Inflation wasn’t brewing in July and with oil prices moving lower, inflation may not be showing much pressure in August either. The consumer price index rose only 0.1 percent in July as did the core, both under expectations. Year-on-year rates show slightly more pressure. Overall inflation is up 0.2 percent, which is very low but up from 0.1 percent in the prior month and the second positive reading of the year. The core is steady at plus 1.8 percent which is just under the Fed’s 2 percent target.

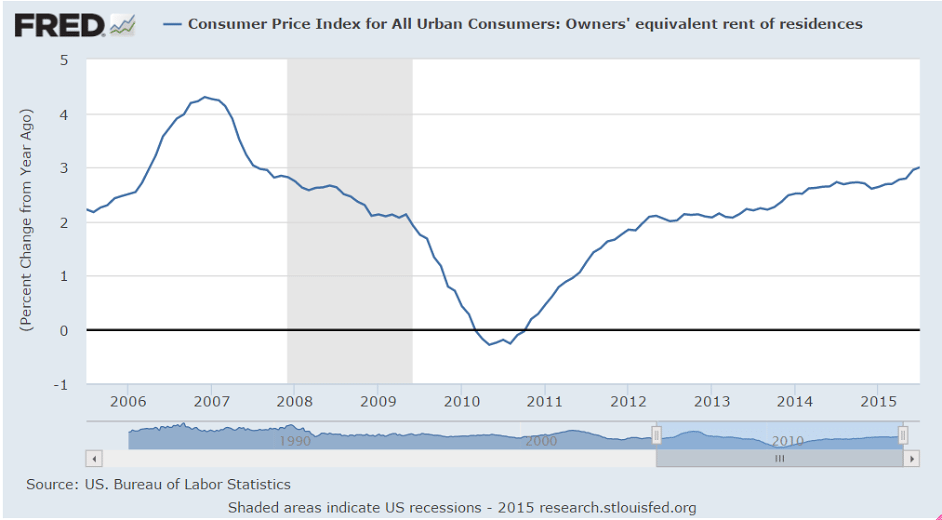
Gasoline moved sharply higher in July, up 0.9 percent following outsized gains of 3.4 percent and 10.4 percent in the prior two months. But with gas prices moving steadily lower this month, the upward effects of gasoline will be turning downward in August. Another major component showing upward pressure in July is apparel which rose 0.3 percent following, however, a long string of declines. Owners equivalent rent continues to show pressure, up 0.3 percent on top of June’s outsized gain of 0.4 percent.

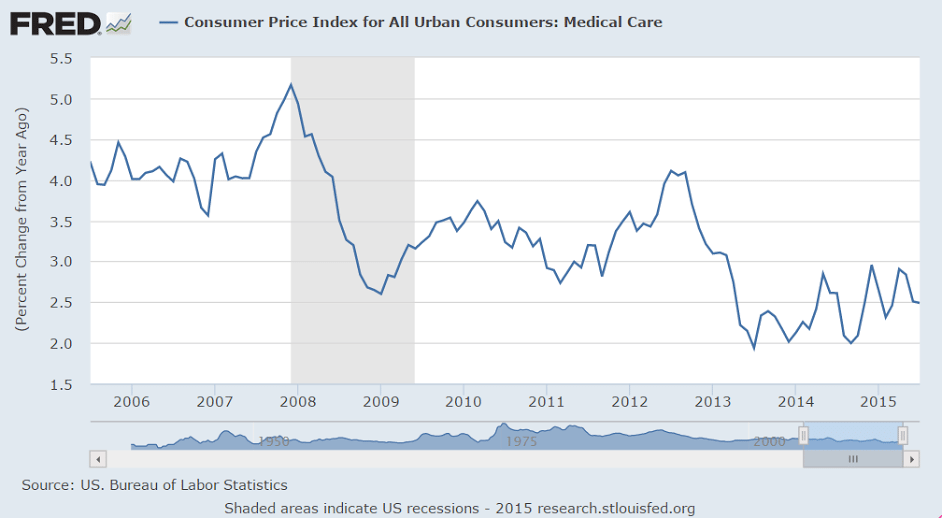
Elsewhere, however, pressures are hard to find with electricity down 0.4 percent, used vehicles down 0.6 percent, new vehicles down 0.2 percent, and airfares down 5.6 percent. Medical, drugs, and education all rose only 0.1 percent.

There may be some upward creep in the headline year-on-year rates but, given the ongoing decline in oil, this report won’t be pushing the Fed for a September rate hike.
er-8-19-9
er-8-19-10
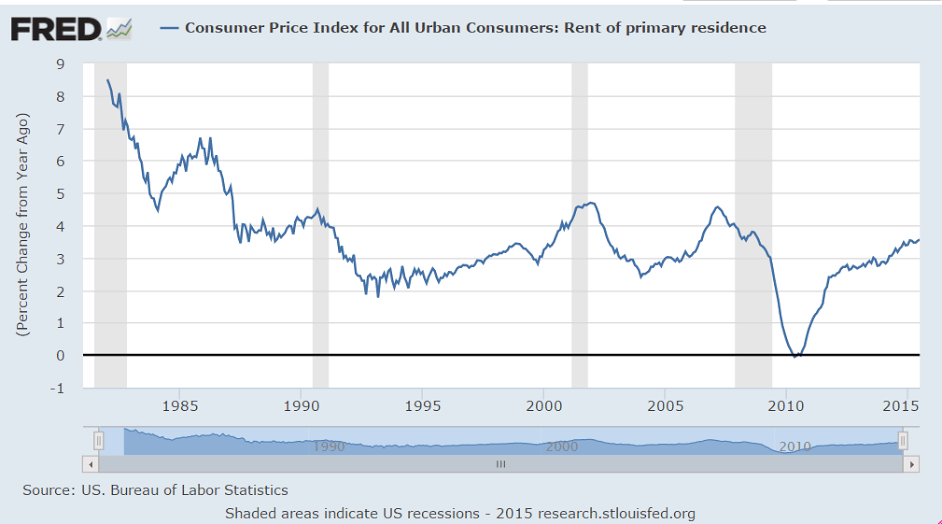
Rents have been moving up some, though still at a modest rate. Seems to me as per the depressed housing starts prices haven’t yet gotten close enough to replacement costs. Once they do get to replacement cost, market forces work to increase supply as ‘demanded’ without further ‘catch up’ price increases. At that point price increases come from increases in costs.
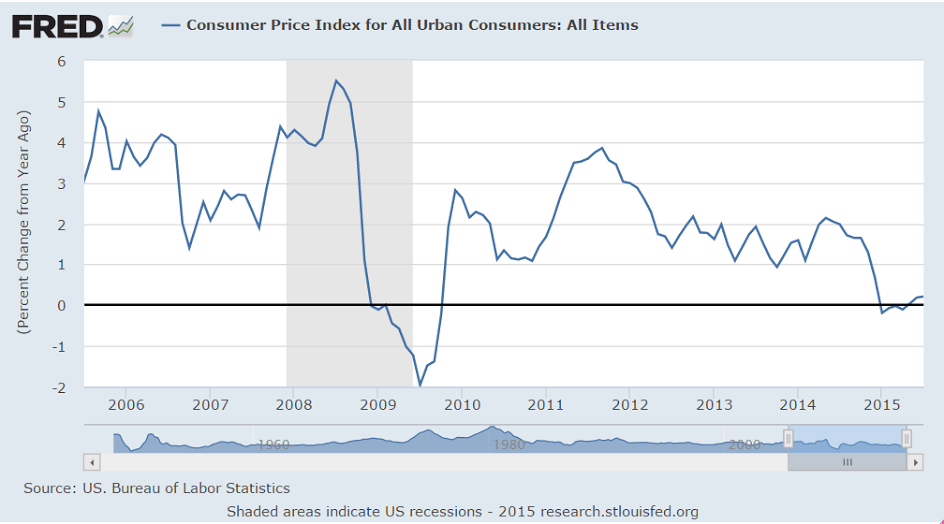
Also, lower utility costs for the landlord that aren’t passed through to the renter ‘count’ as higher rents, which means the drop in fuel and utility costs translate to increased rents when, for example, the actual payment remains the same:
er-8-19-11
er-8-19-12

Remember a few years back when the mainstream was sounding the alarm over this?
er-8-19-13
And this about a year ago?
er-8-19-14

Fed white paper, building permits, transport charts, Japan trade


So someone on high sees it much like I do…

;)

In a white paper dissecting the U.S. central bank’s actions to stem the financial crisis in 2008 and 2009, Stephen D. Williamson, vice president of the St. Louis Fed, finds fault with three key policy tenets.

Specifically, he believes the zero interest rates in place since 2008 that were designed to spark good inflation actually have resulted in just the opposite. And he believes the “forward guidance” the Fed has used to communicate its intentions has instead been a muddle of broken vows that has served only to confuse investors. Finally, he asserts thatquantitative easing, or the monthly debt purchases that swelled the central bank’s balance sheet past the $4.5 trillion mark, have at best a tenuous link to actual economic improvements.

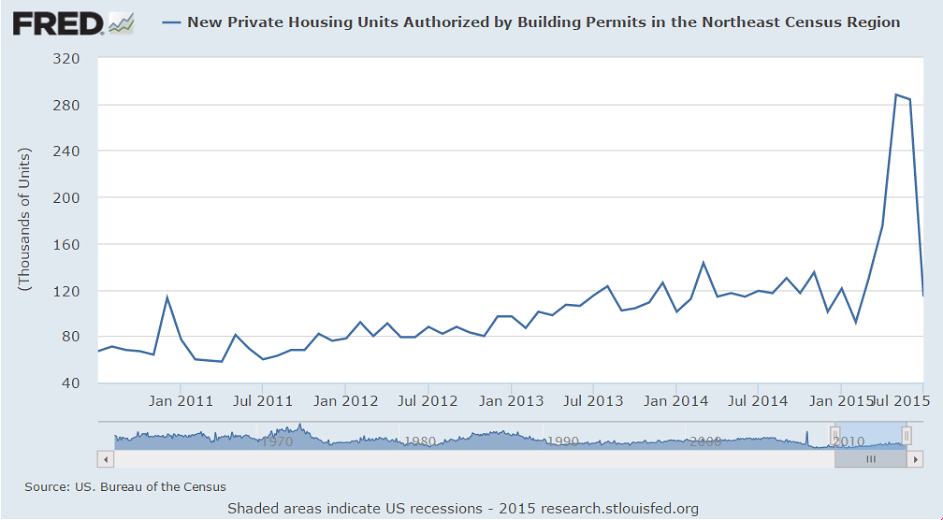
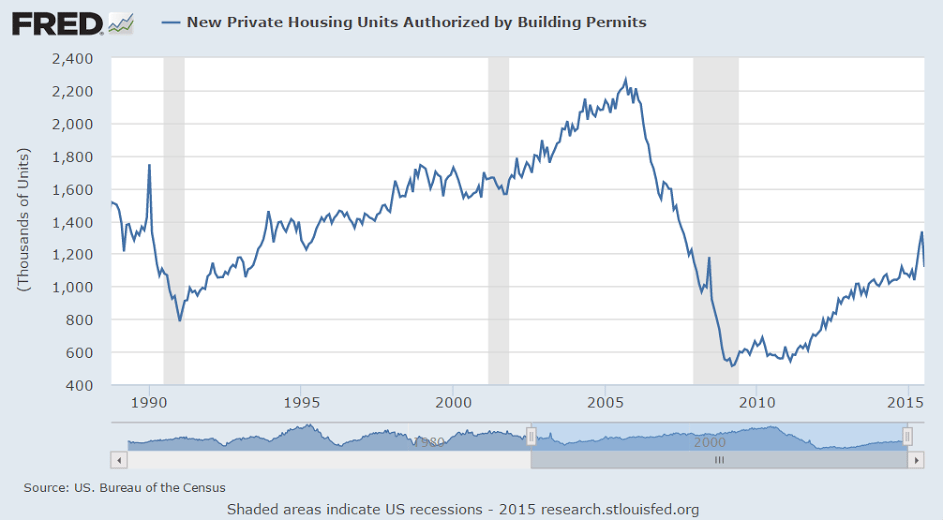
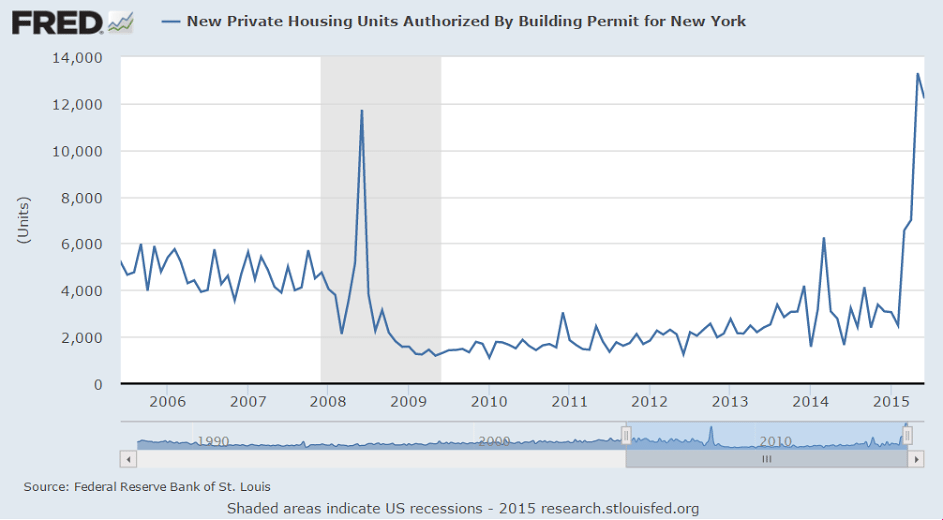
Remember last month cautioning about how a spike up in building permits has sometimes been followed by recession?
er-8-19-1
And the NY benefits that expired June 15 were supporting the total numbers and are likely to be followed by much lower numbers:
er-8-19-2
Once again Varoufakis reconfirms he’s clueless with regard to public finance:

Varoufakis Proposal for Eurozone Sovereign Debt

August 18 (Econintersect) — Former Greek finance minister Yanis Varoufakis has proposed a debt restructuring process for over-indebted Eurozone countries that does not involve writing down debt or bailing out insolvent countries. It is based on an idea proposed by Varoufakis with Stuart Holland and James K. Galbraith (link below).

The proposal is for a complex and costly process functionally identical to a simple, no cost, ECB guarantee.

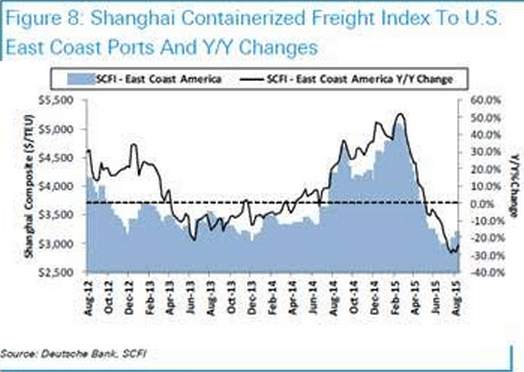
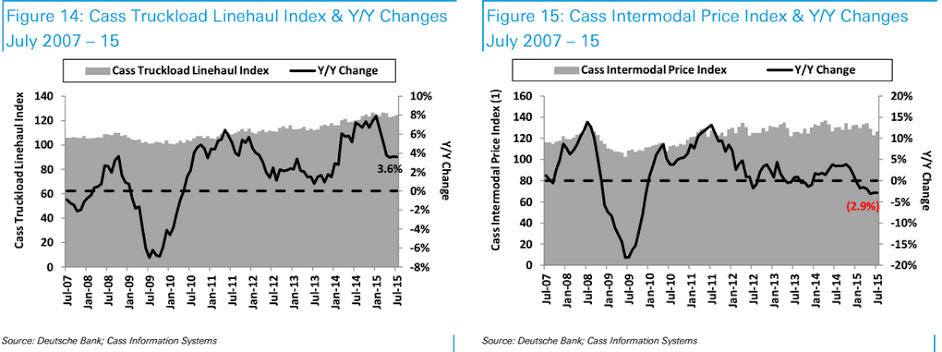
DB Charts:

er-8-19-3

er-8-19-4

Exports growing though at a slower rate, imports declining at a faster rate:

Japan : Merchandise Trade
er-8-19-5

Empire manufacturing, housing market index, EU merchandise trade

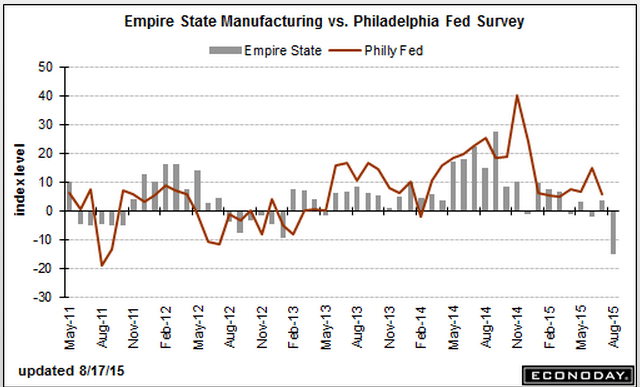
The lack of support from the lost oil capex continues to ripple out:

United States : Empire State Mfg Survey
er-8-17-1
Highlights
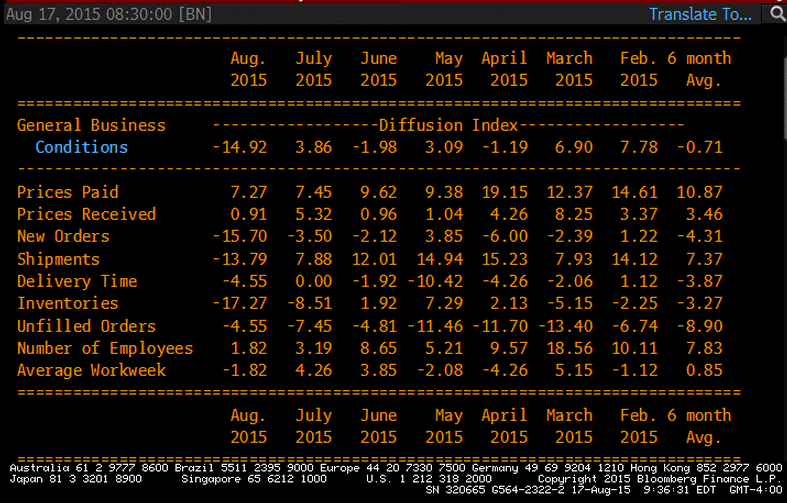
Out of the blue, the Empire State index has plunged deeply into negative column this month, to minus 14.92 in August vs plus 3.86 in July. This is by far the weakest reading of the recovery, since April 2009. New orders, which had already been weak in this report, fell from July’s minus 3.50 to minus 15.70 for the weakest reading since November 2010. Backlog orders, which had also been weak, came in at minus 4.55 from minus 7.45. Shipments, in the weakest reading since March 2009, fell to minus 13.79 from positive 7.99.

Last week’s industrial production report, boosted by the auto sector, offered hope but today’s report is a reminder that weak exports and weakness in the energy sector are stubborn negatives for the factory sector. Today’s results scramble the outlook for Thursday’s Philly Fed report which was expected to show moderate strength.
er-8-17-2
er-8-17-3

Home builders remain optimistic:

United States : Housing Market Index
er-8-17-4
Highlights
The new home sector is increasingly a central source of strength for the economy and builders are increasingly optimistic. The housing market index rose 1 point to a very strong 61 in August with the future sales component leading the way at 70. Current sales are at 66 with traffic continuing to lag but less so, at 45 for a 2 point gain in the month. By region, the South and West show the greatest composite strength at 63 each followed by the Midwest at 58 and the Northeast, which is the smallest region for new homes, still showing contraction at a sub-50 reading of 46.

Strength in the labor market is the driving force behind strength for new homes where lack of supply continues to motivate builders. Today’s report points to another strong housing starts report for tomorrow.

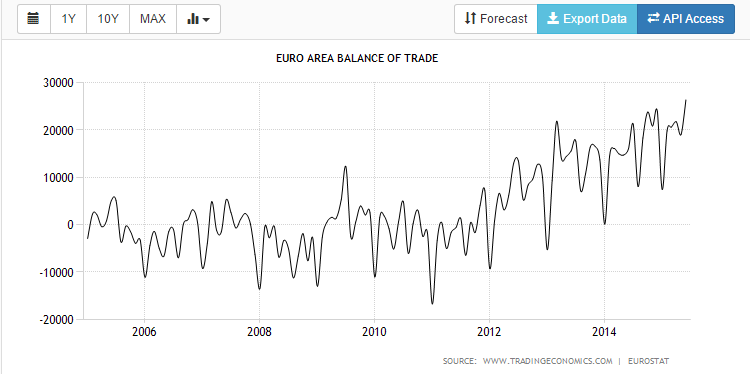
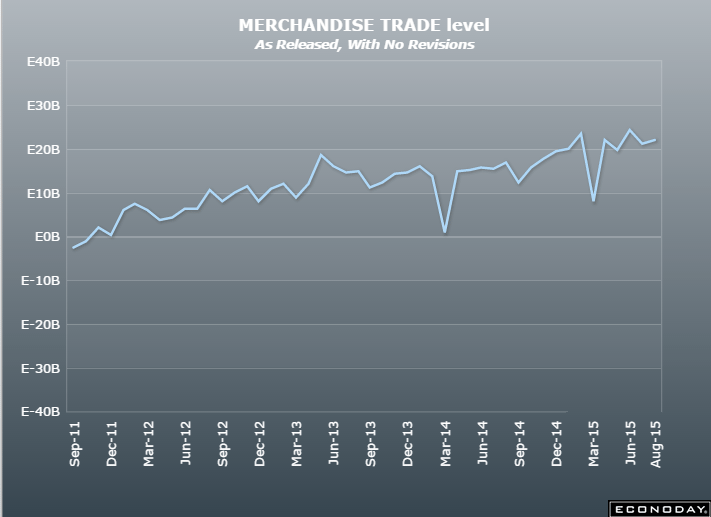
Never yet seen a positive trade balance and a weak currency, without an inflation problem. The euro is down only because of portfolio shifting, particularly CB’s, which may have run its course, and the general outlook remains deflationary. While this includes the (minority) non euro members, the trend is the same for just the ‘euro area’ which is also reported separately:

European Union : Merchandise Trade
er-8-17-5
Highlights
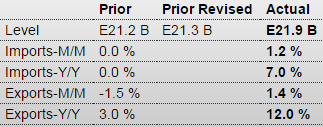
The seasonally adjusted trade balance was E21.9 billion, up from a revised E21.3 billion in May. Exports of goods to the rest of the world were €182.7 billion, an increase of 12 percent from a year ago. Imports from the rest of the world were E156.4 billion, 7 percent higher from a year ago. Intra-euro area trade rose to E151.2 billion in June 2015, up 10 percent compared with June 2014.

For the six months to June 2015, euro area exports of goods to the rest of the world rose 6 percent compared with January to June 2014), while imports were up 3 percent compared with the year earlier period.

Apart from the weakness of the oil market, the current soft level of the euro should help to ensure continued strong trade data over the rest of 2015.
er-8-17-6

Producer Prices, Industrial Production, Rail Traffic, Container Exports


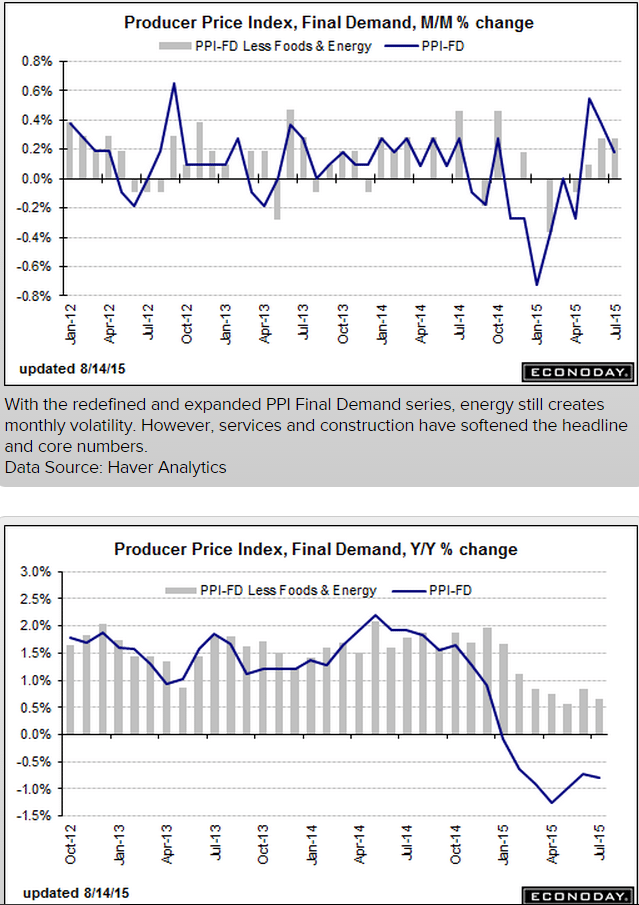
This is not a reason to hike rates, but the Fed has other reasons beginning with their mistaken belief that the current policy is ‘highly accommodative’ and potentially inflationary, etc. etc. etc. when the opposite is the actual case:

er-8-15-1

Up a bit more than expected, but all due to auto production, and yesterday’s wholesale trade report told us it all went to building (unsold) inventory, with sales of domestic cars relatively flat, so look for a reversal over the next few months. And note the reference to weak exports:

Industrial Production
er-8-15-2

Highlights
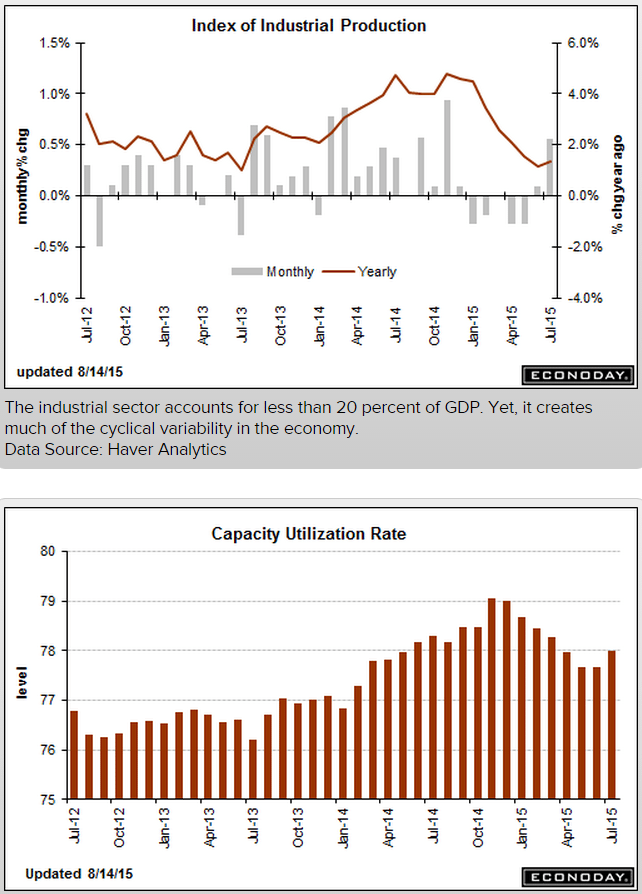
A 10.6 percent surge in motor vehicle production gave a very significant lift to industrial production which rose 0.6 percent in July. The manufacturing component, which has been flat all year, jumped 0.8 percent. Excluding vehicles, however, manufacturing rose only 0.1 percent. The lack of strength here is the result of business equipment which edged only 0.1 percent higher after declining 0.2 percent in June.

The rise in production drove capacity utilization up 3 tenths to 78.0 percent which is where it was back in April. Capacity utilization for manufacturing rose 5 tenths to 76.2 percent.

The two non-manufacturing components are mixed. Production at utilities, due to July’s cool weather, fell 1.0 percent with capacity utilization down 8 tenths to 79.1 percent, while mining production rose 0.2 percent with capacity utilization down 1 tenth to 84.4 percent.

Weak foreign demand and weakness in the energy sector may be hurting much of the industrial sector but these factors are not at play in the domestic auto industry. The readings in today’s report are mixed but the headline gain, driven by the convincing strength for autos, is an eye catcher and will certainly be ammunition for the hawks at next month’s FOMC meeting.

er-8-15-3


Weaker than expected and continuing to fade some (in line with stocks…), and note that it peaked with the fall in oil prices:

er-8-15-4

Rail Week Ending 08 August 2015: Continued Decline of One Year Rolling Average

By Steven Hansen
August 13 (Econintersect)

Econintersect: Week 31 of 2015 shows same week total rail traffic (from same week one year ago) contracted according to the Association of American Railroads (AAR) traffic data. Intermodal traffic expanded year-over-year, which accounts for approximately half of movements. and weekly railcar counts continued in contraction.

U.S. Containerized Exports Fall Off the Chart

By Wolf Richter
August 13 (Wolf Street)

“Many of our major trading partners are experiencing stalled or slowing economies, and the strength of the US Dollar versus other currencies is making US goods more expensive in the export market.” That’s how the Cass/INTTRA Ocean Freight Index report explained the phenomenon.

What happened is this: The volume of US exports shipped by container carrier in July plunged 5.8% from an already dismal level in June, and by 29% from July a year ago. The index is barely above fiasco-month March, which had been the lowest in the history of the index going back to the Financial Crisis.

The index tracks export activity in terms of the numbers of containers shipped from the US. It doesn’t include commodities such as petroleum products that are shipped by specialized carriers. It doesn’t include exports shipped by rail, truck, or pipeline to Mexico and Canada. And it doesn’t include air freight, a tiny percentage of total freight. But it’s a measure of export activity of manufactured and agricultural products shipped by container carrier.

Overall exports have been weak. But the surge in exports of petroleum products and some agricultural products have obscured the collapse in exports of manufactured goods

er-8-15-5