Jobless claims, Retail sales

claims-2-12

Maybe it’s because lower oil prices merely shift income from sellers to buyers, with capex reductions a net loss to all etc. as previously discussed?

Retail Sales
retail-sales-jan-table
Highlights
Lower gasoline prices continue to tug down on retail sales. And consumers are not yet putting higher discretionary income into spending on non-gasoline categories of retail sales even as confidence has improved. Retail sales in January fell 0.8 percent after declining an unrevised 0.9 percent in December. Excluding autos, sales decreased 0.9 percent-the same pace of decline as in December. Analysts expected a 0.5 percent decrease. Excluding both autos and gasoline sales rose 0.2 percent after no change in December. Expectations were for a 0.4 percent increase.

The latest retail sales numbers are not consistent with increased discretionary income and higher confidence. One explanation may be that consumers are spending more on services than on “hard” items found in the retail sales report.
retail-sales-jan

Wholesale trade, BOE on Greece, Redbook sales, Jolts

Inventories looking excessive:

Wholesale Trade
wholesale-trade-dec
Highlights
The economy may be solid right now but inventories at the wholesale level look heavy, rising 0.1 percent in December vs a noticeable 0.4 percent decline in sales at the wholesale level. The mismatch drives up the stock-to-sales ratio by 1 tenth to 1.22 which is the heaviest reading since way back in the troubled days of late 2009. This ratio was at 1.17 through the middle of last year but has since been moving higher.

December’s unwanted wholesale build is centered in the non-durable component where sales, in contrast to durable goods which rose 1.1 percent, fell 1.7 percent in the month. Here the culprit is petroleum where sales, reflecting both price effects and lower demand, fell 13.7 percent in the month. And the supply overhang, based on weekly petroleum inventory data, has continued to build into the new year. Showing a big draw in the month are lumber and electrical goods, two products that may be signaling rising demand out of the construction sector.

The nation’s inventories have been moving higher but the imbalance has been centered in the wholesale sector, though inventories at the factory level are showing a little pressure. Watch Thursday for the business inventories inventory report which will round out December’s data with data on the retail sector.

Wholesale inventories up 0.1% in December, versus expectations for 0.2% gain

Feb 10 (Reuters) — U.S. wholesale inventories barely rose in December, the latest suggestion that fourth-quarter growth could be revised lower.

The Commerce Department said on Tuesday wholesale inventories edged up 0.1 percent as lower crude oil prices weighed on the value of petroleum stocks. Stocks at wholesalers had increased by an unrevised 0.8 percent in November.

Economists polled by Reuters had forecast wholesale inventories rising 0.2 percent in December.

Inventories are a key component of gross domestic product changes. The component that goes into the calculation of GDP – wholesale stocks excluding autos—nudged up 0.1 percent.

The report, together with last week’s data showing a 0.3 percent fall in manufacturing inventories in December, suggested the boost to GDP growth from restocking in the fourth quarter was probably not as large as initially thought.

The government estimated last month that inventories added 0.8 percentage point to the economy’s annualized 2.6 percent growth pace in the fourth quarter.

Sales at wholesalers fell 0.4 percent in December after a similar decline in November. At December’s sales pace it would take 1.22 months to clear shelves, down from 1.21 months in November.

The last thing Greece needs are collaborators. First Italy and now the BOE:

BOE’s Carney Applauds ECB Policy (WSJ) “There are many reasons why the ECB’s actions are important, one of them is it shows the ECB has the full tool kit to support the underlying economy as necessary…the ECB is taking bold action,” BOE Governor Mark Carney said. While the ECB move is constructive, it won’t deliver medium-term prosperity to the eurozone economy, Mr. Carney said.

This isn’t supposed to be declining with the presumed boost to the consumer from low oil prices:

Redbook
redbook-2-7
Highlights
Retail sales slowed substantially in the February 7 week, to a year-on-year plus 2.1 percent from 3.8 percent in the prior week. The 2.1 percent rate is very low which the report attributes to the Super Bowl which diverted consumer attention. Redbook sees sales picking up in the next report due to Valentine’s Day. The government’s retail sales report this Thursday is the week’s big event on the calendar and is expected to show a bounce-back rise in core sales for January (ex-auto ex-gas).

JOLTS
jolts-dec
Highlights
There were 5.028 million job openings on the last business day of December, slightly improved from 4.847 million in November. Hires (5.148 million) and separations (4.886 million) were little changed in December. Within separations, the quits rate (1.9 percent) and the layoffs and discharges rate (1.2 percent) were unchanged. This release includes estimates of the number and rate of job openings, hires, and separations for the nonfarm sector by industry and by four geographic regions.

There were 5.148 million hires in December, slightly higher than November’s 5.054 million. This was the highest level of hires since November 2007. The hires rate in December was 3.7 percent. The number of hires was little changed for total private and government. Hires increased over the month in construction.

Total separations include quits, layoffs and discharges, and other separations. Total separations are referred to as turnover. Quits are generally voluntary separations initiated by the employee. Therefore,
the quits rate can serve as a measure of workers’ willingness or ability to leave jobs. Layoffs and discharges are involuntary separations initiated by the employer. Other separations include separations
due to retirement, death, and disability, as well as transfers to other locations of the same firm.
There were 4.9 million total separations in December, little changed from November. This was the highest level of separations since October 2008. The separations rate was 3.5 percent. The number of total separations was little changed for total private and government.

There were 2.717 million quits in December, little changed from November. The quits rate in December was 1.9 percent. The number of quits was little changed for total private and government. Quits increased in construction and durable goods manufacturing. The number of quits was little changed in all four regions.

Overall, the JOLTS numbers portray a slowly improving jobs market with job openings rising along with hires.

labor market index, consumer credit, China trade, BIS on oil and debt

This is the Fed’s new indicator:

Labor Market Conditions Index
lm-conditions
Definition
The U.S. labor market is large and multifaceted. Often-cited indicators such as the unemployment rate or payroll employment, measure a particular dimension of labor market activity. It is not uncommon for different indicators to send conflicting signals about labor market conditions. The Fed’s research department has created a labor market conditions index (LMCI) based on 19 labor market indicators. It is not an official report. However, the monthly publication is carefully noted by Fed Chair Janet Yellen and has gained market attention.

Misleading at best as the two month average was just that, average:

Consumers swipe way to largest increase in revolving credit since March (WSJ) Total outstanding consumer credit expanded at a 5.37% seasonally adjusted annual rate to $3.31 trillion in December. That was a slight acceleration from November’s 4.92% gain. Revolving credit grew at a 7.85% pace in December, a turnaround from November’s 1.28% decline. December’s expansion in revolving credit was the largest since March. Nonrevolving credit, such as auto and student loans, grew at a 4.46% pace during the month, the smallest monthly increase since October 2011. November’s nonrevolving balances grew 7.21%. Revolving credit tends to be volatile, but nonrevolving credit has consistently expanded since August 2011.

No acceleration in growth whatsoever:
cc-2-9-1
The revolving is volatile but doesn’t look to be going anywhere:
cc-2-9-2

cc-2-9-3

January data always suspect but sometimes indicative:

China’s imports slump, capping dismal January trade performance (Reuters) China exports fell 3.3 percent in January from year-ago levels while imports tumbled 19.9 percent. Last year the new year holiday idled factories and financial markets for a week in January, but this year the holiday comes in late February and January was a full month of business as usual. Coal imports dropped nearly 40 percent to 16.78 million tonnes, down from December’s 27.22 million tones. Crude oil imports slid by 7.9 percent in volume terms. While exports to the United States rose by 4.8 percent year-on-year to $35 billion, exports to the European Union slid 4.6 percent to $33 billion in the same period. Exports to Hong Kong, South Korea and Japan were also down, with exports to Japan slumping over 20 percent.

China’s Exports Post Surprise Drop in January (WSJ) Exports fell 3.3% in January from a year earlier, a sharp deterioration from December’s 9.7% rise. In January, exports to Southeast Asia and the U.S. were stronger, while shipments to the European Union, Japan and Hong Kong were all weaker in dollar terms. In a statement accompanying the trade data, China’s customs authorities said that a survey showed weaker confidence among exporters for the fourth consecutive month. “This shows that exports will be facing downward pressure in the first quarter as well as the beginning of the second quarter,” the statement said. Year-ago data for January may have been inflated by over-invoicing by exporters. Exports climbed nearly 11% year over year in January last year.

This is a lot more threatening than I had been led to believe:

Box: Oil and debt

Note the rate of energy debt growth over the last few years, and that these charts don’t include all energy related debt. Looks to have been about 1% of GDP and added about that much plus ‘multipliers’, filling in for the tax hikes and sequesters of 2013.

And now it’s over.

Two things as price fell in half from $100/barrel.

1. Credit expansion slows and maybe reverses.

2. The value of the collateral behind the loans has been halved, which is highly problematic for the lenders.
cc-2-9-4
cc-2-9-5
These are just initial BIS findings. The full report comes out in March.

And not to forget there’s now a new King of Saudia Arabia who decides what the price will be.

Jobs, Currency wars, etc.

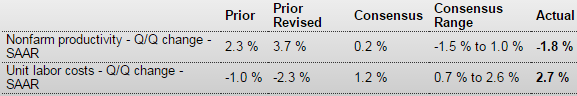
Heaps stronger than expected:

Employment Situation
payrolls-jan
Highlights
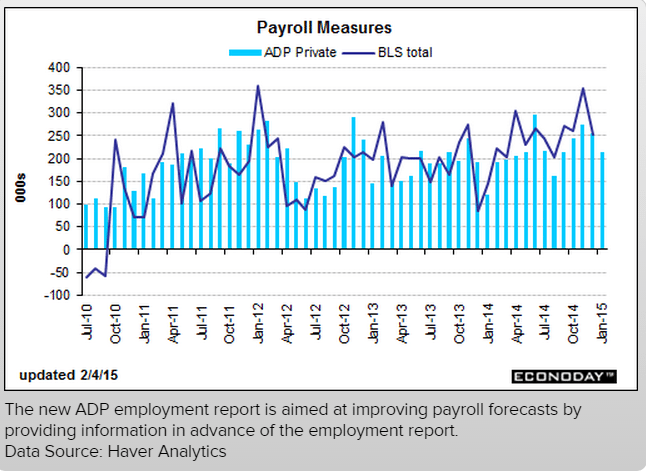
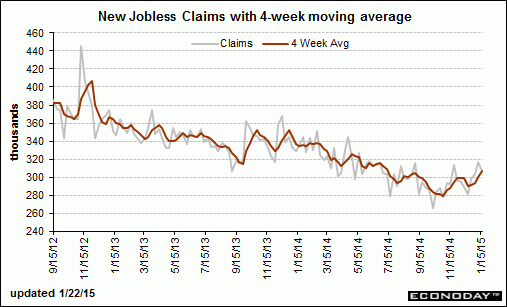
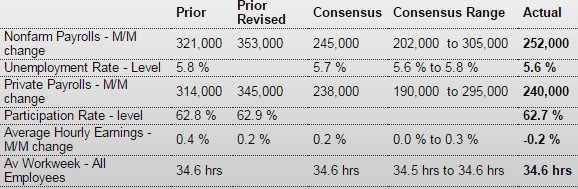
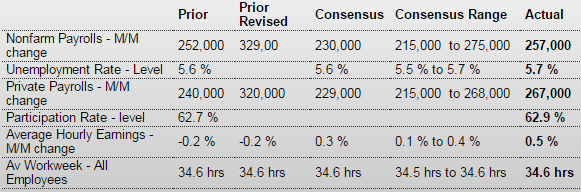
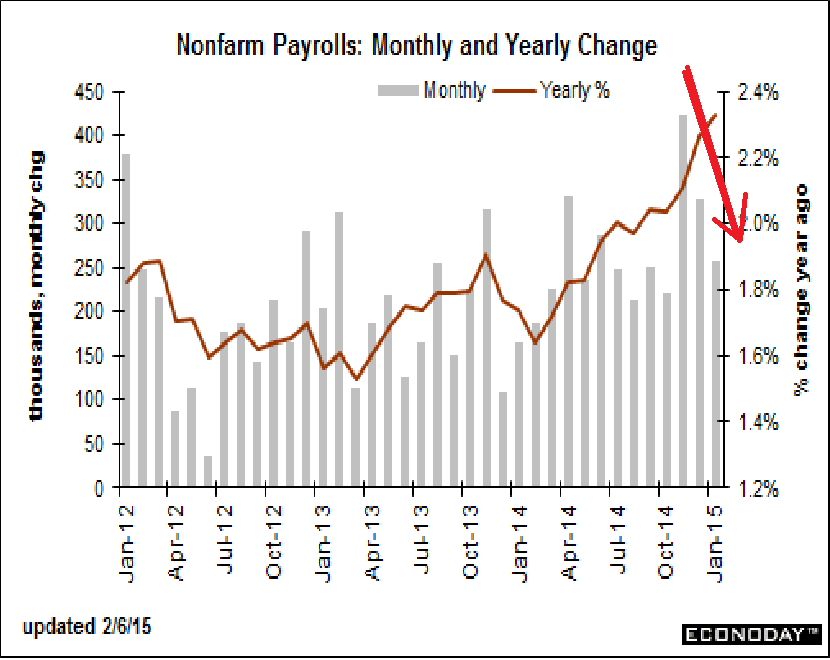
Today’s employment situation was heavily positive even though the unemployment rate edged up. Payroll jobs gained 257,000 in January after strong increases of 329,000 in December and 423,000 in November. December and November were revised up a net 86,000. With the revision, November is the strongest month since May 2010. Today’s report may tip the balance for the Fed to think about a first increase in policy rates this year rather than next-although still at a slow pace.

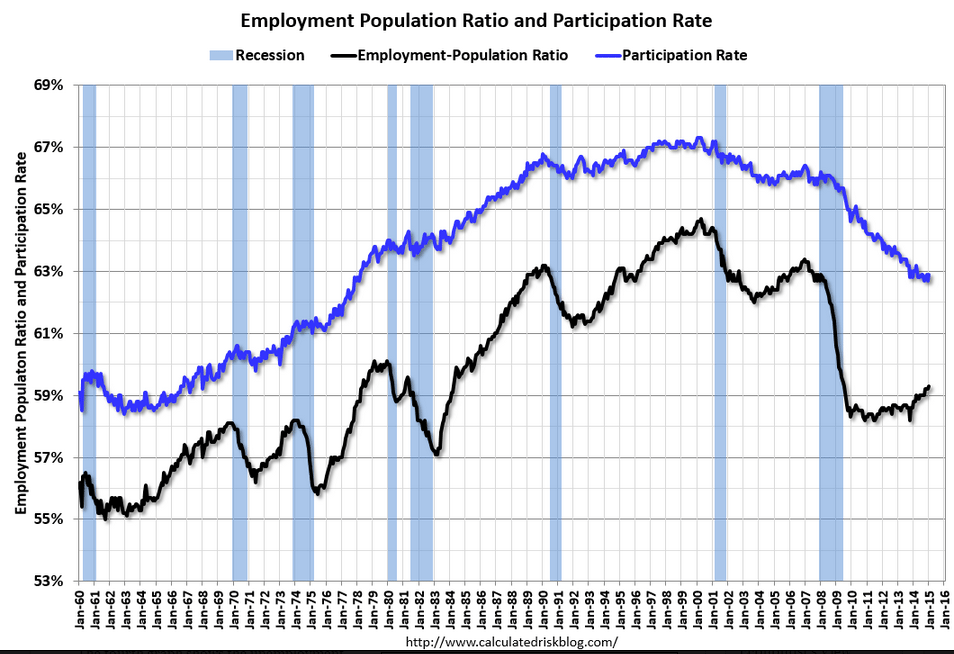
The unemployment rate nudged up to 5.7 percent from 5.6 percent in December. The rise was due to a sharp rebound in the labor force. The labor force participation rate rose to 62.9 percent from 62.7 percent in December. It appears that some discouraged workers are returning to the labor force—a positive sign for how workers view the economy.

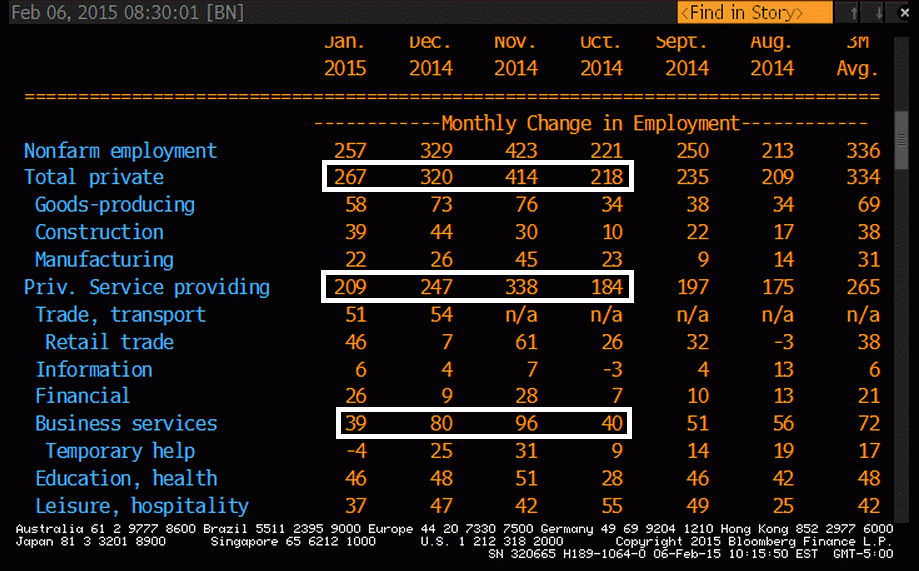
Turning back to the establishment survey, private payrolls increased 267,000 in January after a 329,000 boost the month before.

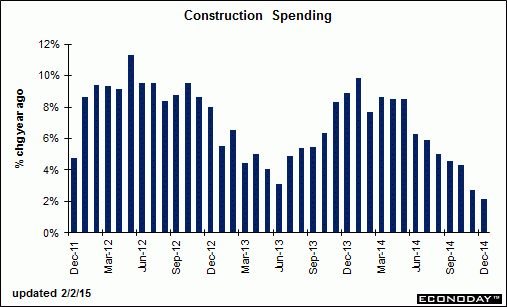
Goods-producing jobs increased 58,000 after a 73,000 boost in December. Manufacturing increased 22,000 after rising 26,000 in December. Construction jumped 39,000 in January after gaining 44,000 the month before. Mining slipped 4,000 after rising 3,000 in December. These numbers offer hope that the manufacturing and construction sectors are improving. In recent months, they have been sluggish.

Private service-providing industries posted a 209,000 increase after a gain of 247,000 in December. Government jobs declined by 10,000 in January after a rise of 9,000 the month before.

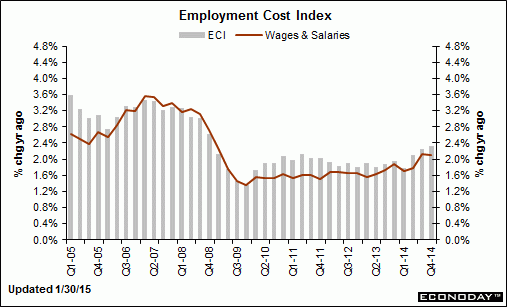
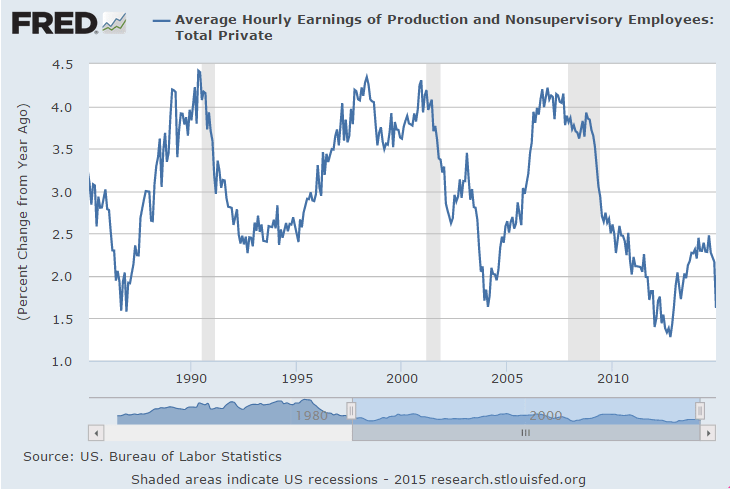
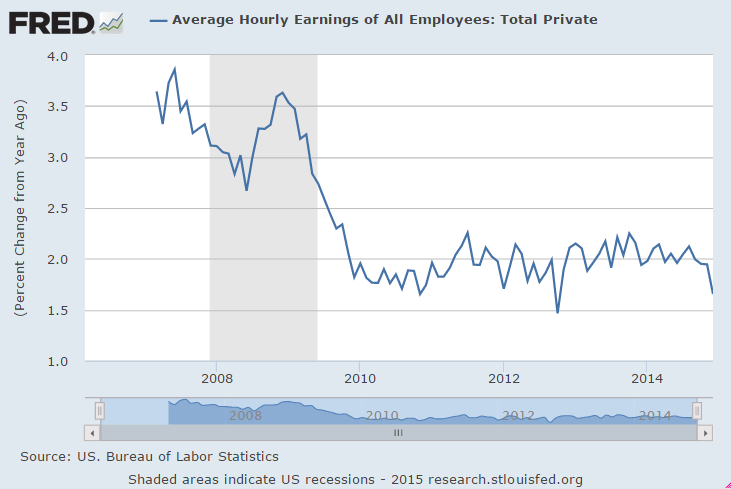
The labor force may be tightening a bit as average hourly earnings rebounded 0.5 percent, following a 0.2 percent dip in December. However, part of the boost in wages was due to increases in some states’ minimum wage. The average workweek held steady at 34.6 hours.

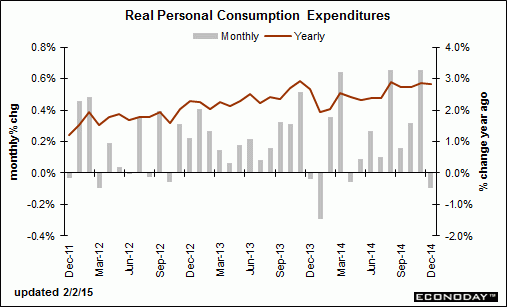
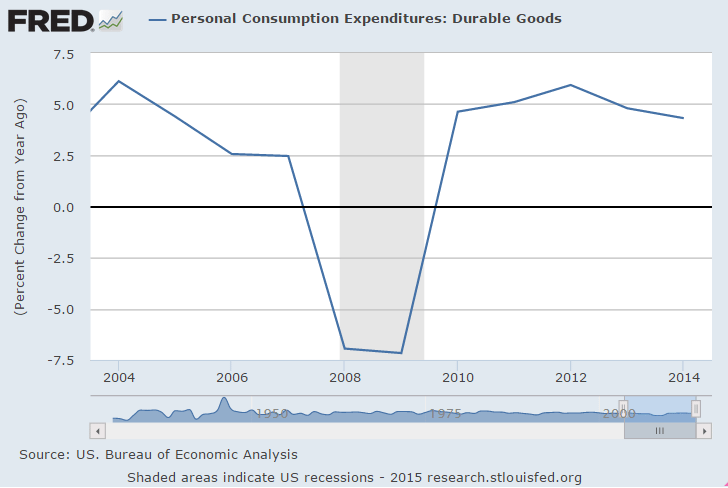
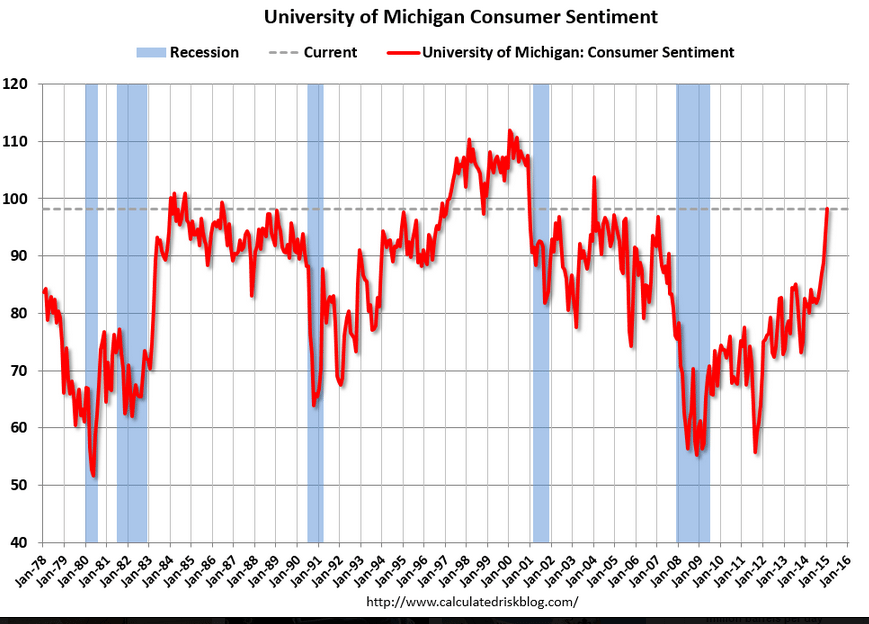
Overall, the latest employment situation suggests that the consumer sector is still the current backbone of the recovery. Also, the labor market has been given an upgrade with upward revisions to November and December. A caveat for the latest report is that seasonal factors for cold weather months can be volatile.

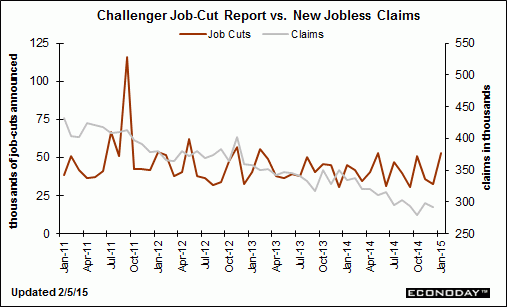
So anyone remember what that big spike in November was all about?

I don’t recall anything at the time in the news, etc. that would have indicated any kind of hiring surge was happening?

Anyway, whatever it was seems to be unwinding?
payrolls-jan-2

payrolls-jan-3

payrolls-jan-4

Currency wars, deflation fights, and with all the guns shooting backwards. As the carpenter said, ‘no matter how much I cut off it’s still too short.’

History will not be kind to these people…

Currency war a worry ahead of G-20 finance gathering (Nikkei) With a number of countries loosening monetary policy, avoiding competitive currency devaluation has emerged as a key issue for the meeting of Group of 20 finance ministers and central bankers that kicks off Monday in Istanbul. The communique released after the September G-20 meeting in Cairns, Australia, included language that in effect tacitly condoned monetary easing aimed at economic improvement. “Monetary policy in advanced economies … should address, in a timely manner, deflationary pressures where needed,” it read in part. The IMF, in January, projected growth of 1.2% in the eurozone, down 0.2 point from the October 2014 edition. The IMF cut its outlook for emerging markets by 0.6 point as well.

Fed’s Rosengren: Weak inflation is key challenge for central banks (WSJ) “The problem of significantly undershooting inflation—a dynamic which could well keep interest rates at the zero lower bound—is likely to be a key challenge to central bankers in the first two decades of the 21st century,” Federal Reserve Bank of Boston President Eric Rosengren said. “As with the oil shock in the 1970s, the current shock has served to accentuate a potential monetary policy pitfall—in this case, the failure to quickly and vigorously address a significant undershooting of inflation targets,” the central banker said. “We still are a long way from normalizing either short-term interest rates or our balance sheet,” the official said.

Benefits of aggressive Fed policy still to peak (WSJ) “The net stimulus to real activity and inflation was limited by the gradual nature of the changes in policy expectations and term premium effects, as well as by a persistent belief on the part of the public that the pace of recovery would be much faster than proved to be the case,” according to a new Fed board paper. “The peak unemployment effect—subtracting 1¼ percentage points from the unemployment rate relative to what would have occurred in the absence of the unconventional policy actions—does not occur until early 2015, while the peak inflation effect—adding ½ percentage point to the inflation rate—is not anticipated until early 2016,” write the authors.

Denmark Cuts Rates Again to Protect Currency Peg (WSJ) Denmark’s central bank scrambled to defend its under-pressure currency peg Thursday, cutting its benchmark interest rate for the fourth time in less than three weeks. The decision to cut the interest rate on deposits—to -0.75% from -0.5%–marks the latest effort to maintain the peg. Last week, the central bank, known as Nationalbanken, announced the surprise suspension of government bond auctions, and the bank said Tuesday it sold record amounts of kroner in January to weaken its currency. Nationalbanken Governor Lars Rohde tried to calm any fears about the future of the policy cornerstone. The central bank “has the necessary instruments to defend the fixed exchange rate policy for as long as it takes,” he said in a statement.

China cuts bank reserve requirement to spur growth (Reuters) China’s central bank made a system-wide cut to bank reserve requirements on Wednesday, the first time it has done so in over two years, to unleash a fresh flood of liquidity to fight off economic slowdown and looming deflation.

Greek leadership assures policy is good for its banks, while real economy and real people are devastated:

Greek central bank says ‘absolutely no problem’ with banks (Reuters) Greek central bank governor Yannis Stournaras said on Thursday that Greek banks were solid and under control. “Deposits and liquidity are absolutely safe,” Stournaras, who is also a member of the European Central Bank’s Governing Council, told reporters. “There is absolutely no problem with the banks. We are under control. It was a calm day today,” he said referring to bank deposits. Greek Prime Minister Alexis Tsipras and Finance Minister Yanis Varoufakis have been seeking support for a new deal with Greece’s international lenders that would allow an end to years of imposed austerity. “The ECB’s decision can be taken back if there is a deal from the Greek government (and its EU partners),” he said.

Not a good sign:

Baltic Dry Freight Index Plummets Amid Commodities Slump (WSJ) The Baltic Dry Index fell to 577 this week, a far cry from its peak of 11,793 in 2008. The size of the world’s fleet of dry-bulk ships far exceeds demand for the vessels which carry commodities, with over capacity estimated at around 20% above demand over the past few years. Many ships ordered at a time of booming global trade before the 2008 financial crisis have come into service as economic growth has spluttered in the years since. Rui Guo, a freight analyst at ICAP Shipping, said the tonnage in the water of dry-bulk vessels has gone up 85% since 2008, even as demand has fallen. Mr. Guo said daily freight rates for a 150,000-ton freight vessel are now around $5,500, with the break-even point around $7,500.

The Korea International Trade Association reported that exports of general machinery to China declined 7.1% in the January-November period of 2014, in contrast to a 2.0% increase in 2013.

payrolls-jan-5

Layoffs, Claims, Trade

Challenger Job-Cut Report
eco-release-2-5-1
Highlights
In perhaps the first warning of serious trouble from the oil patch, Challenger’s layoff count starts off the year with an elevated reading, at 53,041 for the highest reading since February 2013 and the highest January reading since 2012. Readings in December and November were much lower, at 32,640 and 35,940.

The energy sector represented roughly 40 percent of January’s cuts, at 20,193. Cuts in the energy sector were minimal in the fourth-quarter, averaging only 1,330 per month. The sector seeing the second largest number of cuts in January is retail, at 6,699 in downsizing following the holidays.

Jobless Claims
eco-release-2-5-2
Highlights
The jobs market is healthy based on jobless claims where initial claims, though up 11,000, came in at a much lower-than-expected 278,000 in the January 31 week, keeping the bulk of the improvement from the prior week’s revised 42,000 fall. The 4-week week average, down a sizable 6,500 in the week to 292,750, is trending right at the month-ago level in a comparison that points to another healthy monthly employment report for tomorrow.

Continuing claims, reported with a 1-week lag, are also at healthy levels though the month-ago comparison is less favorable. Continuing claims in the January 24 week rose 6,000 to 2.400 million while the 4-week average, though down 22,000, is at a 2.421 million level that is slightly above the month-ago trend. The unemployment rate for insured workers is holding at a recovery low of 1.8 percent.
eco-release-2-5-3

Negative productivity/jump in unit labor costs = over hiring given actual output?

Productivity and Costs
eco-release-2-5-4
Highlights
Nonfarm productivity growth for the fourth quarter declined an annualized 1.8 percent, following a 3.7 percent jump in the third quarter. Expectations were for a 0.2 percent rise. Unit labor costs increased 2.7 percent after falling an annualized 2.3 percent in the third quarter. Analysts projected a 1.2 percent gain.

Output growth softened to 3.2 percent in the fourth quarter, following a 6.3 percent jump the prior quarter. Compensation growth posted at 0.9 percent annualized after 1.3 percent the quarter before.

Year-on-year, productivity was unchanged in the fourth quarter, down from 1.3 percent in the third quarter. Year-ago unit labor costs were up 1.9 percent, compared to up 0.9 percent in the third quarter.

International Trade
eco-release-2-5-5
Highlights
The U.S. trade balance for December widened instead of narrowing as expected. Lower oil prices actually cut into petroleum exports.

In December, the U.S. trade gap grew to $46.6 billion from a revised $39.8 billion in November. Analysts forecast the deficit to narrow to $37.9 billion. Exports were down 0.8 percent after declining 1.1 percent the month before. Imports rebounded 2.2 percent after falling 1.8 percent in November.

Expansion in the overall gap was led by the goods excluding petroleum gap which increased to $49.7 billion from $46.3 billion in November.

The petroleum goods trade gap posted at $14.7 billion from $11.6 billion in November. Petroleum imports were up 7.7 percent while exports decreased 11.6 percent.

The services surplus was essentially unchanged at $19.5 billion.

On a seasonally adjusted basis, the December figures show surpluses, in billions of dollars, with
with South and Central America ($2.6), Brazil ($0.4), and United Kingdom ($0.1). Deficits were recorded, in billions of dollars, with China ($30.4), European Union ($12.7), Germany ($5.6), Mexico ($5.6), Japan ($5.4), Canada ($3.3), South Korea ($2.7), OPEC ($2.3), India ($2.1), Italy ($2.1), France ($1.1), and Saudi Arabia ($1.0).

Overall, the December number will likely lower estimates for fourth quarter GDP growth. But the good news is that the import numbers suggest that demand is moderately healthy.

eco-release-2-5-6

eco-release-2-5-7

eco-release-2-5-8

Mtg purchase apps, ADP, ISM

Looks like a dip anticipating lower gov fees a few weeks ago, followed by a blip up after, then returning to ‘trend’

Still very low:
mba-purch-apps
A bit lower than expected, but last month revised up a bit. Remember, this is a forecast of Friday’s release, not actual hard numbers:

ADP Employment Report
adp-jan-table
Highlights
ADP sees slowing in job growth for January, to a lower-than-expected 213,000 for private payrolls vs the Econoday consensus for 220,000 and against ADP’s upwardly revised 253,000 for December (initial estimate 241,000). Turning to government data, the corresponding Econoday consensus for Friday’s jobs report is 229,000 vs December’s 240,000.

The 213,000 increase for January is the lowest since September which was also 213,000. Increases in ADP’s data from October to December averaged 257,000. By industries, the largest percentage gain for January comes from construction, up 0.3 percent or 18,000 jobs, and the lowest from manufacturing, up 0.1 percent or 14,000 jobs, and financial activities, also up 0.1 percent or 10,000 jobs.
adp-jan

Mark Zandi, chief economist of Moody’s Analytics, said, “Employment posted another solid gain in January, although the pace of growth is slower than in recent months. Businesses in the energy and supplying industries are already scaling back payrolls in reaction to the collapse in oil prices, while industries benefiting from the lower prices have been slower to increase their hiring. All indications are that the job market will continue to improve in 2015.”

ISM Non-Mfg Index
ism-non-man-jan
Recent History Of This Indicator
The composite index from the ISM non-manufacturing survey at 56.2 for December slowed substantially from November’s unusually strong 59.3. Details showed particular slowing in business activity, down 7.2 points to 57.2, followed by slowing in new orders, down 2.5 points to 58.9. A plus was respectable strength for employment, down only 7 tenths to 56.0. Prices paid, reflecting lower fuel costs, fell 4.9 points to 49.5 for the first sub-50 reading since September 2009.
ism-non-man-jan-graph

personal income/spending, labor charts and comments, ISM, construction spending, earnings chart

The mainstream assert that the drop in oil prices is an unambiguous positive for the US economy, as it’s like maybe a $200 billion tax cut for consumers. The idea is that the $ saved on oil products get spent elsewhere, increasing real spending. On the negative side they see the fall in capital expenditures as under $100 billion and hurting only a few consumers but not nearly as many as get helped.

So far the data isn’t showing this happening, at least not in a meaningful way.

What they’ve left out is that falling oil prices only shift income from sellers of oil to buyers of oil, and even nominal spending due to that shift increases only to the extent that buyers of oil spend more of they savings than sellers of oil cut back due to loss of income. Additionally, capex reductions are from lack of potential profits, and not from shifting incomes. Putting all this together there is the reasonable possibility that the drop in oil prices turns out to be an unambiguous negative.

Personal Income and Outlays
eco-release-2-2-1
Highlights
The consumer sector has been volatile on a monthly basis for spending while income growth has been steadier. Meanwhile, inflation has been weak. Personal income grew 0.3 percent in December after advancing 0.3 percent in November. Market expectations were for a 0.3 percent rise. December matched expectations. The wages & salaries component increased a modest 0.1 percent, but followed a jump of 0.6 percent the prior month.

Personal spending decreased 0.3 percent, following a boost of 0.5 percent in November. Analysts projected a dip of 0.2 percent for December.

Durables fell 1.2 percent on a swing in auto sales, following a rise of 1.8 percent in November. Nondurables, tugged down by gasoline prices, decreased 1.3 percent after decreasing 0.3 percent the prior month. Services edged up 0.1 percent, following a 0.5 percent spike in November.

PCE inflation remained weak-largely due to lower energy costs. Headline inflation decreased 0.2 percent on a monthly basis, following a drop of 0.2 percent in November. Forecasts were for a 0.3 percent drop. Core PCE inflation was flat in both December and November. December matched expectations.

On a year-ago basis, headline PCE inflation decelerated to 0.7 percent in December from 1.2 percent the prior month. Year-ago core inflation posted at 1.3 percent in December compared to 1.4 percent in November. Both series remain below the Fed goal of 2 percent year-ago inflation.
eco-release-2-2-2

Note how after tax real income has had two shifts lower and isn’t growing fast enough to ‘catch up.’
eco-release-2-2-3
And nominal after tax income growth has actually slowed recently:
eco-release-2-2-4
Interesting that this slowed!
eco-release-2-2-5

eco-release-2-2-6
eco-release-2-2-7
This may also show business has been ‘over hiring’?
eco-release-2-2-8
New export orders collapse- who would have thought???
;)

And import orders rose bit, also as expected from the shift in oil income.

ISM Mfg Index
eco-release-2-2-9
Highlights
ISM growth had been running hot compared to other manufacturing reports but has slowed down noticeably the last two readings. January’s composite score of 53.5 compares with a revised 55.1 in December and 57.6 in November. October was the fourth quarter’s peak at 57.9.

New orders slowed substantially in January, to 52.9 from 57.8. In contrast, November and October growth in orders was in the low 60s. Weakness in foreign demand is a key factor here as new export orders fell 2.5 points to a sub-50 49.5. This is the lowest export reading since November 2012. Total backlog orders also moved into contraction, to 46.0 for a 6.5 point loss.

Production remained strong in part because of the working down of backlogs. A big headline is prices paid which fell 3.5 points to 35.0 which is very low, the lowest reading since April 2009.

This report is a concern, reflecting weak foreign markets and also troubles in the oil patch. The ISM wasn’t the first to signal slowing but it now heavily underscore prior indications.
eco-release-2-2-10

The chart says it all:

Construction Spending
eco-release-2-2-11
Highlights
Construction outlays rebounded 0.4 percent in December after dipping 0.2 percent the month before. December was below market expectations were for a 0.6 percent gain.

December’s increase was led by public outlays which rebounded 1.1 percent after dropping 1.8 percent jump in November. Private residential spending rose 0.3 percent after edging up 0.1 percent in November. Private nonresidential construction spending eased 0.2 percent in December after a 0.8 percent rise the month before.

On a year-ago basis, total outlays were up 2.2 percent in December compared to 2.7 percent in November.

eco-release-2-2-12

eco-release-2-2-13

Visa on consumer spending, GDP, Consumer sentiment, Greece update, Personal income, Employment costs

Visa quantifies impact to consumer spending from lower gas prices (from its earnings call Thurs night) –

US fuel prices are down ~30% since June. The drop amounts to ~$60/month for the avg. consumer according to our survey. Approximately 50% of the savings are being saved, 25% is being used to pay down debt & ~25% is being spent in other discretionary categories including grocery, clothing & restaurants. As we look forward, we would anticipate the savings will accumulate & ultimately we’ll see more spend in the discretionary categories including higher ticket items (i.e. home improvement, electronics, travel and entertainment)

No sign of ‘acceleration’ here but continues to be operating under the previously discussed macro constraint with regard to the need for agents spending more than their incomes to offset those spending less than their incomes in the context of lower federal deficits. Moreover, the drop in oil prices that has led to a drop in capital expenditures removes what had been the marginal support for even the modest growth we’ve been seeing, and not the reversal of data I highlighted previously as subject to reversal, and the Q4 inventory build should reverse in Q1:

GDP
eco-release-1-30-1
Highlights
The advance estimate for fourth quarter GDP growth disappointed with a 2.6 percent figure versus analysts’ estimate of 3.2 percent and following 5.0 percent for the third quarter.

Final sales of domestic product slowed to 1.8 percent, following a 5.0 percent jump in the third quarter. Final sales to domestic purchasers eased to 2.8 percent from 4.1 percent in the third quarter.

The increase in real GDP in the fourth quarter reflected positive contributions from personal consumption expenditures, private inventory investment, exports, nonresidential fixed investment, state and local government spending, and residential fixed investment that were partly offset by a negative contribution from federal government spending. Imports, which are a subtraction in the calculation of GDP, increased.

The deceleration in real GDP growth in the fourth quarter primarily reflected an upturn in imports, a downturn in federal government spending, and decelerations in nonresidential fixed investment and in exports that were partly offset by an upturn in private inventory investment and an acceleration in PCEs. PCE growth posted at 4.3 percent in the fourth quarter versus 3.2 percent the prior quarter. Inventories rose $113.1 billion, compared to $82.2 billion in the third quarter.

On the price front, the chain-weighted price index was unchanged, compared to the1.4 percent rise in the third quarter. Market expectations were for a 1.0 percent gain. The core chain index, excluding food and energy, eased to 0.7 percent from 1.7 percent in the third quarter.

From the BEA:

eco-release-1-30-15

eco-release-1-30-2
The growth of actual $ spent by people in fact grew at a lower rate, reinforcing the narrative that the ‘consumer savings’ was not being spent. But it also further reinforces my narrative that at the macro level there is no net savings, as for every agent spending less there are other agents getting exactly that much less income.

The first chart is the change in actual $ spent:
eco-release-1-30-3
This second chart is adjusted for inflation, indicating the slower growth in actual dollars spent none the less resulted in a faster growth of ‘real’ purchases. Keep in mind, however, the inflation adjustment methodology is necessarily highly problematic at best with quite a bit of volatility in the short term, so Q1 will likely show a similar reduction in the growth of ‘real’ PCE if oil prices stabilize at current levels:
eco-release-1-30-4
eco-release-1-30-5
eco-release-1-30-6
It’s service prices that tend to be ‘sticky’ so they show ‘real’ increases when the price deflator falls, so interesting how the annual growth rate actually came down some:
eco-release-1-30-7
And spending growth on health care remains low enough to not be a political issue:
eco-release-1-30-8
Again, this is one man one vote, not one dollar one vote, and while more people are saving on fuel than are losing income, which is what is driving the chart, the income losses = the income gains:
eco-release-1-30-9
Regarding Greece, I have no idea how this translates into actual policy proposals:

Varoufakis said he had assured Dijsselbloem that Athens planned to implement reforms to make the economy more competitive and have balanced budgets but that it would not accept a “self-fed crisis” of deflation and non-viable debt.

eco-release-1-30-10
Yes, the growth rate is almost about what it was before, but it would have to grow faster to make up for the lost ground shown above.
eco-release-1-30-12
The only cause for alarm is how low this is:

eco-release-1-30-13

eco-release-1-30-14

ECB, Jobless Claims, Sea Container Counts, Housing Starts, Purchase apps, Architecture Billings, miles driven, Redbook sales, my take on consequences of $50 oil

Like the carpenter with the piece of wood “no matter how much I cut off it’s still too short”

Draghi has yet to realize rate cuts/QE/etc. are a deflationary/contractionary bias:

*DRAGHI SAYS WILL BUY UNTIL SEE SUSTAINED INFLATION IMPROVEMENT

Jobless Claims
claims-1-17
Highlights
Jobless claims have been inching higher and are not pointing to increasing strength for the January employment report. Initial claims did fall 10,000 in the January 17 week but to a 307,000 level that is just outside the high end of the Econoday consensus range (289,000 to 305,000).

The January 17 week is the sample week for the monthly employment report and a comparison with the December sample week shows a sizable 18,000 increase. The current 4-week average at 306,500 is up 6,500 from the prior week for the highest reading since way back in July. A sample-week to sample-week comparison for the average shows a 7,750 increase this month.

Continuing claims, which are reported with a 1-week lag, have also been on the increase. Continuing claims for the January 10 week rose 15,000 to 2.443 million with the 4-week average up 9,000 to 2.427 million. This average has also been on the rise and is up 8,000 from the month-ago comparison. The unemployment rate for insured workers is unchanged at 1.8 percent.
claims-1-17-graph

December 2014 Sea Container Counts Continue to Show Softness in Trade

By Steven Hansen

Export container counts continue to weaken, which is usually awarning that the global economy is slowing. Export three month rolling averages continue to decelerate – being in negative territory year-over-year. However, there are serious labor issues at all West Coast ports, and it is hard to understand the effect on the container counts. One should also consider that exports have been decelerating most of 2014 – well before the labor disputes.
containers

Housing Starts
starts-dec
starts-dec-graph

Permits lead housing:
permits-dec

MBA Purchase Applications
mba-apps-1-16
mba-apps-1-16-graph

private-permits
This isn’t going anywhere:
architecture-billings-index-dec
Miles driving per capital even worse than this:
miles-driven

This isn’t supposed to be soft with the consumer saving so much on gas and oil:
red-book-1-17
So here’s the latest ‘back of the envelope’ mainstream take on oil:

Consumer saves $200 billion, but
Capex down by $100 billion =
Unambiguous Net Gain of $100 billion

Except they all left out the fact that if the consumer is saving $200 billion other agents are losing $200 billion of income.

And that foreign capex that totaled over $500 billion in 2014 is being cut back as well, with some of those cutbacks translating into reduced US exports.

Not to mention the US consumer only spends part of that $200 billion saved, and what is spent on imports doesn’t add to US GDP.

So my back of the envelope remains:

Consumers who save $200 billion spend only $120 billion on domestic output. Agents who lose $200 billion of income cut spending on domestic output by $120 billion That all nets to 0, consistent with weak December retail sales, for example.

Additionally, US capex falls $100 billion, and US exports fall $50 billion, both also supported by recent data releases.

Therefore $50 oil is an unambiguous negative for the US economy.

Jobs, Wages, Wholesale trade

Employment Situation
payrolls-dec
Highlights
The December employment situation was somewhat stronger than expected at the headline level but the payroll numbers softened. In terms of actual numbers, the report was mixed.

Payroll jobs advanced 252,000 after jumping a revised 353,000 in November. Analysts projected a 245,000 gain. October and November were revised up notably by a net 50,000. The unemployment rate decreased to 5.6 percent from 5.8 percent in November. Expectations were for 5.7 percent. Wages actually fell back for the latest month.

Going back to the payroll report, private payrolls increased 240,000 after rising 345,000 in November. Expectations were for 238,000.

Goods-producing jobs jumped in December, led by construction which advanced 67,000 in December after a 20,000 increase the month before. Manufacturing employment increased 17,000, following a jump of 29,000 in November. Mining rose 3,000 in December, following a 1,000 boost the prior month.

Private service-providing jobs gained 173,000 after a 294,000 jump in October. The latest increase was led by professional & business services. Government jobs increased 12,000 after rising 8,000 in November.

Average hourly earnings slipped 0.2 percent in December after gaining 0.2 percent the prior month. Expectations were for a 0.2 percent rise. Average weekly hours were unchanged at 34.6 hours and matched expectations.

The December jobs report was mixed. Payroll gains beat expectations but slowed from November. Wage growth softened. The unemployment rate dipped but partially on a lower participation rate. Still, the labor market is showing overall improvement. However, today’s numbers will only increase debate within the Fed on just how strong or soft the labor market really is.

This chart takes out the ‘demographics’ by looking only at 24-55 year old Americans.

It shows how ‘the problem’ remains a massive shortage of aggregate demand:

payrolls-dec-graph

Not long ago the mainstream raised the alarm that average hourly earnings were ‘accelerating’ and when this happens it doesn’t stop for an average of 4 years, so the Fed better hike now to avoid a serious inflation problem. When I suggested it might roll over this time as it did in 2003, that notions was immediately dismissed:
earnings-dec-1
Maybe higher paying energy jobs being replaced with lower paying fast food, retail, education, and healthcare types of jobs?
earnings-dec-2

Wholesale Trade
trade-nov
Inventories look a bit heavy in the wholesale sector, up 0.8 percent in November vs a 0.3 percent decline in sales that lifts the stock-to-sales ratio to 1.21 from October’s 1.20 and compared to 1.19 in September. Weak sales made for unwanted inventory builds in metals, chemicals, lumber, machinery and farm products.

The nation’s inventories have been steady though today’s report does hint at slowing demand going into year end. Watch for the final data on November inventories in Wednesday’s business inventories report.

I’m suspecting US exports are in the process of declining due to the lower oil price and the weak global economy. Oil producers both have less to spend due to falling revenues and they will also reduce capital expenditures that are no longer profitable.

And while ‘global consumers’ will have more to spend due to falling fuel costs, seems to me that nations other than the US will benefit from that type of spending.

You can see how US exports have rolled over recently:
exports-nov-1

Year over year growth is now near 0:
exports-nov-2

To the point of ‘bad inflation’ in Japan:

Japanese People Feel Their Lives Are Worse Off

Jan 8 (WSJ) — A Bank of Japan survey of more than 2,000 people found that falling real incomes and rising prices have made people feel worse off than at any time in the past three years. About 51% said the comfort of their life has diminished over the past year, while just 4% felt life was getting better. The differential, about 47 percentage points, was the worst level since December 2011, the central bank said. Respondents to the survey also tended to be pessimistic about the year ahead. Nearly 38% said they thought the economy would get worse over the next year. In the previous poll, taken in September 2014, only about 32% thought that. And more than half of respondents said they believed growth in the future would be lower than it is now.