
Like the carpenter with the piece of wood “no matter how much I cut off it’s still too short”
Draghi has yet to realize rate cuts/QE/etc. are a deflationary/contractionary bias:
*DRAGHI SAYS WILL BUY UNTIL SEE SUSTAINED INFLATION IMPROVEMENT
Jobless Claims
Highlights
Jobless claims have been inching higher and are not pointing to increasing strength for the January employment report. Initial claims did fall 10,000 in the January 17 week but to a 307,000 level that is just outside the high end of the Econoday consensus range (289,000 to 305,000).
The January 17 week is the sample week for the monthly employment report and a comparison with the December sample week shows a sizable 18,000 increase. The current 4-week average at 306,500 is up 6,500 from the prior week for the highest reading since way back in July. A sample-week to sample-week comparison for the average shows a 7,750 increase this month.
Continuing claims, which are reported with a 1-week lag, have also been on the increase. Continuing claims for the January 10 week rose 15,000 to 2.443 million with the 4-week average up 9,000 to 2.427 million. This average has also been on the rise and is up 8,000 from the month-ago comparison. The unemployment rate for insured workers is unchanged at 1.8 percent.

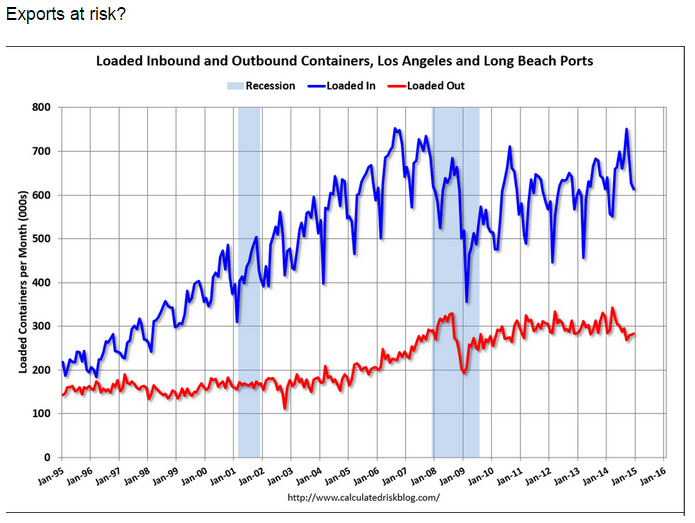
December 2014 Sea Container Counts Continue to Show Softness in Trade
By Steven Hansen
Export container counts continue to weaken, which is usually awarning that the global economy is slowing. Export three month rolling averages continue to decelerate – being in negative territory year-over-year. However, there are serious labor issues at all West Coast ports, and it is hard to understand the effect on the container counts. One should also consider that exports have been decelerating most of 2014 – well before the labor disputes.
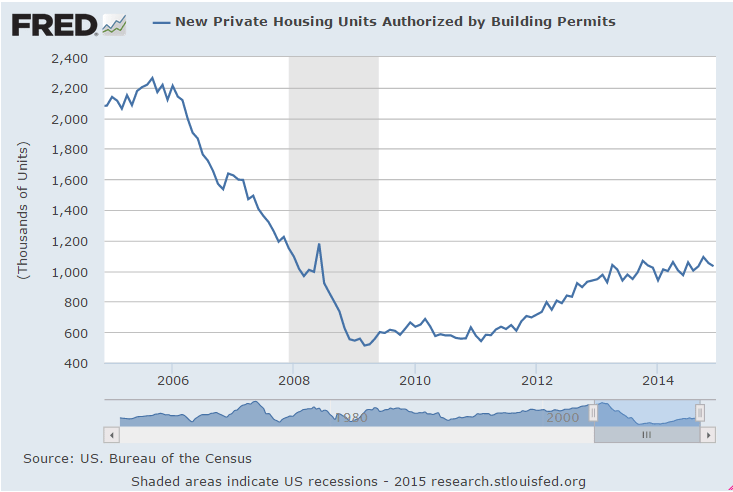
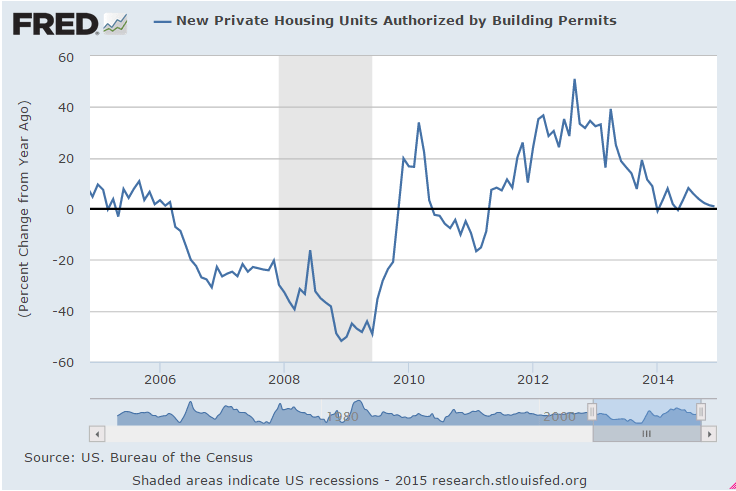
Housing Starts

Permits lead housing:
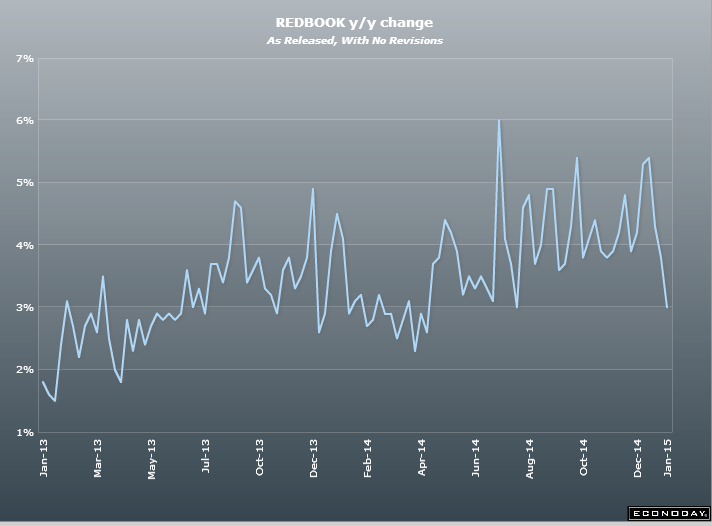
MBA Purchase Applications
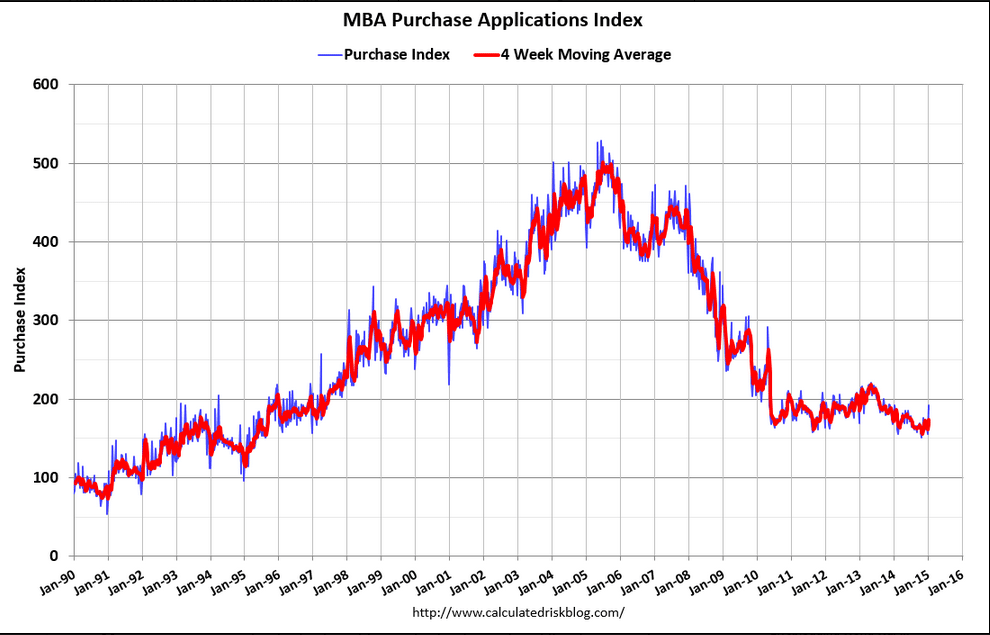
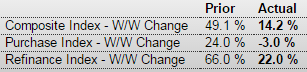
This isn’t going anywhere:
Miles driving per capital even worse than this:
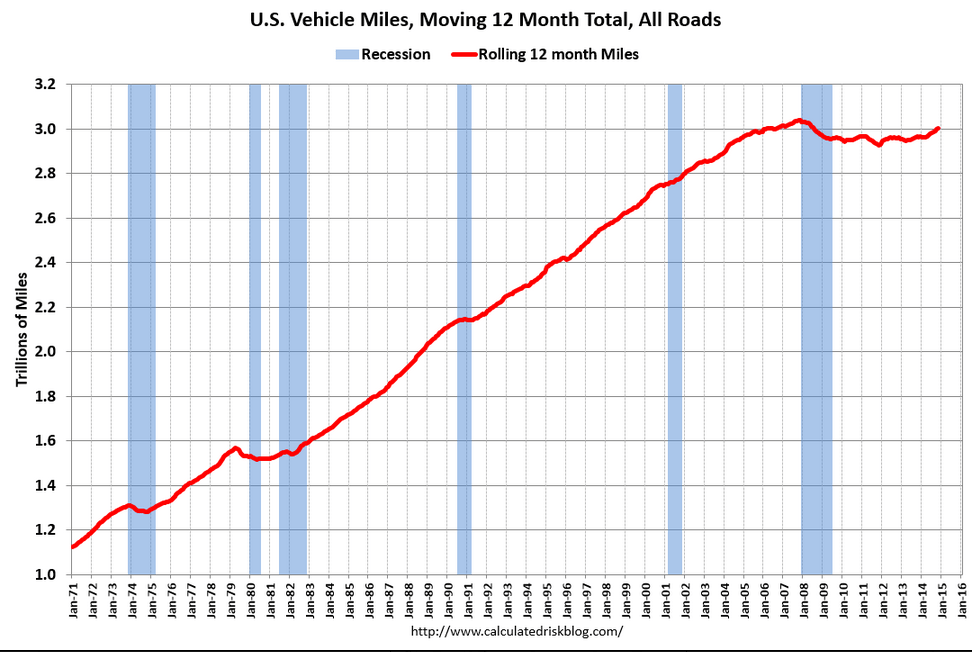
This isn’t supposed to be soft with the consumer saving so much on gas and oil:
So here’s the latest ‘back of the envelope’ mainstream take on oil:
Consumer saves $200 billion, but
Capex down by $100 billion =
Unambiguous Net Gain of $100 billion
Except they all left out the fact that if the consumer is saving $200 billion other agents are losing $200 billion of income.
And that foreign capex that totaled over $500 billion in 2014 is being cut back as well, with some of those cutbacks translating into reduced US exports.
Not to mention the US consumer only spends part of that $200 billion saved, and what is spent on imports doesn’t add to US GDP.
So my back of the envelope remains:
Consumers who save $200 billion spend only $120 billion on domestic output. Agents who lose $200 billion of income cut spending on domestic output by $120 billion That all nets to 0, consistent with weak December retail sales, for example.
Additionally, US capex falls $100 billion, and US exports fall $50 billion, both also supported by recent data releases.
Therefore $50 oil is an unambiguous negative for the US economy.