
This is the Fed’s new indicator:
Labor Market Conditions Index
Definition
The U.S. labor market is large and multifaceted. Often-cited indicators such as the unemployment rate or payroll employment, measure a particular dimension of labor market activity. It is not uncommon for different indicators to send conflicting signals about labor market conditions. The Fed’s research department has created a labor market conditions index (LMCI) based on 19 labor market indicators. It is not an official report. However, the monthly publication is carefully noted by Fed Chair Janet Yellen and has gained market attention.
Misleading at best as the two month average was just that, average:
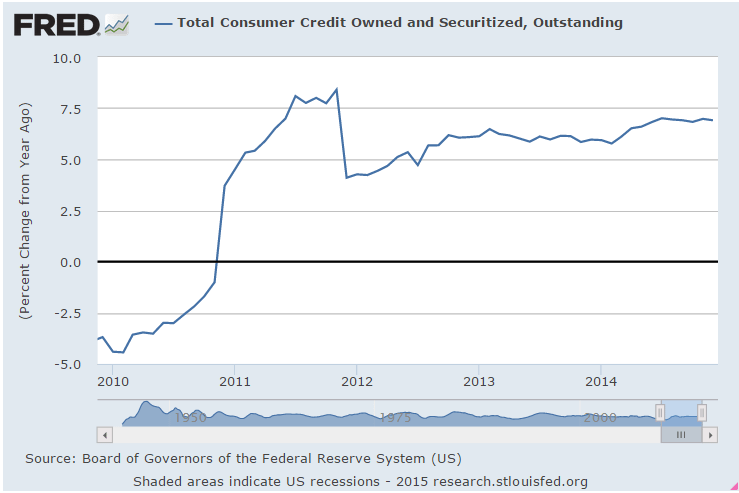
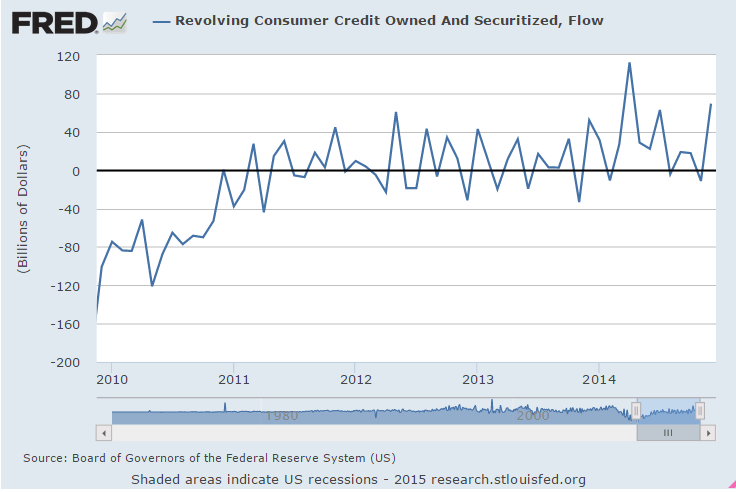
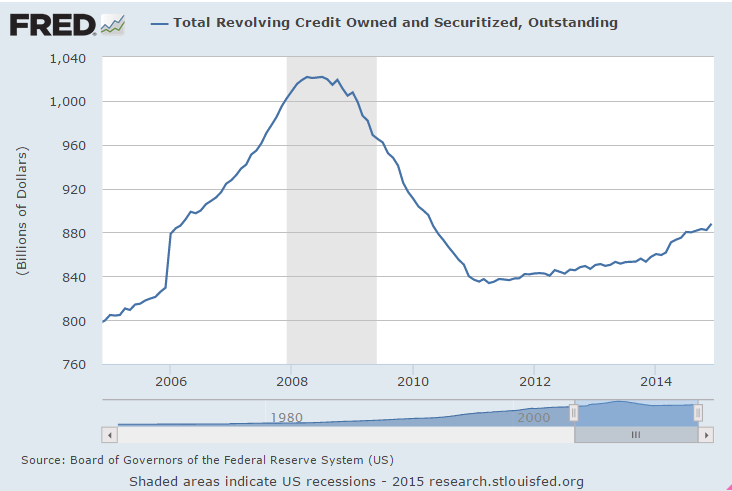
Consumers swipe way to largest increase in revolving credit since March (WSJ) Total outstanding consumer credit expanded at a 5.37% seasonally adjusted annual rate to $3.31 trillion in December. That was a slight acceleration from November’s 4.92% gain. Revolving credit grew at a 7.85% pace in December, a turnaround from November’s 1.28% decline. December’s expansion in revolving credit was the largest since March. Nonrevolving credit, such as auto and student loans, grew at a 4.46% pace during the month, the smallest monthly increase since October 2011. November’s nonrevolving balances grew 7.21%. Revolving credit tends to be volatile, but nonrevolving credit has consistently expanded since August 2011.
No acceleration in growth whatsoever:
The revolving is volatile but doesn’t look to be going anywhere:
January data always suspect but sometimes indicative:
China’s imports slump, capping dismal January trade performance (Reuters) China exports fell 3.3 percent in January from year-ago levels while imports tumbled 19.9 percent. Last year the new year holiday idled factories and financial markets for a week in January, but this year the holiday comes in late February and January was a full month of business as usual. Coal imports dropped nearly 40 percent to 16.78 million tonnes, down from December’s 27.22 million tones. Crude oil imports slid by 7.9 percent in volume terms. While exports to the United States rose by 4.8 percent year-on-year to $35 billion, exports to the European Union slid 4.6 percent to $33 billion in the same period. Exports to Hong Kong, South Korea and Japan were also down, with exports to Japan slumping over 20 percent.
China’s Exports Post Surprise Drop in January (WSJ) Exports fell 3.3% in January from a year earlier, a sharp deterioration from December’s 9.7% rise. In January, exports to Southeast Asia and the U.S. were stronger, while shipments to the European Union, Japan and Hong Kong were all weaker in dollar terms. In a statement accompanying the trade data, China’s customs authorities said that a survey showed weaker confidence among exporters for the fourth consecutive month. “This shows that exports will be facing downward pressure in the first quarter as well as the beginning of the second quarter,” the statement said. Year-ago data for January may have been inflated by over-invoicing by exporters. Exports climbed nearly 11% year over year in January last year.
This is a lot more threatening than I had been led to believe:
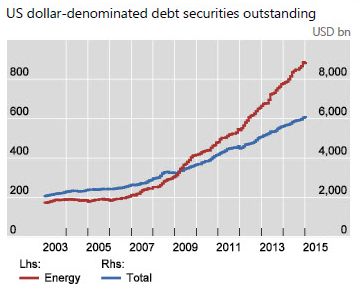
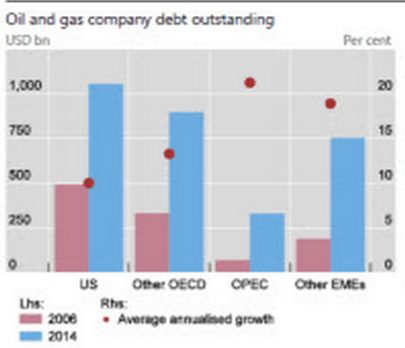
Box: Oil and debt
Note the rate of energy debt growth over the last few years, and that these charts don’t include all energy related debt. Looks to have been about 1% of GDP and added about that much plus ‘multipliers’, filling in for the tax hikes and sequesters of 2013.
And now it’s over.
Two things as price fell in half from $100/barrel.
1. Credit expansion slows and maybe reverses.
2. The value of the collateral behind the loans has been halved, which is highly problematic for the lenders.
These are just initial BIS findings. The full report comes out in March.
And not to forget there’s now a new King of Saudia Arabia who decides what the price will be.