Saudi Oil Production, US Trade, Gallup Index, Redbook Retail Sales, German Manufacturers’ Orders

Their price cuts reported yesterday indicate they’d like to pump more:
er-10-6-1
Gap widening as previously suspected, even with lower oil prices:
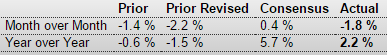
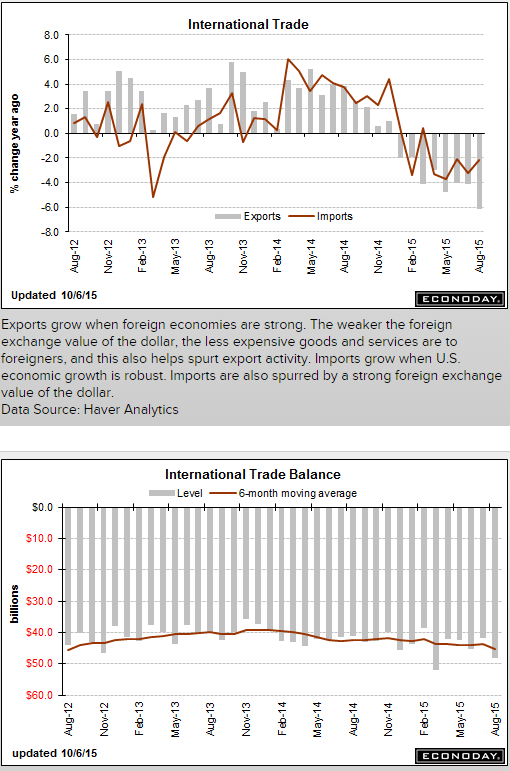
International Trade
er-10-6-2
Highlights
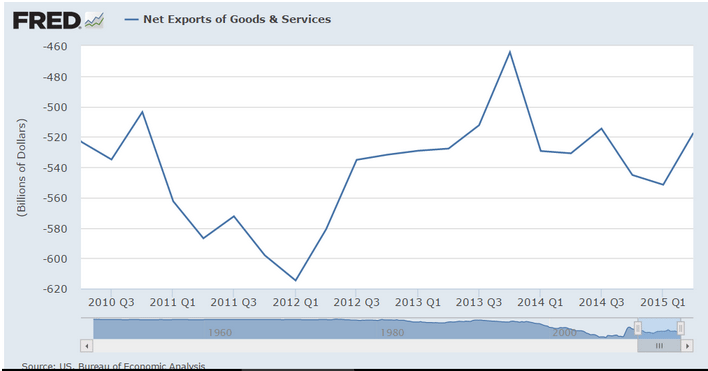
A surge in imports of new iPhones helped feed what was an unusually wide trade gap in August of $48.3 billion, well up from July’s revised $41.8 billion. But cell phones, at $2.1 billion, make up only a portion of the gap with a drop in exports the most salient factor. Exports were down nearly across the board including industrial supplies at minus $2.2 billion, consumer goods at minus $0.6 million, autos at minus $0.5 million, and foods/feeds/beverages at minus $0.3 million. Weakness in exports reflects weakness in foreign demand together with the strength of the dollar.

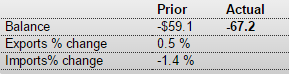
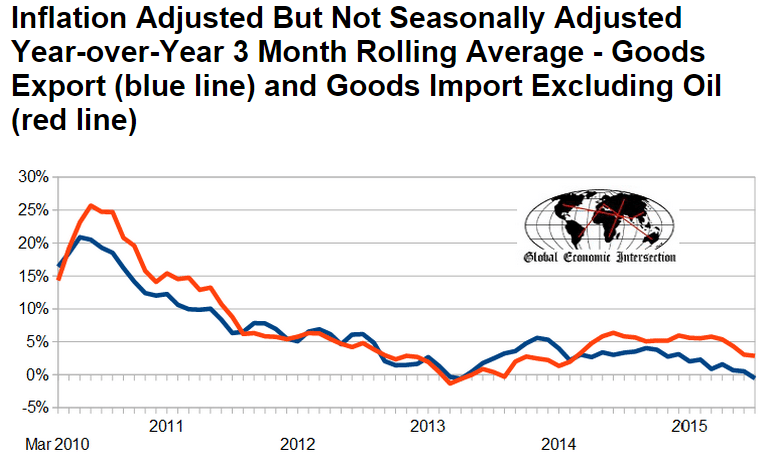
The goods gap came in at $67.9 billion, which is up from last week’s advance reading of $67.2 billion. The petroleum gap, which is always a central factor in the nation’s deficit, fell to $6.9 billion from July’s $8.1 billion and reflects lower prices. Demand for the nation’s services, unlike its goods, continues to climb, to a surplus of $19.6 billion vs $19.5 billion in a reflection of demand for technical and managerial services.

By country, the gap with China, the main source of iPhones, rose sharply, to $35.0 billion from $31.6 billion. The gap with Mexico widened to $5.3 from $3.4 billion. Other bilateral data are mostly steady though the gap with the EU narrowed to $13.8 from $15.2 billion.

Imports are a subtraction on the national accounts but are, nevertheless, a two-way street, that is reflecting demand at home which is a sign of economic strength, not weakness. Still these results will limit expectations for third-quarter GDP.
er-10-6-3
Gallup US ECI
er-10-6-4
Highlights
Unlike other confidence readings that are climbing, Gallup’s reading is holding at lows, at minus 14 in September vs August’s minus 13. The report cites losses in the stock market and disappointing jobs data as negatives, offset by low prices at the gas pump. For current conditions, 24 percent of the sample rates the economy as excellent or good vs 31 percent rating it as poor. For expectations, 38 percent say the economy is getting better vs 58 percent who say it’s getting worse.

Just when you think it can’t get any worse:
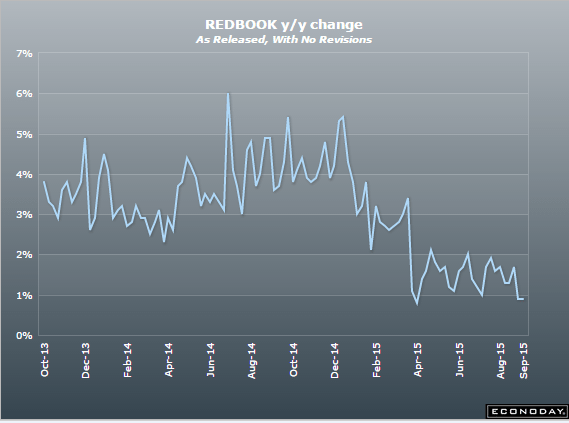
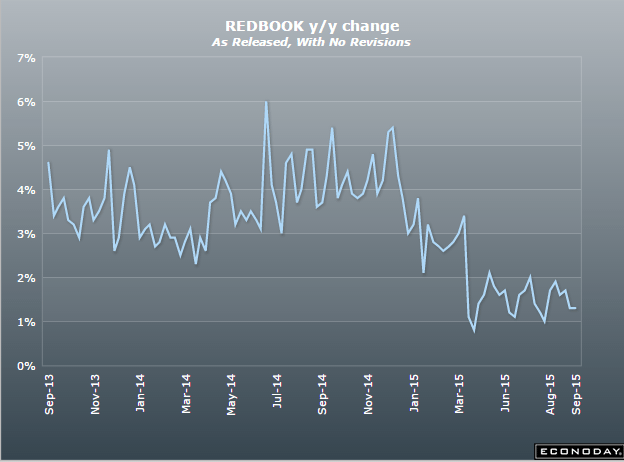
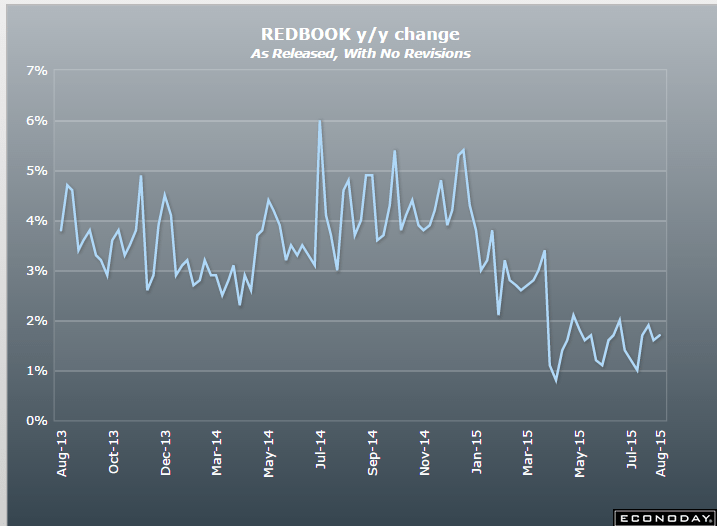
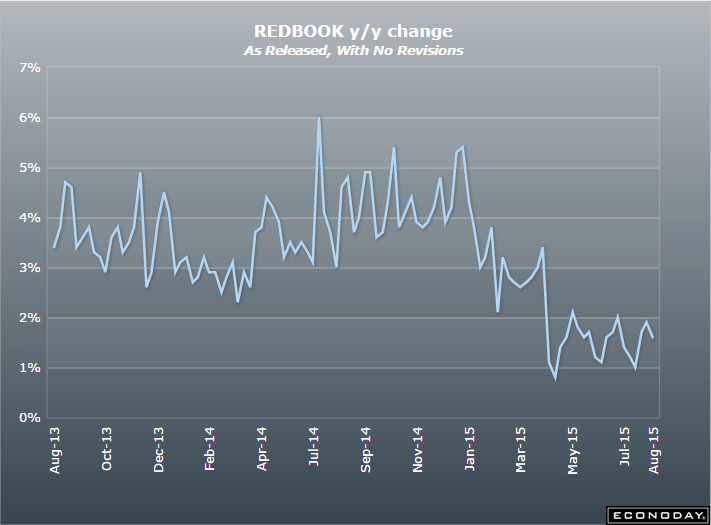
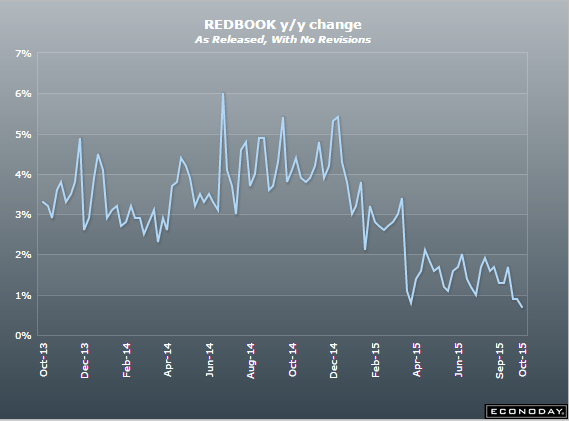
Redbook
er-10-6-5
Highlights
Retail sales are looking very soft based at least on Redbook’s sample which has been reporting, mostly in contrast to solid government data, soft results since way back in March. Same-store sales are up only 0.7 percent for the October 3 week which is the weakest Redbook reading of the year. The report doesn’t offer any meaningful commentary on the weakness but does say seasonally cooler weather is now helping sales at specialty and department stores.
er-10-6-6

Germany under pressure as well:

Germany : Manufacturers’ Orders
er-10-6-8
Highlights
Manufacturing orders were weaker than expected in August. A 1.8 percent monthly fall followed a steeper revised 2.2 percent drop in July and constituted the first back-to-back decline since January/February. However, with orders down a particularly hefty 5.3 percent a year ago, annual growth still rebounded sharply to stand at 2.2 percent.

The monthly decrease was led by capital goods which were down fully 2.8 percent. However, weakness was broad-based as consumer and durable goods dropped 1.5 percent and basics were off 0.4 percent.

Regionally domestic orders contracted 2.6 percent after a 3.7 percent bounce at the start of the quarter and, ominously, have now declined in four of the last five months. Overseas demand fell 1.2 percent, compounding July’s 6.1 percent slump and would have looked a lot worse but for the surprising robustness of the Eurozone component which posted a 2.5 percent gain following a 0.6 percent increase last time. Orders from the rest of the world fell 3.7 percent having already nosedived 10.1 percent in July.

August’s setback means that average total orders in July/August were 2 percent below their mean level in the second quarter. The new manufacturing PMI pointed to solid growth of both output and orders in September but readings here have proved overly strong in recent months. Although early days yet, there are good reasons for supposing that the economic recovery has lost some momentum and hopes for a rebound this quarter are looking somewhat optimistic.

Cartoon, US International Trade, India, Redbook Retail Sales, China Comments, Consumer Confidence

image (3)
As previously discussed, trade deficit increasing:

United States : International trade in goods

dt-9-29-1

Definition
The Census Bureau is now publishing an advance report on U.S. international trade in goods. The BEA will incorporate these data into its estimates of exports and imports for the advance GDP estimates. This is expected to reduce the size of revisions to GDP growth in the second estimates.

Just maybe the higher rates have been supporting the higher inflation? And supporting growth?

India cuts policy rate by bigger-than-expected 50 bps

Sept 29 (Reuters) — The Reserve Bank of India cut its policy interest rate to a 4-1/2 year low of 6.75 percent on Tuesday, in a bigger-than-expected move that, with inflation running at record lows, could help an economy in danger of slowing down.

A Reuters poll last week showed only one out of 51 economists had expected a 50 basis points cut in the repo rate , while 45 had expected a 25 bps cut.

The RBI had previously cut interest rates three times this year, lowering it by 25 basis points each time.

The RBI justified the bigger reduction, saying consumer inflation was likely be running at 5.8 percent, below the 6 percent target for January, thanks partly to the government’s efforts to contain food prices.

Redbook retail sales dismal and dragging along the lows:
image (4)

Barclays analysts visited China and came back saying it was one of the most bearish trips they’ve ever taken

Good number here but not confirmed by sales reports, at least not yet:

Consumer Confidence
dt-9-29-2

Redbook Retail Sales, Richmond Fed, Architectural Index, Mtg Purchase Index, Chemical Activity Barometer, China, Unemployment Duration Chart

No sign of improvement:
er-9-23-1

Bad:

Richmond Fed Manufacturing Index
er-9-23-2
Highlights
Early indications on the September factory sector are negative and now include a minus 5 headline from the Richmond Fed. New orders, unfortunately, are even more deeply in the negative column at minus 12 which points to even weaker activity in the months ahead. Shipments are already in the negative column for a second straight month at minus 3. And manufacturers in the region have already worked down their backlogs to keep up production with backlogs in deep contraction at minus 24 and minus 15 the last two months. Employment is in the plus column but just barely at 3 and it won’t stay there for long if orders and production continue to weaken. Price readings are moderating further to round out an unpleasant picture of unexpected slowing. Last week’s Philly Fed report and especially the Empire State report also pointed to weakness this month. Watch for the manufacturing PMI on tomorrow’s calendar which will give a national look at the September factory sector.

Down as well:
er-9-23-3
Moved up some for the week but as per the chart still drifting a bit lower:
er-9-23-4

Looks like it’s maybe heading south:

September 2015 Chemical Activity Barometer Says Economy Will Continue to Slow

from the American Chemistry Council

The Chemical Activity Barometer (CAB), dropped 0.4 percent in September, following a revised 0.2 percent decline in August. The pattern shows a marked deceleration, even reversal, over second quarter activity. It is unlikely that growth will pick up through early 2016.
er-9-23-5

‘Markit’ reports like this PMI are always suspect but narrative is interesting:

PMI Manufacturing Index Flash
er-9-23-6
Highlights
Growth in Markit’s manufacturing sample remains as slow as it’s been since October 2013, stuck at 53.0 for the September flash. The reading is the same as the final August result and little changed from August’s flash of 52.9. It’s also below the recovery’s 54.3 average.

Growth in new orders is the slowest since January with businesses citing caution among customers and subdued business conditions. Export orders, hurt by weak foreign demand and strength in the dollar, have been very weak this year but did improve slightly in the latest report. Slow orders are leading the sample to slow hiring and trim inventories. The latest gain for employment is only marginal and the weakest since July last year.

Prices are especially weak in the report, showing the first drop in four months for input costs and the first drop in finished goods since August 2012. Fed policy makers, concerned by low inflation, are likely to take special notice.

The 53.0 headline points to more strength than many of the details of the report. Together with the September run so far of regional surveys, the manufacturing sector does not look like it’s having much of a month. Watch for durable goods orders tomorrow for definitive data on August followed by the Kansas City manufacturing update for September.

Fiscal does work if they ‘do what it takes’. Maybe the policies of the western educated kids has been over ruled by their elders?

Production declines further as total new orders fall at faster pace

Sept 23 (Markit) — Flash China General Manufacturing PMI at 47.0 in September (47.3 in August). Manufacturing Output Index at 45.7 in September (46.4 in August). The decline indicates the nation’s manufacturing industry has reached a crucial stage in the structural transformation process. Overall, the fundamentals are good. The principle reason for the weakening of manufacturing is tied to previous changes in factors related to external demand and prices. Fiscal expenditures surged in August, pointing to stronger government efforts on the fiscal policy front.

er-9-23-7

Empire State, Industrial Production, Business Inventories, Retail Sales

Ugly:

Empire State Mfg Survey
er-9-15-1
Highlights
The shocking weakness in August was no fluke as the Empire State index came in far below expectations for September, at minus 14.67. Next only to August’s minus 14.92, September’s reading is the weakest of the recovery, since April 2009. And, unfortunately, judging by new orders, activity in October may prove to be just as weak. New orders are deeply negative this month, at minus 12.91 vs minus 15.70 in August and the fourth straight negative reading. And manufacturers in the New York region won’t be able to turn to backlogs which are extending their long run of contraction at minus 8.25.

Searching for positives in this report is difficult. Negative signs sweep components including shipments, at minus 7.98 following August’s minus 13.79. If extended to national data, these results point to trouble for third-quarter GDP. Employment is at minus 6.19 which is the first negative reading since all the way back in January 2013. The workweek, reflecting the weakness in shipments, is down very steeply at minus 10.31. Price data show outright contraction for finished goods at minus 5.15 — the first negative reading since November 2013. And rounding things out is a 10 point loss in the 6-month outlook to 23.21 which is the weakest since, once again, January 2013.

The negative signals from this report from August were not confirmed by other regional indications but could be confirmed as early as this morning with the August industrial production report. Strength in the auto sector gave manufacturing a lift in June and July but this lift, given weakness in foreign markets and the energy sector, may not have extended too far, at least based on this report.
er-9-15-2

Bad here too, as excess prior inventory building led to production cuts:

Industrial Production
er-9-15-3
Highlights
A reversal in the auto sector pulled down industrial production in August, falling 0.4 percent vs the Econoday consensus for a 0.2 percent decline. The manufacturing component fell 0.5 percent, also deeper than the consensus at minus 0.3 percent. In an offset, gains in July proved more robust than initially reported with total industrial production revised 3 tenths higher to plus 0.9 percent and manufacturing revised 1 tenth higher, now also at plus 0.9 percent.

Motor vehicle production is August’s disappointment, down 6.4 percent following July’s giant 10.6 percent spike. When excluding motor vehicle production, however, industrial production was unchanged in August following respectable gains of 0.3 percent in the prior two months. But these readings are far from spectacular and the weakness in the latest month could be a signal of retrenchment tied to Chinese-based volatility.

Turning to the report’s other two components, utility production rose 0.6 percent in August with mining at minus 0.6 percent. Mining, hit by weak commodity prices, has been hurting all year with the year-on-year reading at minus 3.2 percent. Utilities, however, are up 3.2 percent year-on-year which leads the major components as manufacturing’s year-on-year rate is a soft looking plus 1.4 percent. Total industrial production is up only 0.9 percent year-on-year.

This weakness is reflected in capacity utilization which is at 77.6 percent in the August report, down 4 tenths in the month and 2 tenths lower than consensus. Manufacturing utilization is at a soft 75.8 percent vs an unrevised 76.2 percent in July.

The vehicle-led burst in the manufacturing sector faded noticeably by summer’s end, a reminder that foreign demand for U.S. goods is weak and that the domestic energy sector is suffering. The consumer is the lead horse for the economy, making up for factory slack that the doves are certain to cite at this week’s FOMC.
er-9-15-4

The inventory build was small, but weak sales kept inventory to sales ratio too high.

Note the July inventory build in autos led to the August cutback in production just reported:

Business Inventories
er-9-15-5
Highlights
The nation’s inventories remain slightly on the heavy side, up an as-expected 0.1 percent in July vs a 0.1 percent gain in sales that leaves the stock-to-sales ratio at 1.36, substantially higher than 1.29 a year ago.

Retail inventories rose 0.6 percent in July with the build, however, centered in vehicles which is positive given the strength, evident in this morning’s retail sales report, of strong consumer demand for vehicles. Excluding vehicles, retail inventories rose a manageable 0.2 percent. Building materials rose 0.6 percent which may be a problem given weakness for this component in the August retail sales report. The stock-to-sales ratio for retail is unchanged at 1.46.
er-9-15-6

I don’t see this as good news:

Retail Sales
er-9-15-7
Highlights
For a second report in a row, upward revisions highlight solid growth in retail sales. Retail sales rose 0.2 percent in August with ex-auto at plus 0.1 percent and ex-auto ex-gas at plus 0.3 percent. These are all 1 tenth below consensus. July, however, shows broad upward revisions with total sales at a very strong plus 0.7 percent vs an initial plus 0.6 percent. Ex-auto for July is revised upward by 2 tenths to plus 0.6 percent and ex-auto ex-gas revised upward by 3 tenths to plus 0.7 percent.

Turning first to strength in the August data, motor vehicles rose 0.7 percent on top of July’s 1.4 percent gain. These are very solid readings for a very important component that points squarely at a healthy and confident consumer. Restaurants, another component tied to discretionary health, rose a very strong 0.7 percent to extend a run of gains. On the weak side are gasoline stations where, due to lower gas prices, sales fell 1.8 percent. But this decline actually underscores one of the reasons behind the consumer’s health unlike, however, declines in building materials, down 1.8 percent, and furniture, down 0.9 percent. Yet both of these declines follow very strong gains in the prior month.

Taken together, July and August point to a very strong start to the third quarter for the consumer, a fact that plays into the hands of the hawks at this week’s FOMC. Still, the doves can argue that slowing in August could point to negative effects from China-based volatility.
er-9-15-8

JOLTS, Redbook retail sales, Mexican inflation

More openings, same quits, fewer hires.
Whatever all that means…

United States : JOLTS
er-9-9-2-1
Highlights
Job openings were up sharply in July, to 5.753 million from an upwardly revised 5.323 million in June. The job openings rate rose to 3.9 percent in July following three prior months at 3.6 percent. Professional & business services, which is considered to be a leading component for total employment, led the gains with a 122,000 increase followed by accommodation & food services at 82,000 and retail at 77,000. Despite the rise in openings, the number of hires edged lower to 4.983 million from June’s 5.182 million. The quits rate, which is watched as an indication of worker confidence, was unchanged for a fourth month at 1.9 percent. The rise in openings could definitely be cited by the hawks at next week’s FOMC as a further indication of tightness in the labor market.
er-9-9-2-2

So maybe it wasn’t the central bank that created all that inflation way back when?
;)
er-9-9-2-3

France PMI, Germany PMI, EU PMI, EU Retail Sales, UK service PMI, US Trade, ISM Non Manufacturing, Saudi Pricing

France : PMI Composite
er-9-4-1
Highlights
French private sector activity in August expanded at a significantly slower pace than indicated in the flash report according to the final PMI data for the month. At just 50.2, a 7-month low, the key composite output index was revised down an unusually large 1.1 points versus its preliminary reading to stand 1.3 points below its final July mark and close enough to 50 to signal a period of virtual stagnation in economic activity.

The flash service sector PMI was reduced by 1.2 points to 50.6, also a 7-month trough. As previously indicated, what growth there was reflected stronger new orders and rising backlogs although the growth rate of both hit multi-month lows. Certainly firms were not confident enough to add to headcount although, rather surprisingly, business expectations still climbed to their highest level since March 2012.

Meantime, another increase in input costs saw margins squeezed still further as service provider charges continued to fall.

The final PMI figures suggest that the French economy was really struggling last month. Total output was only flat in the April-June period and the survey data so far suggest little better this quarter.

Germany : PMI Composite
er-9-4-2
Highlights
August’s flash composite output index was revised up a full point to 55.0 in the final data for the month. The new level was 1.3 points above July’s final reading, a 5-month high and strong enough to indicate a solid performance by the economy in mid-quarter.

The adjustment to the composite output gauge came courtesy of the service sector for which the preliminary PMI was revised some 1.3 points firmer to 54.9, also its best reading in five months. New orders rose strongly, backlogs were up and employment posted its largest gain since February. Against this backdrop, business expectations for the year ahead climbed to a 4-month peak.

What little progress they continue to make will evaporate with a strong euro, which I see as inevitable given their trade surplus:

European Union : PMI Composite
er-9-4-3
Highlights
The final composite output index for August weighed in at 54.3, a couple of ticks stronger than its flash estimate and 0.4 points above its final July mark.

The flash services PMI was nudged just 0.1 points higher but, at 54.4, now matches June’s 4-year high. Increased output was supported by rising new orders and a sizeable increase in backlogs which, in turn, helped to ensure that employment growth remained respectably buoyant. Firms also became more optimistic about the economic outlook and business expectations for the year ahead climbed higher following July’s 7-month low. Meantime, inflation developments were mixed. Hence, although higher wages and salaries prompted another rise in input costs, margins were squeezed further as service provider charges declined for a remarkable forty-fifth consecutive month.

Regionally, the best performer in terms of the composite output measure was Ireland (59.7) ahead of Spain (58.8) and Italy (55.0 and a 53-month high). Germany (55.0) also had a good month but France (50.2 and a 7-month low) all but stagnated and remains a real problem for Eurozone economic growth.

The final PMI figures suggest that the Eurozone economy is on course for something close to a 0.4 percent quarterly growth rate in the current period, a slight improvement on the second quarter’s 0.3 percent rate. While this would be good news, faster rates of expansion will likely be needed if inflation is to meet the ECB’s near-2 percent target over the central bank’s 2-year policy horizon.

European Union : Retail Sales
er-9-4-4
Highlights
Retail sales were slightly weaker than expected in August but with July’s decline more than halved, annual growth of purchases still comfortably exceeded the market consensus. Volumes were 0.4 percent firmer on the month after a 0.2 percent drop in June for a workday adjusted yearly rise of 2.7 percent, up from 1.7 percent last time.

July’s monthly rebound was led by a 0.8 percent jump in purchases of auto fuel and without this, non-food sales were just 0.1 percent higher having only stagnated in June. Food recorded a 0.2 percent advance. As a result, overall sales in July were 0.3 percent above their average level in the second quarter when they also increased 0.3 percent.

Regionally the advance was dominated by a 1.4 percent monthly jump in Germany. Spain (0.6 percent) also made a positive contribution but France (minus 0.2 percent) saw its first decline since March. Elsewhere, there were solid gains in Estonia (2.5 percent), Malta and Portugal (both 1.1 percent) but Slovakia (minus 0.2 percent) struggled.

Growth of retail sales has slowed in recent months, in keeping with signs that consumer confidence may have peaked, at least for now. According to the latest EU Commission survey, household morale improved slightly in August but still registered its second weakest reading since January. Consumption may continue to rise over coming months but the signs are that its contribution to real GDP growth will be only limited.
er-9-4-5

I’ve been suggesting exports would slow more than what’s been reported so far, though year over year numbers are in decline. It may show up in revisions down the road:
er-9-4-6

er-9-4-7

International Trade
er-9-4-9

Highlights
The nation’s trade gap narrowed to a nearly as expected $41.9 billion in July following an upward revised gap of $45.2 billion in June (initially $43.8 billion). The improvement reflects a monthly rise of 0.4 percent in exports, which were led by autos, and a 1.1 percent contraction in imports that reflected a decline in pharmaceutical preparations and cell phones which helped offset a monthly rise in imports of oil where prices were higher in July.

Aside from autos, exports of industrial supplies, specifically nonmonetary gold, were strong in July while exports of capital goods also expanded. This helped offset a monthly decline in exports of civilian aircraft and consumer goods. Turning again to imports, other details include a rise in capital goods in what is the latest sign of life for business investment.

By nation, the gap with China widened slightly, to an unadjusted $31.6 billion in the month, while the gap with the EU widened more substantially to $15.2 billion, again unadjusted which makes month-to-month conclusions difficult. Gaps with Mexico and Canada both narrowed.

This report is another positive start to the quarter and will lift early third-quarter GDP estimates. But these will be cautious estimates as recent market turbulence pushes back conclusions and will make August’s trade data especially revealing.

Lower but still indicating ok expansion:
er-9-4-1

Saudi price setting adjustment:

Aramco Cuts All October Crude Pricing to U.S., Northwest Europe

By Anthony DiPaola

Sept 3 (Bloomberg) — Saudi Arabia, the world’s largest crude exporter, cut pricing for all October oil sales to the U.S. and Northwest Europe and reduced the premium on its main Light grade to Asia by 30 cents a barrel.

State-owned Saudi Arabian Oil Co. cut its official selling price for October sales to Asia of Arab Light crude to 10 cents a barrel more than the regional benchmark, the company said in an e-mailed statement. The discount for Medium grade crude for buyers in Asia widened 50 cents to $1.30 a barrel less than the benchmark.

Brent, a global oil benchmark, fell almost 50 percent last year as Saudi Arabia and other OPEC members chose to protect market share over cutting output to boost prices. Brent fell from over $100 a barrel in July 2014 to less than half that six months later. It traded at about $50 on Thursday.

The Organization of Petroleum Exporting Countries led by Saudi Arabia decided on June 5 to keep its production target unchanged to force higher-cost producers such as U.S. shale companies to cut back. The producer group has exceeded its target of 30 million barrels a day since May 2014.

Saudi Arabia reduced production in August to 10.5 million barrels a day, the first decline this year, according to data compiled by Bloomberg.

Dallas Fed, Chicago PMI, Japan Industrial Production, Italy Retail Sales, Comments on GDI and GDP

Shockingly negative:

Dallas Fed Mfg Survey
er-9-31-1
er-9-31-2

Not so good:

Chicago PMI
er-9-31-3
Highlights
The headline for August looks solid, at 54.4 for the Chicago PMI, but the details look weak. New orders and production both slowed and order backlogs fell into deeper contraction. Employment contracted for a fourth straight month while prices paid fell back into contraction. Lifting the composite index are delays in shipments which point to tight conditions in the supply chain. Inventories rose sharply in the month and the report hints that the build, despite the weakness in orders, was likely intentional. But strength is less than convincing and this report suggests that activity for the Chicago-area economy may be flat going into year end.
er-9-31-4

Japan : Industrial Production
er-9-31-5
Italy : Retail Sales
er-9-31-6

Highlights
Retailers had another poor month in June as nominal sales fell 0.3 percent versus May when they declined a slightly steeper revised 0.2 percent. Unadjusted annual growth actually accelerated from 0.1 percent to 1.7 percent but this was due to extra shopping days in this year’s report. Volume purchases were also 0.3 percent lower on the month.

Real gross domestic income (GDI) was up at only a .6% annual rate, only a bit higher than Q1, and in contrast to GDP being up 3.7% for the same quarter. This time looks to me like it’s GDP that’s out of line, as per my narrative where I don’t see any signs of any other sector stepping up and replacing the GDP supported by the now lost oil capital expenditures:
er-8-31-7

er-8-31-8
er-8-31-9
The capital goods sector remains in retreat:
er-8-31-10
Lots of anecdotals don’t jibe with 3.7% growth:

21 August 2015: ECRI’s WLI Growth Index Sinks Slightly More Into Contraction

(Econintersect) — ECRI’s WLI Growth Index which forecasts economic growth six months forward – remains in negative territory. This index had spent 28 weeks in negative territory then 15 weeks in positive territory – and now is in its second week in negative territory.

Rail Week Ending 22 August 2015: Some Improvement But Continued Deterioration Of Year-over-Year Rolling Averages

(Econintersect) — Week 33 of 2015 shows same week total rail traffic (from same week one year ago) marginally expanded according to the Association of American Railroads (AAR) traffic data. Intermodal traffic expanded year-over-year, which accounts for approximately half of movements. but weekly railcar counts continued in contraction.

Lots of reasons to suspect net exports will revert in Q3, or be revised down for Q2 as blips up like this latest one tend to quickly reverse, especially with all the surveys showing exports in retreat:
er-8-31-11
The goods component is looking in full retreat:
er-8-31-12
And the service component of exports isn’t offering any material support either:
er-8-31-13
And the Atlanta Fed’s Q3 GDP forecast of only 1.2% remains well below mainstream forecasts:
er-8-31-14

Redbook retail sales, Inflation adjustment, China, House prices, Consumer confidence

Still depressed
er-8-25-1
Lower than the Fed thought:

U.S. inflation probably lower than reported, Fed study says

Aug 24 (Reuters) — U.S. inflation in the first half of the year was probably “markedly lower” than reported according to the San Francisco Federal Reserve Bank. Researchers at the regional Fed bank had earlier found that the very weak readings for economic growth in the early part of the year were likely due to inadequate adjustments for seasonal fluctuations. The same researchers applied similar methodology to inflation data and found that core PCE inflation was probably overstated by 0.3 and 0.2 percentage points in the first two quarters of the year, respectively.

This does nothing for output and employment:

China’s central bank pumps in billions to ease liquidity strain

Aug 25 (Xinhua) — The People’s Bank of China (PBOC) conducted 150 billion yuan (23.4 billion U.S. dollars) of seven-day reverse repurchase agreements (repo). The reverse repo was priced to yield 2.5 percent, unchanged from the yield on a net injection last week of 150 billion yuan using reverse repos, according to a PBOC’s statement. The PBOC also channelled another 110 billion yuan via its medium-term lending facility. Despite the cash injection the benchmark overnight Shanghai Interbank Offered Rate (Shibor) climbed by 1.3 basis points to 1.879 percent.

Not a good sign:

S&P Case-Shiller HPI
er-8-25-2
Highlights
Inventories may be low and sales rates firm, but both Case-Shiller and FHFA are pointing to a surprising flat spot for home-price appreciation. Case-Shiller’s 20-city adjusted index fell 0.1 percent in June vs Econoday expectations for a 0.1 percent rise. Year-on-year, 20-city prices, whether adjusted or unadjusted, are unchanged at plus 5.0 percent. This rate has been inching higher but looks like it may be ready to fall back unless prices pick up.
er-8-25-3

A bit less than expected and still at very depressed levels:

New Home Sales
er-8-25-4

Settled back to depressed levels from last month’s blip up:

Richmond Fed Manufacturing Index
er-8-25-5

Consumer confidence bounced up with lower gas prices, as it’s one man one vote, not one dollar one vote, and so hasn’t been a reliable indicator of retail sales.
er-8-25-6

housing starts, redbook retail sales

Permits always lead, as there are no starts without permits. And in NY it was the rush to get multi family permits in before June 15 when a tax break expired is what caused the prior surge in permits and some starts as well and is now reversing:

Housing Starts
er-8-18-1
Highlights
Building permits slid sharply in July but reflect in part a plunge in the Northeast where a change in New York City real estate law pulled permits into June at the expense of July. Permits fell 16 percent in July to a 1.119 million annual rate with the Northeast down 60 percent. But permits also fell in the other three regions including a steep 9.9 percent decline in the West. Turning now to starts, they inched 0.2 percent higher to a 1.206 million rate. But the decline in permits, though skewed by the Northeast, points to less strength than expected for the new home market in the months ahead.

A relative positive in the report is less weakness in permits for single-family homes which fell only 1.9 percent. Permits for multi-family homes, which are smaller in size and provide less of a boost to GDP, fell 32 percent. Housing completions came in at a 987,000 pace in the month, up 2.4 percent from June in a positive start for the third quarter.

In sum, this report is on the soft side and doesn’t increase the chances for a September rate hike from the Fed. Initial reaction in the markets is mixed with the resilience in starts offering some offset to the plunge in permits.

None of the retail sales indicators seems to be showing improvement:

Redbook
er-8-18-2
Highlights
Redbook’s sample continues to report soft rates of same-store sales growth, at only 1.6 percent year-on-year in the August 15 week. Sales received some boost from the tail end of tax holidays in a number of states. Despite the soft rate of growth, the month-to-month comparison with Redbook’s sample in July is favorable and hints at incremental strength for core retail sales in August.
er-8-18-3

Retail Sales, Jobless Claims, Import Export Prices, Business Inventories, Japan Machine Orders, Freight Transportation, Gas Prices


This is being touted as a strong report, but, again, looks to me like it’s dropped since year end and at best is moving sideways from there, and not to forget that a large share of auto sales are imports.

But I do agree the Fed is heck bent on raising rates in Sept, even without ‘some’ improvement, and will do so unless there’s a stock market decline severe enough to hold them back. So far that’s not happening.

Retail Sales
er-8-13-1

Highlights
Big upward revisions underscore a very solid and very important retail sales report. Retail sales rose 0.6 percent in July with June revised to unchanged from an initial reading of minus 0.3 percent and with May revised to a jump of 1.2 percent from 1.0 percent. The revisions to June and May point to an upward revision for second-quarter GDP.

Vehicle sales, as expected, were the standout in July, jumping 1.4 percent to nearly reverse June’s 1.5 percent slide and nearly matching May’s historic 1.9 percent surge. But even outside vehicles, retail sales were strong with the ex-auto reading rising a solid 0.4 percent. Restaurants, in another strong signal of consumer strength, rose an outsized 0.7 percent following June’s 0.5 percent gain. These are very strong gains for this component. Excluding both vehicles and gasoline, retail sales rose 0.4 percent, again another solid reading.

Strength in both vehicles and restaurants point to the health of the US consumer and will likely give the hawks the courage, despite all the troubles in China, to push for a rate increase at the September FOMC.

er-8-13-4

er-8-13-5

er-8-13-6

er-8-13-7

er-8-13-8

er-8-13-9

Tough times for department store sales continue, which explains some of the weakness in construction:

er-8-13-10

‘Some’ deterioration:

Jobless Claims
er-8-13-11

‘Some’ deterioration for Fed hopes of higher inflation. It’s been failing to hit its target for longer than I can remember…

er-8-13-12


Excess inventory building in June helps Q2 GDP but the likely subsequent production cuts will hurt Q3. The now persistently too high inventory to sales ratio is overdue for a correction:

United States : Business Inventories
er-8-13-13

Highlights
Inventories rose relative to sales in June but the news isn’t that bad given that the build was centered in autos. Business inventories rose 0.8 percent in June which was well ahead of a 0.2 percent rise in sales. The mismatch lifts the inventory-to-sales ratio to 1.37 from 1.36.

But retail inventories at auto dealers were to blame, up 1.4 percent in June and contributing to a 0.7 percent rise for the retail component. Inventories at manufacturers and wholesalers, the two other components of the business inventory report, also rose, up 0.6 and 0.9 percent respectively.

Inventories are on the heavy side but the concentration in autos is welcome given how strong sales are, evidenced by the 1.4 percent surge for the motor vehicle component of the July retail sales report released earlier this morning. Note that this report, along with the retail sales report, are likely to lift revision estimates for second-quarter GDP.

er-8-13-14

Global weakness continues:

Japan : Machine Orders
er-8-13-15

Highlights
June seasonally adjusted machine orders (excluding volatile items) declined for the first time since February. They dropped a larger than anticipated 7.9 percent on the month and were up 14.7 percent on the year. Core orders were up 16.6 percent based on the original series. This was in contrast to expectations of a 17.5 percent increase.

Core machine orders are considered a proxy for private capital expenditures. The downward move followed a 0.6 percent gain a month before. The government repeated its assessment that machine orders would advance in the third quarter.

Nonmanufacturing orders excluding volatile items were up 5.0 percent while manufacturing orders dropped 14.0 percent. All orders including volatile items dropped 6.2 percent on the month. Manufacturing orders likely softened on continued weaker export demand while the sluggish domestic economy weighs on nonmanufacturers.”

Another weak looking index:

er-8-13-16


And I’d call this ‘some’ deterioration in the ‘labor market’. Looks like it was weakening before the 2014 oil capex boom supported it, and then has fallen off since the oil price collapse:

er-8-13-17


This is to the point I’ve been making that surveys are one man one vote, not one dollar one vote, so optimism remained high even as retail sales, for example, were fading. Yes, a lot more people saved $10 per week on gas but an equal amount of income was reduced for sellers of oil, including those earning royalties and holding leases, and investors of all sorts, and seems the spending cuts on domestic product by that group outweighed the additional spending from pump savings.

Fueled by low pump prices, U.S. motorists to drive more in August – survey

By Jarrett Renshaw

August 11 (Reuters)

U.S. motorists are paying an average of $2.58 per gallon, nearly a dollar less than a year ago, according to AAA, the nation’s largest motorist advocacy group. And a quarter of respondents expected prices to continue to decline, up from 10 percent a month ago.

The survey found that nearly 80 percent of people say gas prices influence how they feel about the economy. And with gas prices down nearly $1 from a year ago, U.S. motorists are feeling positive about the direction of the economy, the survey found.

“There is good news for retailers as consumer optimism picks up during peak vacation season,” said NACS Vice President of Strategic Industry Initiatives Jeff Lenard.