ADP, ISM non manufacturing, Interview, Saudi output, credit chart, Inflation chart, claims chart, Mueller team news

Lower than expected and last month revised lower:

Highlights

ADP sees June private payrolls rising 158,000 which misses Econoday’s ADP consensus of 180,000. Econoday’s consensus for actual private payrolls in Friday’s employment report is 164,000 which isn’t likely to shift following ADP’s results. Estimates this year from ADP have been hit and miss with a wild upside miss in May.

Decent number for this survey but still reflects trumped up expectations:

Highlights

ISM’s non-manufacturing sample continues to report extending strength with the index up 5 tenths in June to 57.4 which tops Econoday’s high estimate for 57.1. New orders, at 60.5, remain unusually strong with backlog orders, at 52.0, also rising in the month. New orders for export, at 55.0, are also up solidly though to a lesser degree than domestic orders.

Employment growth is very solid at 55.8 but is down slightly from May’s unusually strong 57.8 in results that won’t disturb expectations for improving strength in tomorrow’s employment report. Business activity (output) is very strong at 60.8 with inventories, at 57.5, on the rise in further confirmation of the sample’s confidence.

The strength in this report continues to be impressive but has yet to pan out to similar strength in government data.

My recent radio interview:

https://soundcloud.com/financialexchange/warren-mosler-2

Saudi output shows they remain swing producer and price setter:

Another way to look at where we might be in the cycle:
https://twitter.com/northmantrader/status/882670288177172480

Mtg purchase apps, Vehicle sales, Oil capex, Business equipment borrowing, Equipment sales, New home sales

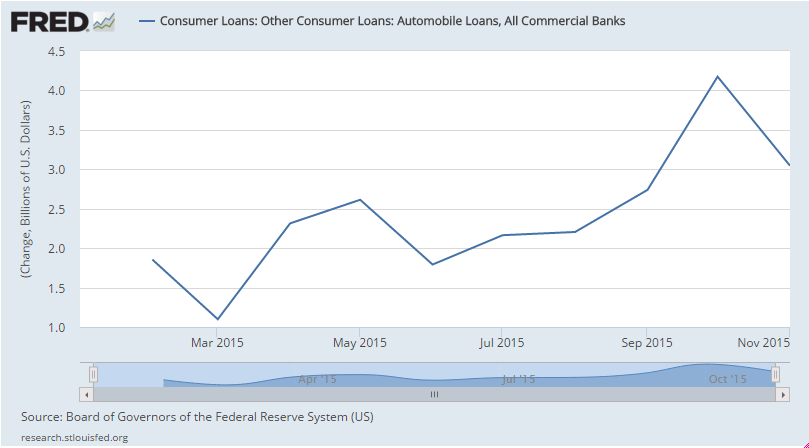
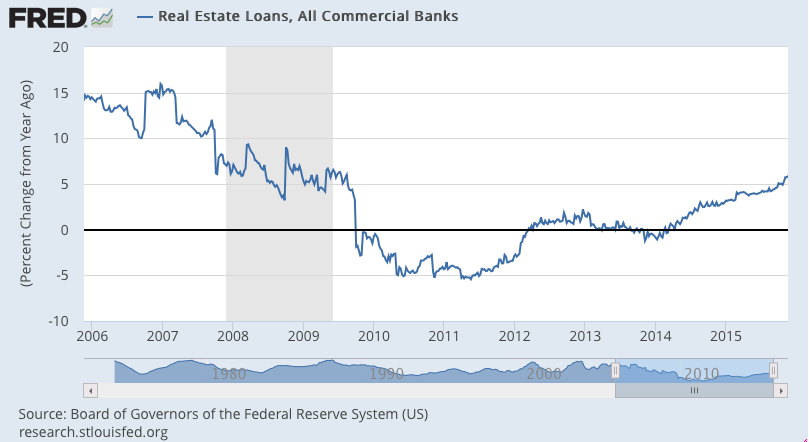
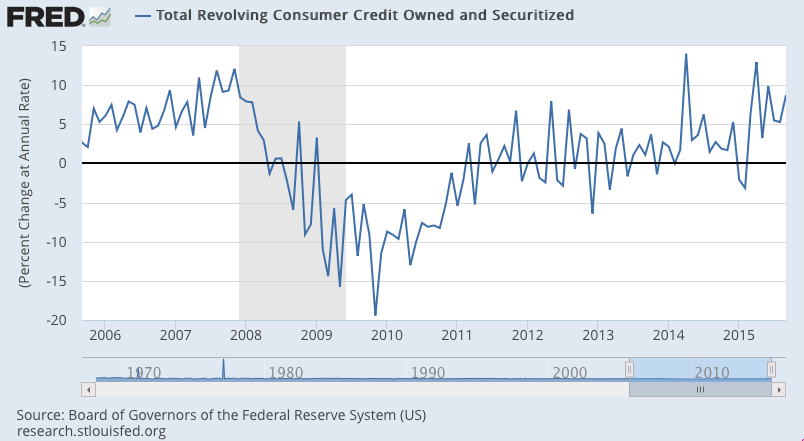
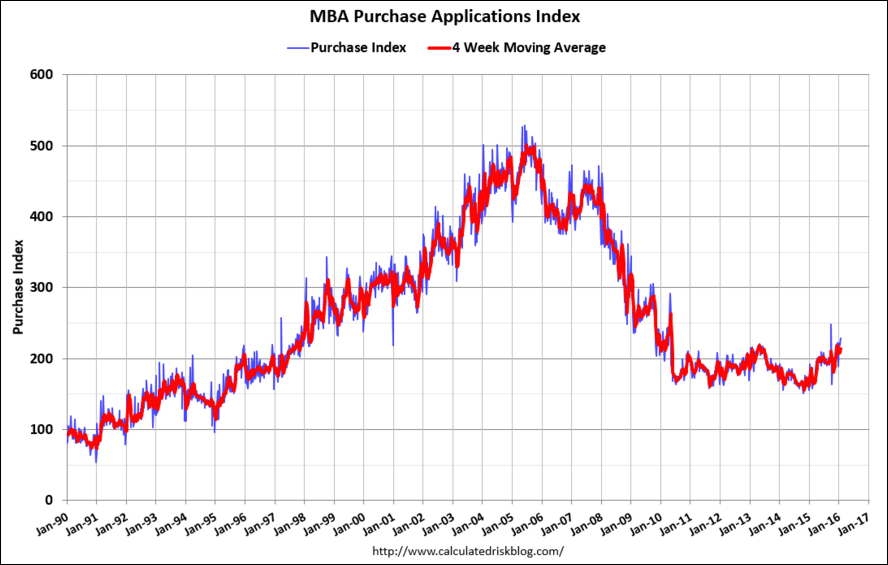
Inching up a bit but still seriously depressed:

MBA Mortgage Applications
er-1-27-1
Highlights
Weekly mortgage applications have been very volatile so far this year but mostly to the upside. Purchase applications jumped 5.0 percent in the January 22 week with refinancing applications up 11.0 percent. Low mortgage rates are driving the activity, down 4 basis points in the week to an average 4.02 percent for 30-year conforming loans ($417,000 or less).
er-1-27-2

Looks like Wards is forecasting no improvement in the annual selling rate that has been decelerating from over 18 million per year for the last several months:

Forecast: January SAAR Set to Reach 10-Year High

A WardsAuto forecast calls for U.S. automakers to deliver 1.13 million light vehicles in January.

The resulting daily sales rate (DSR) of 47,126 units, a 10-year high for the month, over 24 days represents a 6.8% improvement from like-2015 (26 days) and a 19.2% month-to-month decline from December (28 days).

The 5-year average December-to-January decline is 26%, but the traditional pull-ahead of sales in December was not as strong as expected this time. Lighter deliveries allowed dealers to remain well-stocked with vehicles highest in demand going into January.

The report puts the seasonally adjusted annual rate of sales for the month at 17.3 million units, compared with a year-ago’s 16.6 million and December’s 17.2 million.

US shale firms, struggling to profit with US$30 oil, slash spending more

Three major U.S. shale oil companies have slashed their 2016 capital spending plans more than expected in a bid to survive $30 a barrel oil prices, with one of them saying prices would need to rise more than 20 percent just to turn a profit.

The cuts on Monday from Hess Corp, Continental Resources and Noble Energy ranged from 40 percent to 66 percent. This marks the second straight year of pullbacks by a trio of companies normally seen as among the most resilient shale oil producers.

The cuts were steeper than expected. Analysts at Bernstein Energy had forecast an average 2016 spending cut for the sector of 38 percent.

The reductions show budgets may shrink more this year than they did last year, when spending fell between 20 percent and 50 percent. Output at some companies may fall for the first time ever.

“It’s very rare to have spending decline two years in a row,” said Mike Breard, oil company analyst with Hodges Capital Management in Dallas. “Any budget you see published now is going to be much lower than last year.”

But last year many operators managed to lift output as they devised new ways to coax more oil from rock, a feat that seems unlikely to be repeated.

In a sign that a reckoning has come, Continental admitted it will pump about 10 percent less oil this year as it can no longer afford or innovate and sell more oil at depressed prices.

The U.S. government projects domestic crude output to fall by about 700,000 barrels per day (bpd) by the end of this year to around 8.5 million bpd.

Depressed spending typically means fewer drilling rigs. All three companies said they would cut the number of rigs boring new wells in U.S. shale oil fields across Texas, North Dakota and elsewhere.

“If you cut your budget 60 percent, you may drill 40 percent fewer wells and your production is going to drop a considerable amount,” said Breard.

Continental, North Dakota’s second-largest oil producer, said it would slash its 2016 capital budget by 66 percent. The company made the risky move of getting rid of hedges in the fall of 2014. [L2N15A2MB] Led by billionaire wildcatter Harold Hamm, Continental plans to spend $920 million this year, down from $2.7 billion in 2015.

Oklahoma City-based Continental said it will not become profitable until oil prices return to $37 per barrel. U.S. oil prices closed Tuesday at $31.45 per barrel.

Meanwhile, New York-based Hess plans to spend $2.4 billion in 2016, down 40 percent from $4 billion last year.

Noble cut its quarterly dividend 44 percent and said it will cut spending about 50 percent this year.

On the other end of the spectrum, Pioneer Natural Resources, known for its aggressive hedging program, said this month it would spend between $2.4 billion and $2.6 billion this year.

Though Pioneer will fund its 2016 budget in part from a $500 million asset sale, the modest increase from $2.2 billion in 2015 makes the company a relative outlier at a time when most companies are trimming capex by amounts similar to last year’s drastic cutbacks.

U.S. business borrowing for equipment falls in December: ELFA

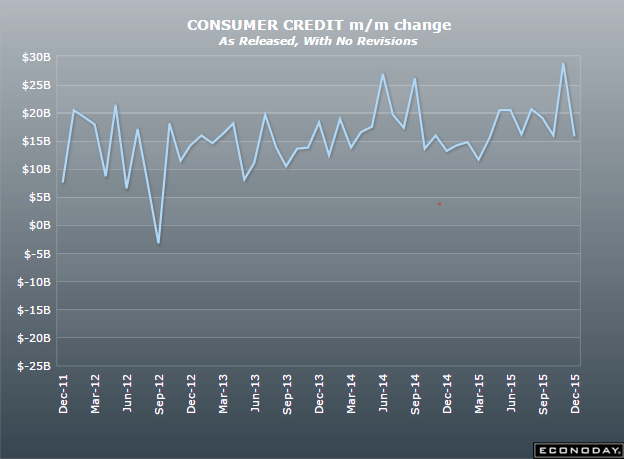
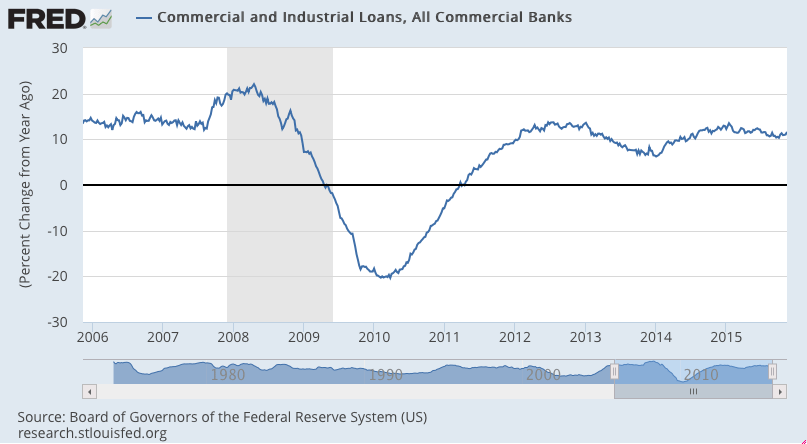
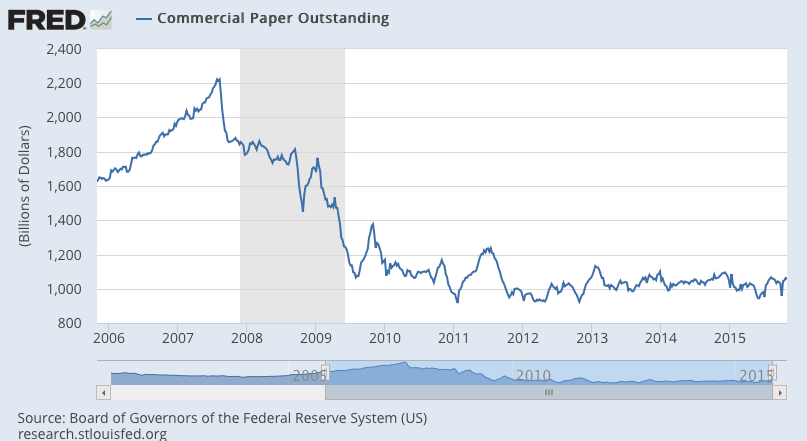
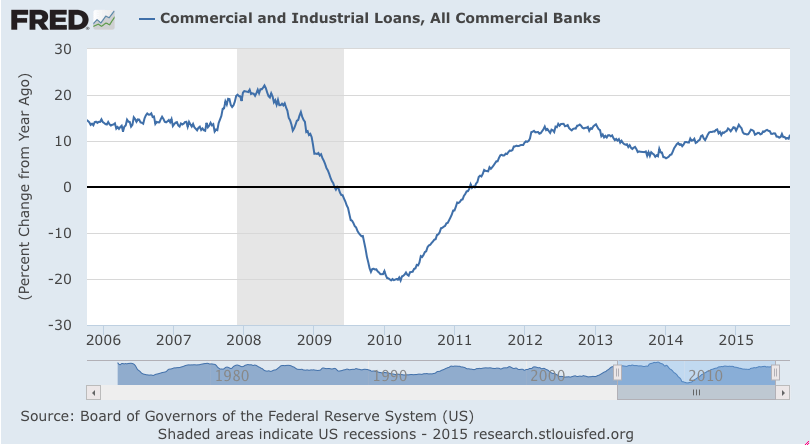
Borrowing by U.S. companies to spend on capital investment declined 5 percent in December, trade association Equipment Leasing and Finance Association (ELFA) said.

Companies signed up for $12.5 billion in new loans, leases and lines of credit last month, less than a year earlier, but more than double from November, ELFA said.

Cumulative new business volume inched up 0.4 percent for 2015, relatively flat with 2014, ELFA said

Caterpillar warns equipment sales still falling

Caterpillar saw retail sales of machinery fall 16 percent worldwide for the three-month period ended in December, the construction and mining equipment company said on Wednesday.

Caterpillar, which is due to report earnings on Thursday, has been pressured by the global slowdown in the energy and mining industries.

The company said retail sales to resource industries worldwide fell 38 percent over the three-month period, while retail sales to the energy industries fell 32 percent.

The pace of declines is also increasing, the company noted in an SEC filing. The worldwide decline in retail sales of machines had been 11 percent for the three months ended in November.

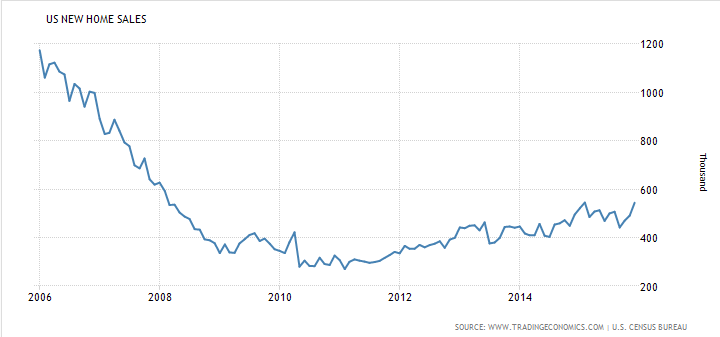
New home sales better than expected, but still near the lows of prior recessions all the way back to the 1960’s when the population was about 60% of what it is now:

New Home Sales
er-1-27-3
er-1-27-4

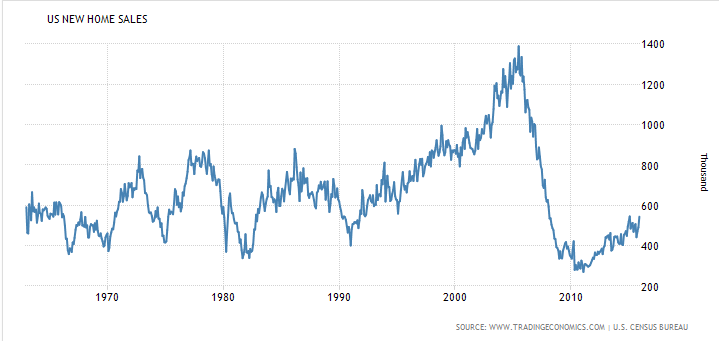
This is just the last 10 years:
er-1-27-5

Consumer Credit, Oil comment

Looks like the last blip up just got reversed so it continues to go nowhere and it’s at levels higher than before the last recession:

Consumer Credit
er-12-7-6
Highlights
Revolving credit barely made it into the plus column in October, up $0.2 billion for what is, however, an eighth straight gain. Non-revolving credit, which in contrast to revolving credit hasn’t posted a decline since April 2010, rose an intrend $15.8 billion, once again boosted by vehicle financing and also by student loans which are tracked in this component. But the gain on the non-revolving side couldn’t offset the flat result for revolving credit as total consumer credit rose a lower-than-expected $16.0 billion in October. The slowing in the revolving component may not be pointing entirely to consumer caution but may reflect a lack borrowing demand given the strength in the jobs market and the savings rate and also of course low gas prices which are leaving more money in consumer pockets. Still, the pause for revolving credit won’t be lifting expectations for holiday spending.

er-12-7-7
er-12-7-8

No telling how low prices will go before Saudi sells their entire output capacity estimated at 12 million bpd. Right now they are at 10 million bpd and prices have to go low enough for other suppliers to cut back or demand to increase. And here comes Iran:

“It is going to be 12 to 18 months before they see any relief,” David Fyfe, from the oil trading group Gunvor, said.

“We think oil stocks will continue to build in the first half of next year and we don’t think they will draw down to normal levels until well into 2017.”

Mr Fyfe said Iran has 40m to 50m barrels floating on tankers offshore that will flood onto the market as soon as sanctions are lifted. It will then crank up extra output to 500,000 b/d by the end of next year.

Rail traffic, Credit check, Employment flows, State and local taxes and expenditures

Rail Week Ending 28 November 2015: Contraction Growing Faster. Rail Traffic in November Down 10.4%.

Week 47 of 2015 shows same week total rail traffic (from same week one year ago) declined according to the Association of American Railroads (AAR) traffic data. Intermodal traffic contracted year-over-year, which accounts for approximately half of movements and weekly railcar counts continued in contraction. The 52 week rolling average contraction is continuing to grow. Rail counts for the month of Novembers showed a significant contraction.

Looks like the growth in car loans has been slowing?
er-12-5-11

er-12-5-10

er-12-5-9

Same here?
er-12-5-8
Real estate loan growth has been moving up even as total loan growth has not.

Perhaps banks are increasingly demanding real estate as collateral from borrowers:
er-12-5-7

er-12-5-6

Consumer loan growth has also increased a bit even as total loan grow has not:
er-12-5-5
So this is interesting- looks like approximately 4 million people who were not considered in the labor force, and therefore not counted as unemployed, have been getting jobs every month…
er-12-5-4
And also each month over 4 million people have left their jobs and left the labor force and are therefore not considered unemployed:
er-12-5-3
Lower growth of state and local govt tax receipts indicates lower growth of private sector spending as well as lower growth of state and local spending, which has already been low:
er-12-5-12

er-12-5-1

Credit check

Nothing of consequence here. Growth still below prior cycles and not accelerating as it was beginning to do before oil capex collapsed:
er-11-30-1
er-11-30-2

While growth of real estate lending is still far below the prior cycle, it has been increasing, probably due to fewer ‘all cash’ purchases, and the modest recovery in prices and sales:
er-11-30-3
Consumer credit growth remains modest and, if If anything, is softening most recently:
er-11-30-4
er-11-30-5
er-11-30-6

Looks to me like car loan growth is slowing a bit:
er-11-30-7
er-11-30-8

Consumer Credit, Credit Check, Rail Traffic, Employment Charts

Consumer Credit

er-11-7-20

Highlights
In a record report, consumer credit data are strongly confirming the strength of the consumer. Credit outstanding surged $28.9 billion in September for the largest gain in the history of the series which goes back to 1941. Nonrevolving credit, in part reflecting vehicle financing and also student loans, rose $22.2 billion. Revolving credit, reflecting a rise in credit-card debt, jumped $6.7 billion to extend an emerging run of strength that suggests consumers are now less reluctant to run up their credit cards which, for retailers certainly, is a good omen for the holidays.

er-11-7-19

Hard to detect anything happening here except some volatility and maybe consumers borrowing more in response to low personal income growth?
er-11-7-18

er-11-7-17

er-11-7-16

er-11-7-15

er-11-7-14

Fed rate hikes are meant to slow credit growth.

I don’t see any credit growth they’d want to be slowing?
er-11-7-13

er-11-7-12

This has recently flattened at grow rates associated with the last recession:
er-11-7-11

er-11-7-10

er-11-7-9

Rail Week Ending 31 October 2015: Monthly Data Now Contracting 4.3% Year-over-Year

Week 43 of 2015 shows same week total rail traffic (from same week one year ago) and monthly total rail traffic (from same month one year ago) declined according to the Association of American Railroads (AAR) traffic data. Intermodal traffic contracted year-over-year, which accounts for approximately half of movements. and weekly railcar counts continued in contraction. October 2015 is down 4.3% over October 2014.

Yes, this earnings measure did pop up some, but way behind prior cycles and just a one month move at this point. The 2014 move they were worried about reversed itself before it got anywhere near ‘danger’ levels, whatever that actually means:
er-11-7-8
Again, a one month move that could just as easily reverse next month, and in any case far from posing any kind of problem to ‘inflation’ or employment (the Fed’s mandates):
er-11-7-7
And this is from the GDP report:
er-11-7-6
This was just starting to begin to recover when the oil price collapse bent the curve downward:
er-11-7-5

er-11-7-4

No ‘demographic’ effect here, just weakness:
er-11-7-3

er-11-7-2

This also began decelerating when oil capex collapsed:
er-11-7-1

Rail traffic, Personal Income, Credit Check

Rail Week Ending 24 October 2015: A Worse Week Among Bad Weeks

Week 42 of 2015 shows same week total rail traffic (from same week one year ago) and monthly total rail traffic (from same month one year ago) declined according to the Association of American Railroads (AAR) traffic data. Intermodal traffic contracted year-over-year, which accounts for approximately half of movements. and weekly railcar counts continued in contraction.

See how the growth rate slowed down just before year end?
er-10-31-1
er-10-31-2
er-10-31-3
Growth peaked when oil peaked?

er-10-31-4
er-10-31-5

Truck tonnage, Philly Fed Coincident Index, ECB policy, Credit Check

Signs of stabilizing:
er-10-25-1
er-10-25-2

So the ECB threatened more negative rates and QE, both placebos at best, analogous to spraying the crowd with a barrage of blanks, which nonetheless dispersed the crowd. However, with the record and growing euro area 31 billion trade surplus last month and a growing US trade deficit augmented by increased petro imports as domestic production falls, I expect those fundamentals to dominate:
er-10-25-3

Interesting how growth that supported GDP in 2014 peaked as oil price broke down:
er-10-25-4
This new indicator now shows 2 weeks flattening, but not enough history to make a call based on it:
er-10-25-5
This, too, changed slope after oil supported growth reversed:
er-10-25-6
The growth rate remains historically very low (particularly given the ultra low rates?). Some of the increase is due to the drop in ‘all cash’ purchases, some due to the higher sales prices, etc.
er-10-25-7

The growth rate has picked up some as it tends to do when entering a recession and consumers borrow extra for a while as incomes are stretched before breaking:
er-10-25-8

Credit check, ECRI WLI Growth Index, Rail Week

Still no sign of acceleration:
cc-10-17-1
cc-10-17-2
cc-10-17-3
Though still how historically, the growth rate in real estate secured lending has picked up some, probably reflecting fewer cash buyers and the modest increases in sales:
cc-10-17-4
This is up some as well. Note that it went up gradually into the last recession, probably because when things go bad people borrow for a while before cutting back:
cc-10-17-5
This is a new series. The latest leveling off might be an indication that the mini surge in car sales is over?
cc-10-17-6

ECRI’s WLI Growth Index Declines and Remains In Contraction

Oct 16 — ECRI’s WLI Growth Index which forecasts economic growth six months forward – declined and remains in negative territory. This index had spent 28 weeks in negative territory, then 15 weeks in positive territory – and now is in its ninth week in negative territory.

Rail Week Ending 10 October 2015: Recession In Rail Continues

Oct 16 — Week 40 of 2015 shows same week total rail traffic (from same week one year ago) and monthly total rail traffic (from same month one year ago) declined according to the Association of American Railroads (AAR) traffic data. Intermodal traffic moderately expanded year-over-year, which accounts for approximately half of movements. but weekly railcar counts continued in contraction.

Consumer Credit

Now looking like this peaked as oil prices collapsed:

Consumer Credit
er-10-7-3

Highlights
Revolving credit continues to show life, up a solid $4.0 billion in August for a sixth straight gain. Gains in this reading, which have been scarce this recovery, perhaps suggest that consumers are growing less reluctant to run up their credit cards, which would be good news for retailers going into the holidays. Non-revolving credit, driven by both vehicle financing and student financing which is tracked in this component, rose $12.0 billion to make for a headline increase of $16.0 billion.

United States Consumer Credit Change

Consumer Credit in the United States increased by 16.02 USD Billion in August of 2015, following a downwardly revised 18.94 USD Billion in the previous month and below market expectations. Consumer Credit in the United States averaged 4.38 USD Billion from 1950 until 2015, reaching an all time high of 115 USD Billion in December of 2010 and a record low of -18 USD Billion in June of 2009. Consumer Credit in the United States is reported by the Federal Reserve.
er-10-7-4

er-10-7-5