Another PMC, and an estimated $45 million check to Boston’s Dana Farber for cancer research! Congrats to all the donors and participants- over 6,000 riders and thousands of volunteers handling the logistics!
Special nod to Billy and Meredith Starr for a most successful 35th PMC and total donations approaching $500 million!!!
And thanks to all of you who contributed and those who will be contributing… ;)
(Note Elizabeth’s sandals with spd clips :)

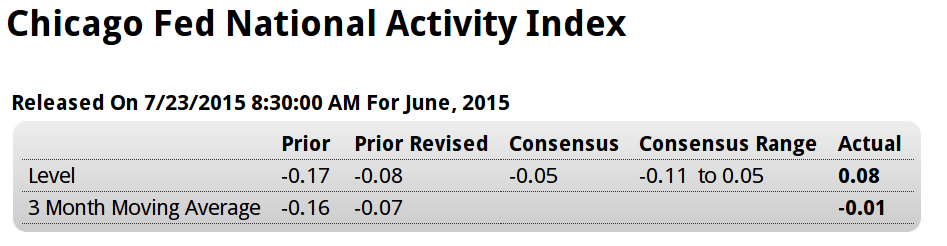
Personal Income and Outlays
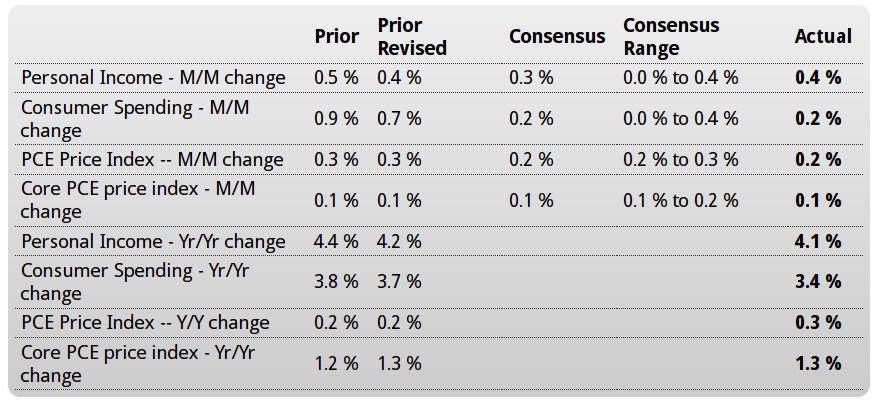
Highlights
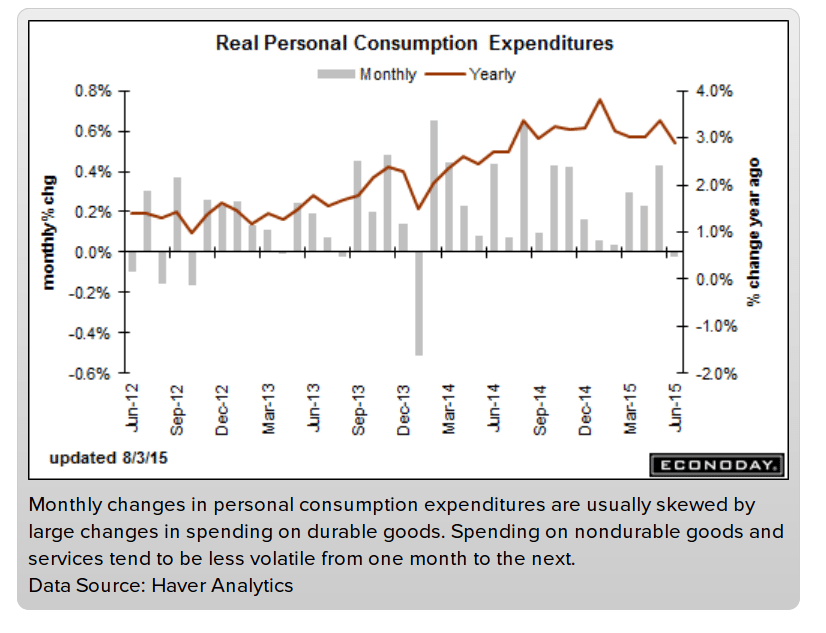
The consumer showed less life in June with inflation remaining very quiet. Consumer spending rose an as-expected 0.2 percent in June, down from a revised spike of 0.7 percent in May with the slowing tied in part to lower vehicle sales. Personal income, boosted by gains for rents and transfers that offset slight slowing in wages, rose slightly more than expected at 0.4 percent.
The key inflation reading in this report, the core PCE price index, rose only 0.1 percent for a very quiet 1.3 percent year-on-year rate that won’t be moving up expectations for the Federal Reserve’s rate hike. The year-on-year rate is at a 4-1/2-year low and has remained below 1.5 percent since November. The overall price index rose 0.2 percent in June with its year-on-year rate, reflecting the collapse in oil prices, at only plus 0.3 percent.
The savings rate is below 5.0 percent at 4.8 percent but remains on the high side, which points to consumer health and hints at underlying spending strength. The economy is just bumping along right now, pointing to no urgency for policy change.
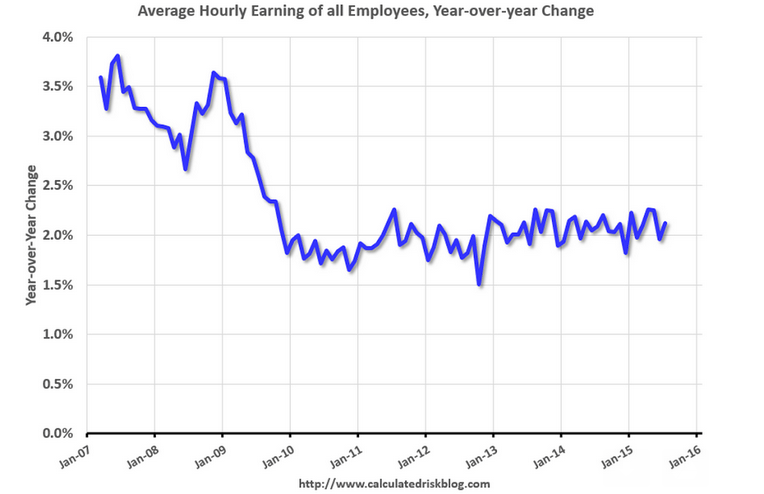
Wage income down:
August 3 (Bureau of Economic Analysis)
Wages and salaries increased $18.3 billion in June, compared with an increase of $32.0 billion in May. Private wages and salaries increased $16.0 billion in June, compared with an increase of $29.6 billion in May. Government wages and salaries increased $2.3 billion, compared with an increase of $2.4 billion.
Without the big jump in reported personal dividend income personal income would have been lower:
Rental income of persons increased $7.4 billion in June, compared with an increase of $7.7 billion in May. Personal income receipts on assets (personal interest income plus personal dividend income) increased $20.2 billion, compared with an increase of $8.4 billion. Personal current transfer receipts increased $8.6 billion, compared with an increase of $8.9 billion.
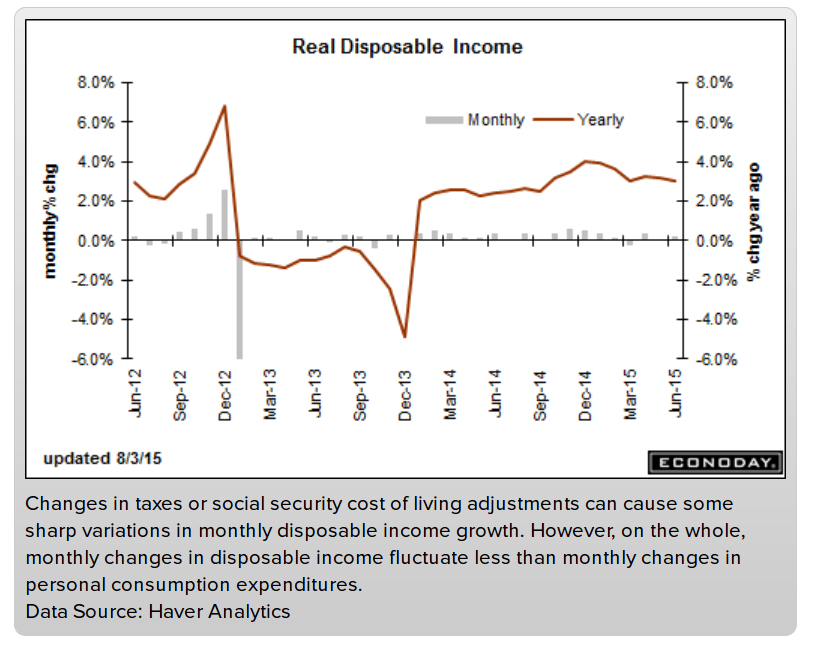
Lower tax payments helped disposable personal income but it’s still a very low rate of growth:
Personal current taxes increased $7.5 billion in June, compared with an increase of $12.5 billion in May. Disposable personal income (DPI) — personal income less personal current taxes — increased $60.6 billion, or 0.5 percent, in June, compared with an increase of $53.8 billion, or 0.4 percent, in May.
Real DPI — DPI adjusted to remove price changes — increased 0.2 percent in June, compared with an increase of 0.1 percent in May.
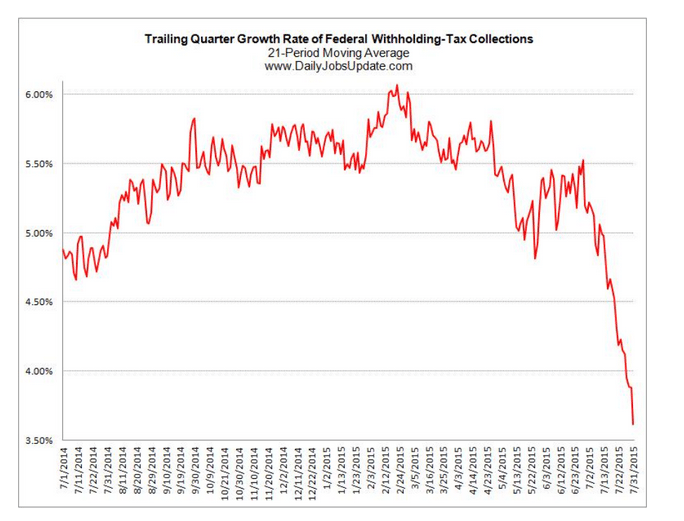
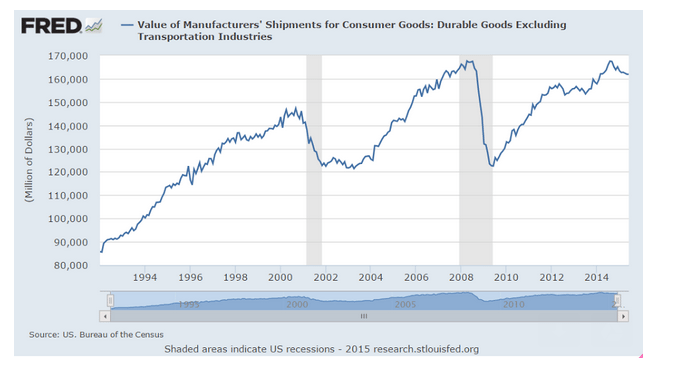
Like most all indicators, there’s been a falling off since oil prices broke during Q4 2014:
source: Bureau of Economic Statistics
Disposable personal income was revised up $19.7 billion, or 0.2 percent, for 2012; was revised down $109.5 billion, or 0.9 percent, for 2013; and was revised down $76.1 billion, or 0.6 percent, for 2014.
Personal outlays was revised down $30.8 billion, or 0.3 percent, for 2012; was revised down $91.4 billion, or 0.8 percent, for 2013; and was revised down $63.7 billion, or 0.5 percent, for 2014. Revisions to personal outlays primarily reflected downward revisions to PCE.
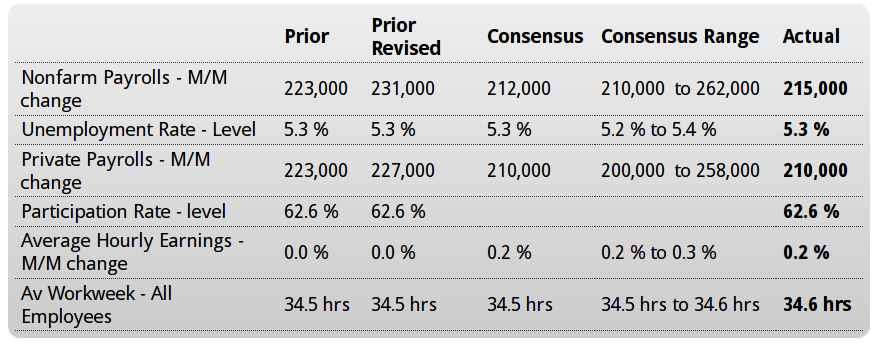
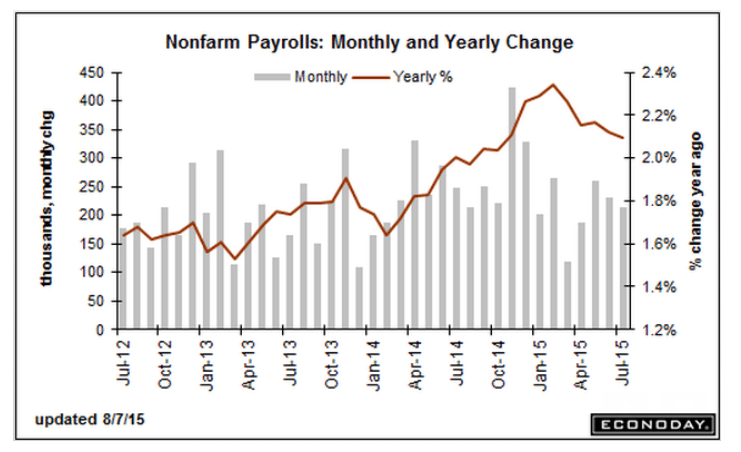
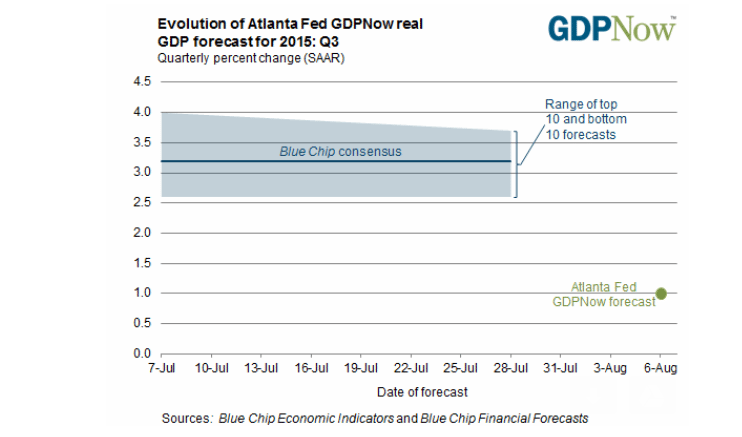
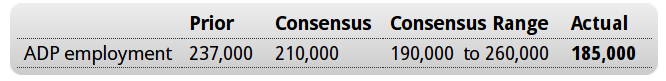
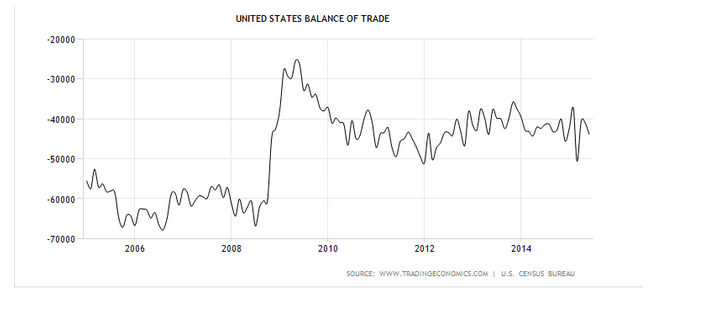
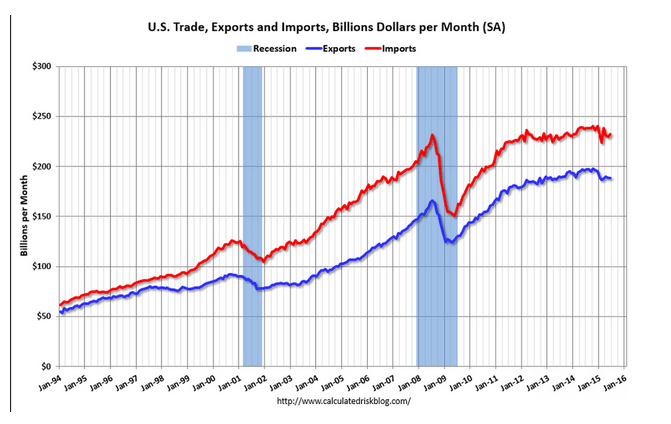
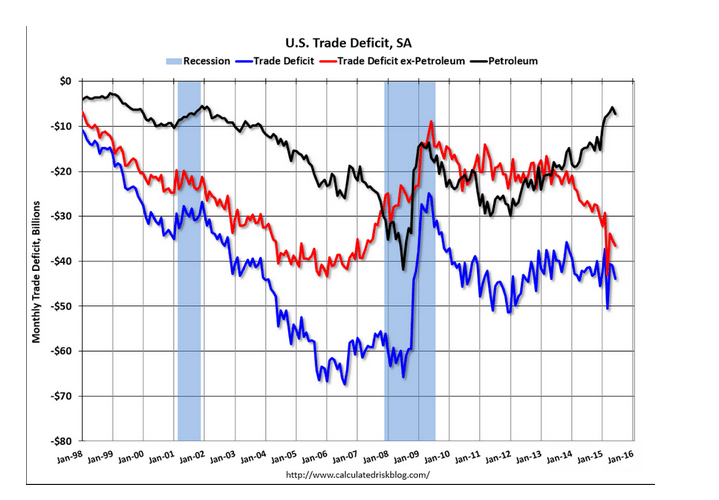
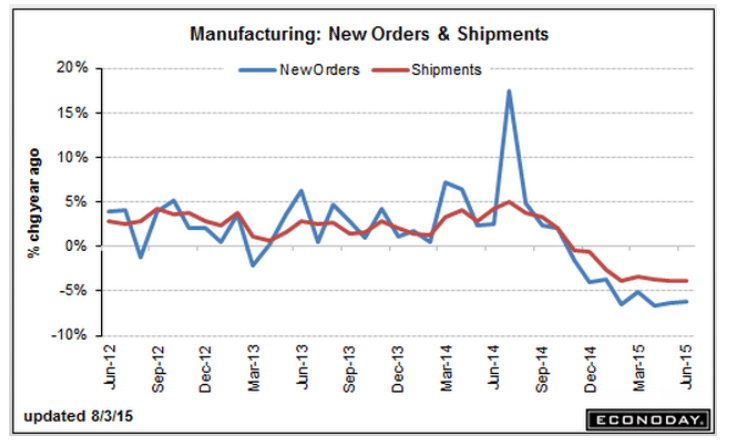
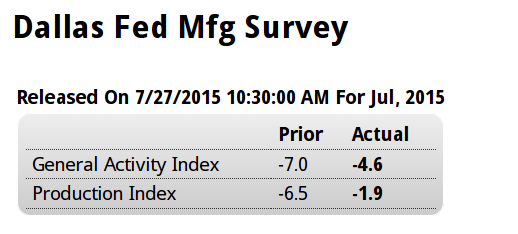
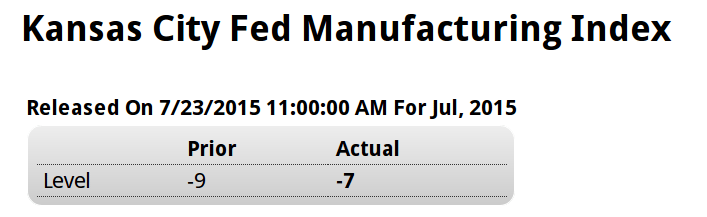
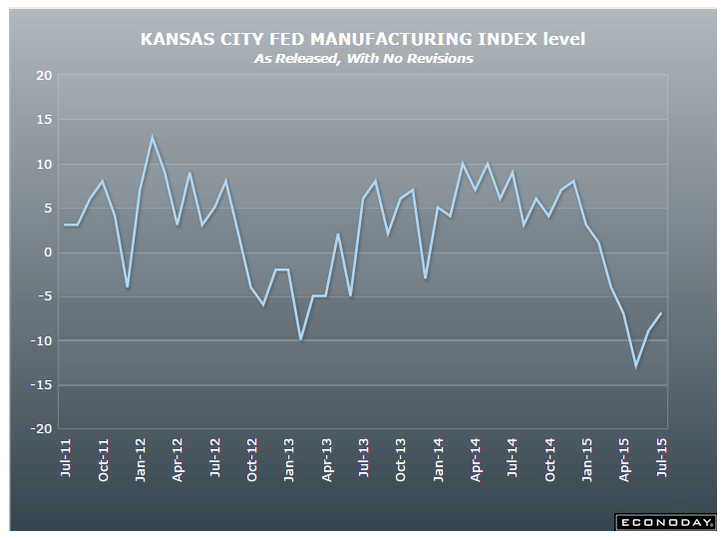
Exports again, and now employment showing weakness in the latest reports:
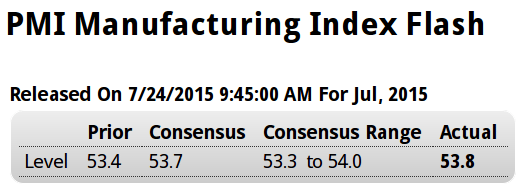
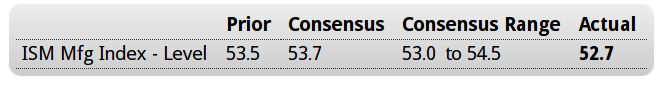
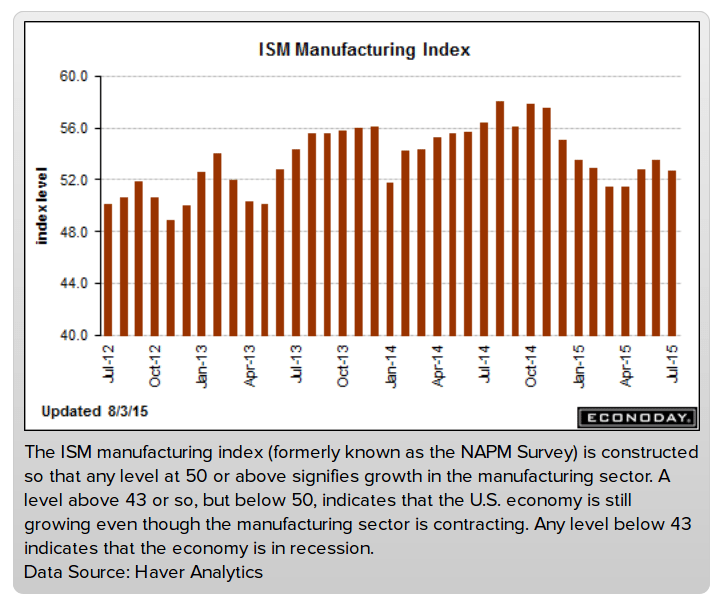
ISM Mfg Index
Highlights
Weak employment and continued contraction in exports held down the manufacturing index which slipped 0.8 tenths in July to a lower-than-expected 52.7 to indicate slowing monthly activity for ISM’s sample. Employment growth slowed nearly 3 points to 52.7 while new export orders fell 1.5 points to 48.0 for the 5th sub-50 contractionary reading of the last 7 months.
But there are signs of strength in the report led by new orders which rose 1/2 point to 56.5 which is the strongest reading of the year for this most important of all readings. The gain contrasts with the drop in export orders and points to strength in the domestic economy. Production is also strong at 56.0.
But another negative in the report is sharp contraction in backlogs, down 4.5 points to 42.5 to signal the sharpest draw in nearly 3 years. This drop helps explain the slowing in employment but is offset in the longer term outlook by the rise in new orders.
This report is mixed with export orders pointing to continuing headwinds for the manufacturing sector though total new orders are a plus. Note that this report was posted before its usually scheduled 10:00 a.m. ET release time.
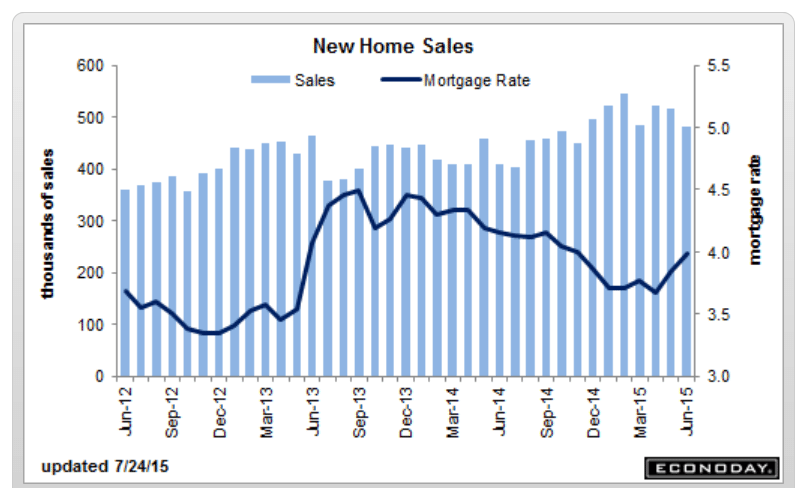
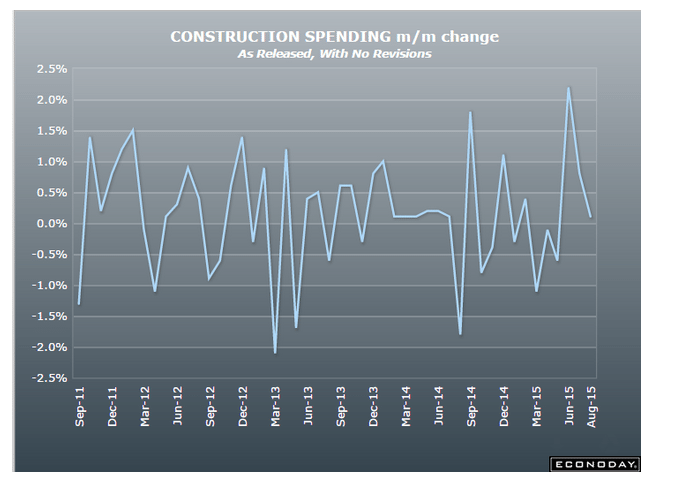
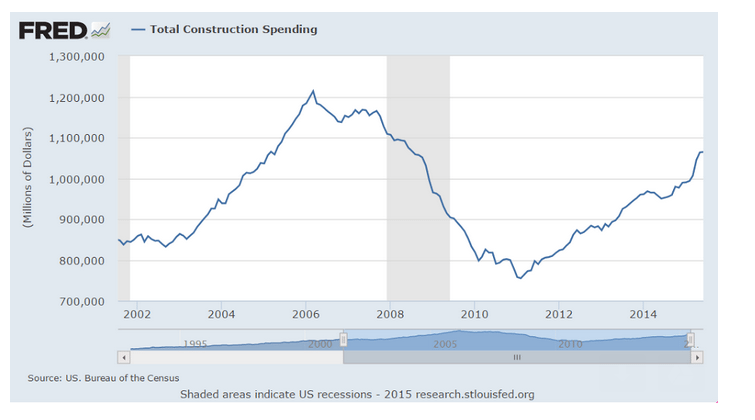
Construction up nicely vs last year this time, but not so much vs earlier this year, and some of it is the NY thing regarding getting started ahead of expiring credits as previously discussed, which look to have been followed by a sharp fall off:
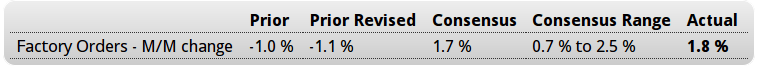
Construction Spending
source: Econoday.com
Highlights
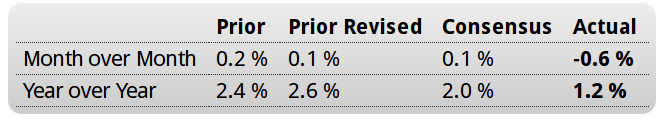
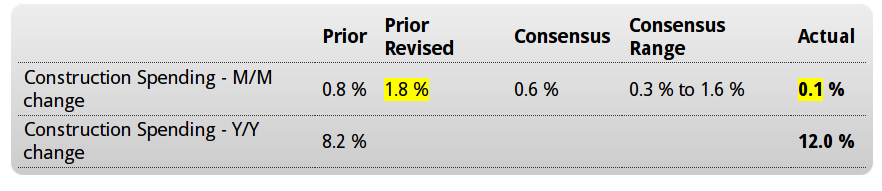
Held back by a slight and unexpected decline in single-family homes, construction spending inched only 0.1 percent higher in June. Spending on new single-family homes slipped 0.3 percent in June following gains of 0.5 percent and 1.0 percent in the prior two months. Showing much greater strength are multi-family units, up 2.8 percent in June following prior gains of 1.3 and 3.4 percent. Year-on-year, single-family homes are up a very strong 12.8 percent while multi-family is up 23.7 percent.
The biggest drag to June comes from the private non-residential category which fell 1.3 percent reflecting sweeping monthly declines for offices, commercial structures, factories along with power and transportation spending. On the plus side were construction for highways and education.
Housing permit data point to strength ahead for single-family construction spending along with continued standout strength for the multi-family category. But the decline on the non-residential side does underscore weakness right now in business investment. But taken together, total spending is still up a very constructive 12.0 percent year-on-year and the second-half outlook is still positive.
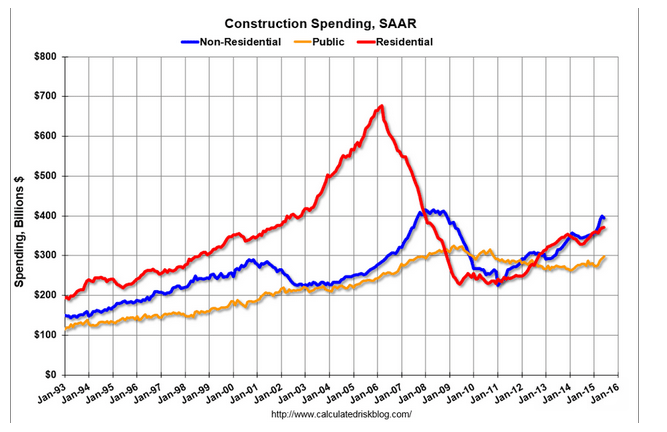
Not adjusted for inflation:
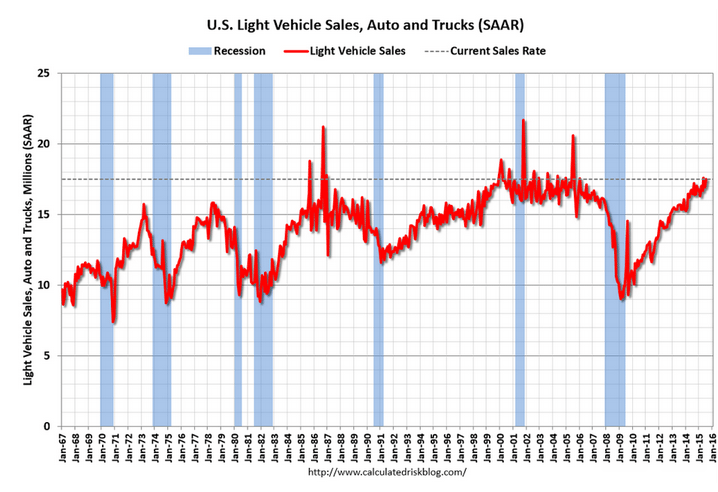
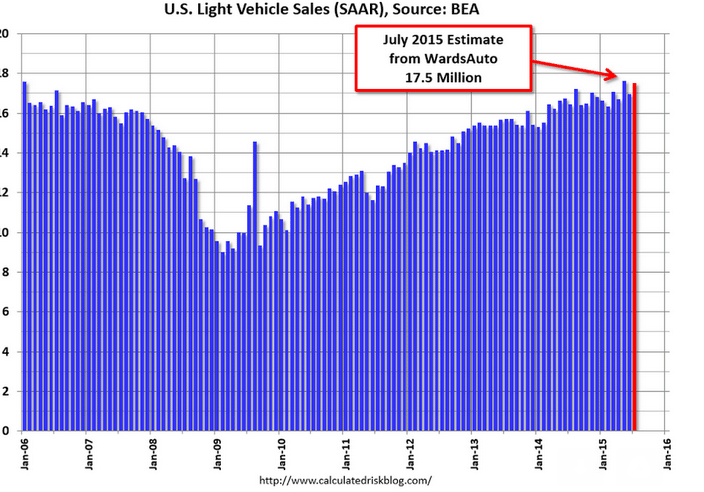
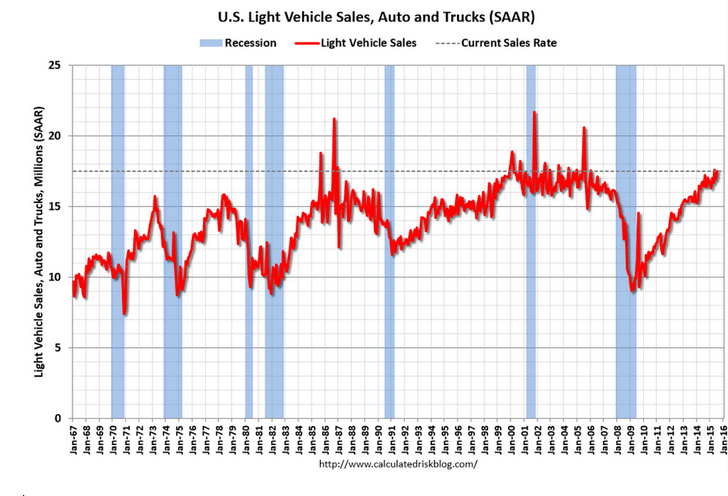
Motor vehicle sales looking up, estimated at a 17.5 million annual rate, almost as high as May and split between domestic and imports isn’t out yet. Domestically produced car sales have been down year over year: