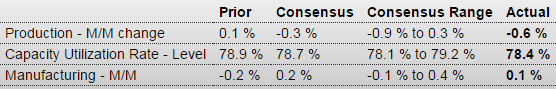
Personal Income and Outlays
Highlights
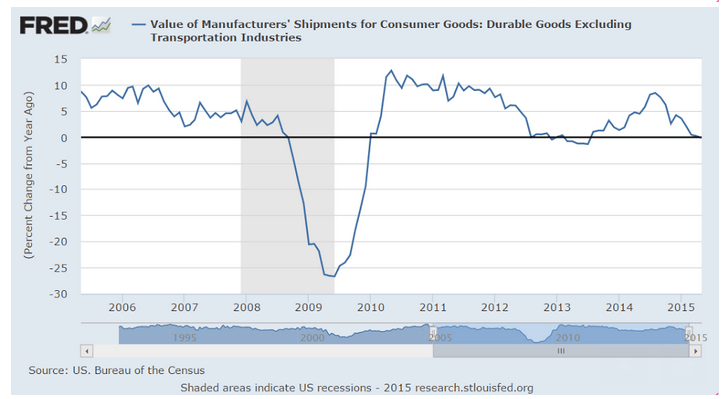
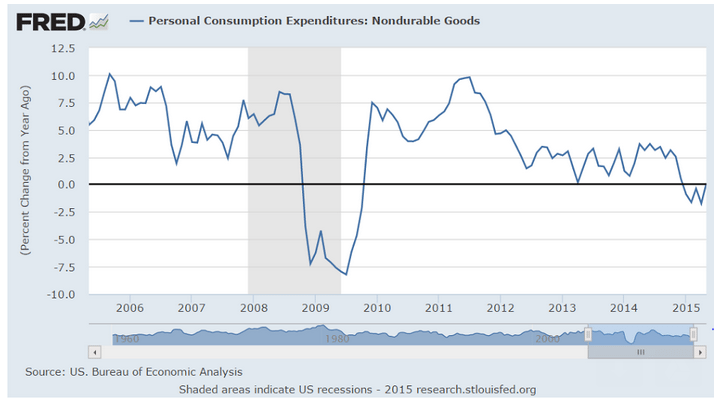
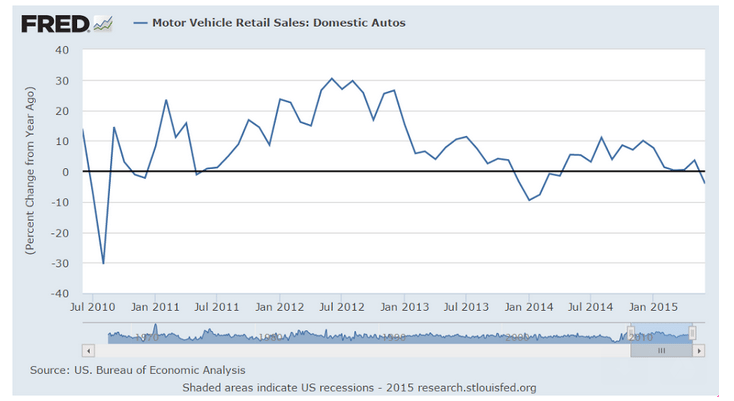
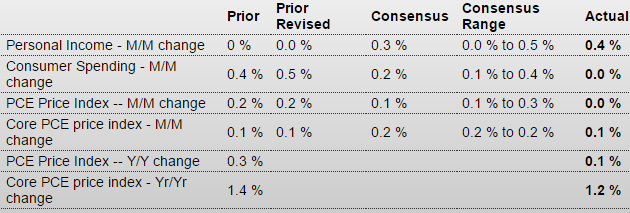
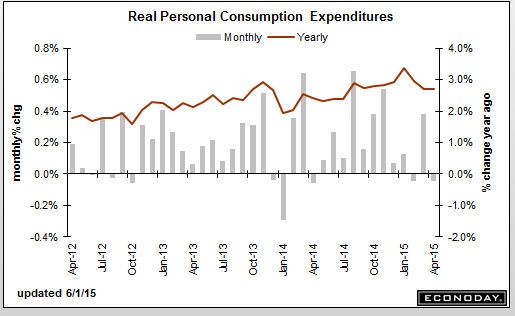
The consumer started off the second quarter slowly, putting income into savings and not spending. Consumer spending was unchanged in April with deep declines in spending on both durable and nondurable goods, down 0.7 percent and down 0.5 percent respectively, offset by another incremental increase in spending on services of plus 0.2 percent. Personal income, boosted by rents and dividends, rose a solid 0.4 percent though the gain for wages & salaries was less strong at 0.2 percent. The savings rate rose 4 tenths in the month to 5.6 percent.
Inflation readings are very tame with the price index unchanged in the month and the core up only 0.1 percent. The core rate, unlike April’s 1.8 percent core reading for the CPI where weightings on housing and medical costs are greater, is showing less pressure, down slightly to 1.2 percent. Overall prices are barely up at all year-on-year, at plus 0.1 percent.
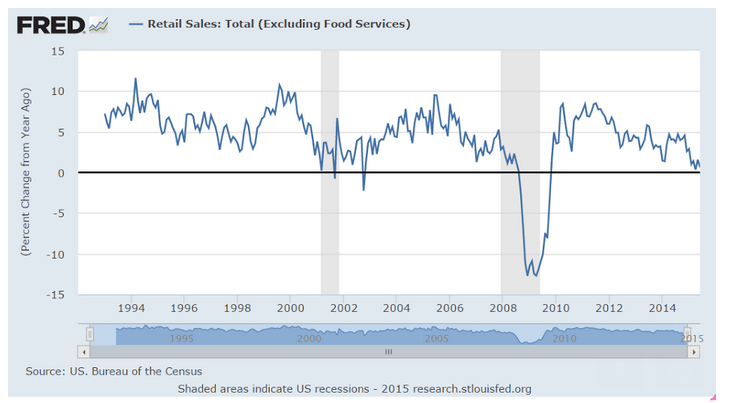
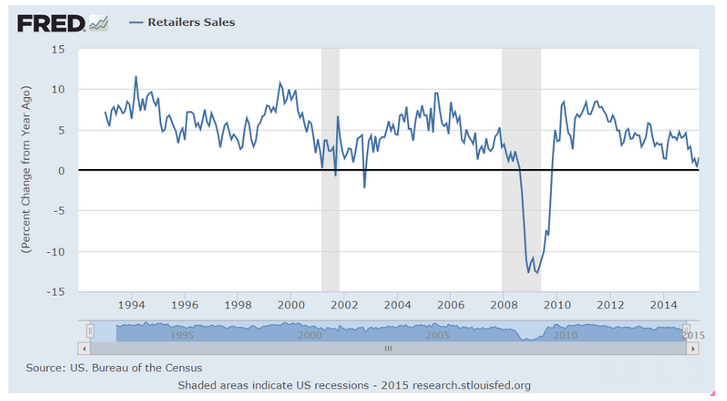
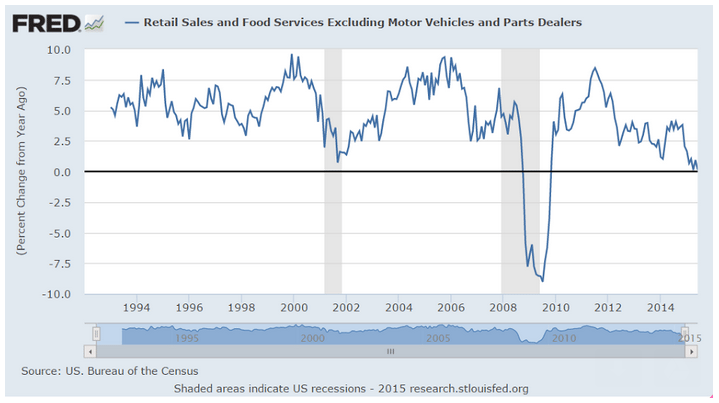
The April retail sales report first signaled trouble for second-quarter spending that today’s report confirms. The consumer, the economy’s bread-and-butter right now given weakness in manufacturing, is sitting on their hands. This report pushes back the outlook for the Fed’s first rate hike.
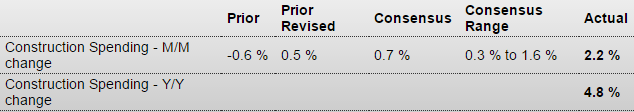
Seasonally adjusted annual rate of $1,006.1 billion, 2.2% above the revised March estimate of $984.0 billion. The April figure is 4.8% above the April 2014 estimate of $960.3 billion. During the first 4 months of this year, construction spending amounted to $288.7 billion, 4.1% above the $277.3 billion for the same period in 2014.
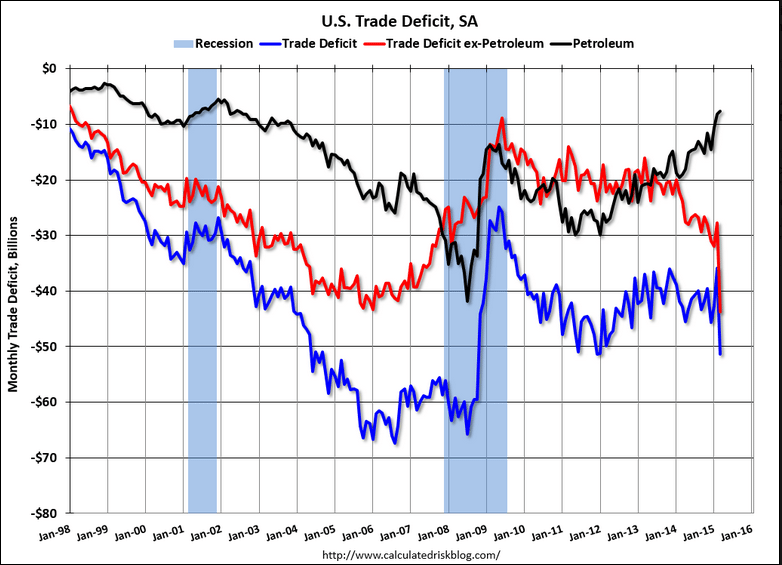
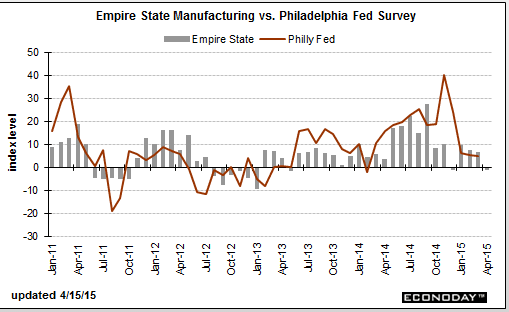
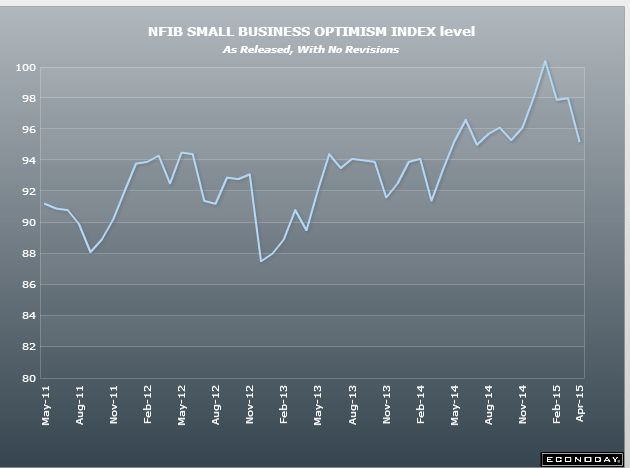
These surveys are ‘one company one vote’ and the drop in oil capex hurts a small number of the total initially even as GDP growth fades before it spreads to the rest, which could take a while as slowing employment gains reduce demand in general, etc. And note the continued reference to export softness, which is partly dollar related, but also a function of the drop in gobal oil capex.
ISM Mfg Index

Highlights
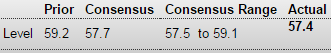
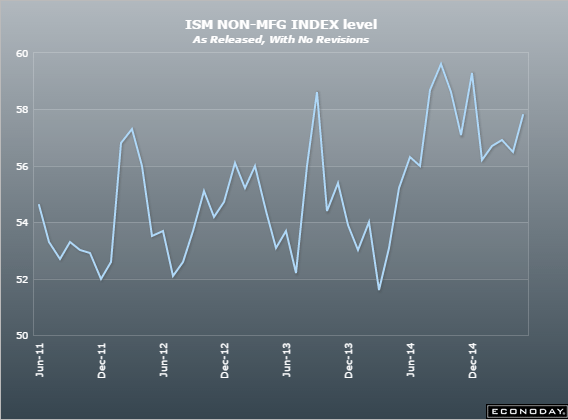
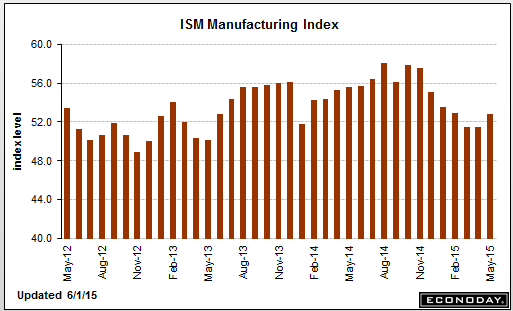
May was a modestly positive month for ISM’s manufacturing sample with the headline index rising 1.0 point to a better-than-expected 52.8 which is near Econoday’s high-end forecast. New orders are the highlight of the report, up 2.3 points to 55.8 which is the best reading of the year. Contraction in export orders has been pulling down total orders in many reports but exports were unchanged at 50.0 in this report.
Employment moved back over 50 to 51.7 for a 3.4 point gain while production looks solid at 54.5. Backlog orders, at 53.5, are back over 50 for the first time since February. Supplier deliveries show very little change, at 50.7 vs 50.1 in the prior report to suggest that snags tied to the first-quarter port slowdown have unwound. Price data show slightly lower costs for raw materials.
The 52.8 headline for this report may be better-than-expected but it’s still very soft. The manufacturing sector appears to be stumbling through the second quarter.
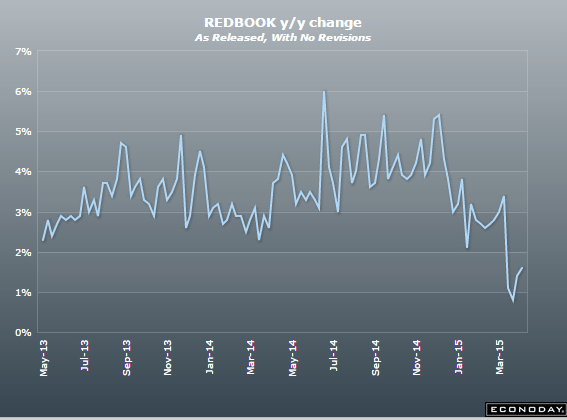
Up nicely, though mainly due to state and local govt increases. And more importantly, year over year growth a bit better but still very low.
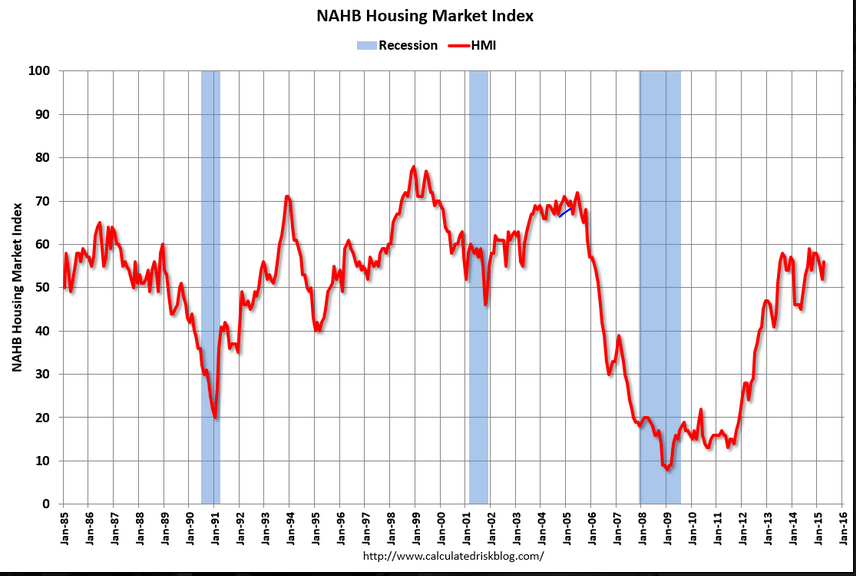
Construction Spending
Highlights
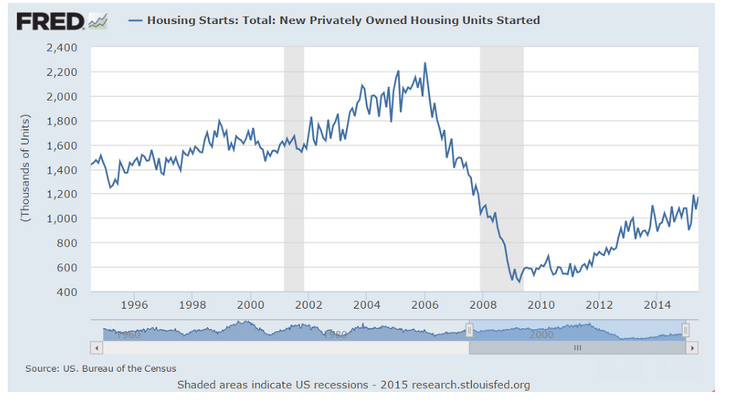
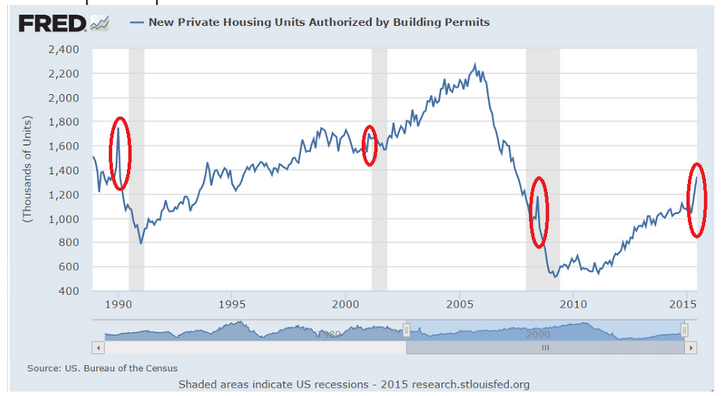
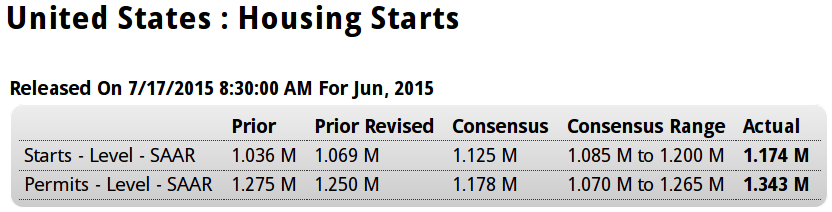
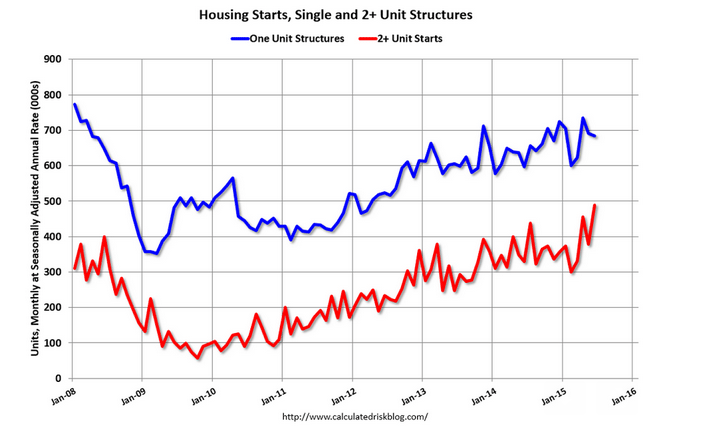
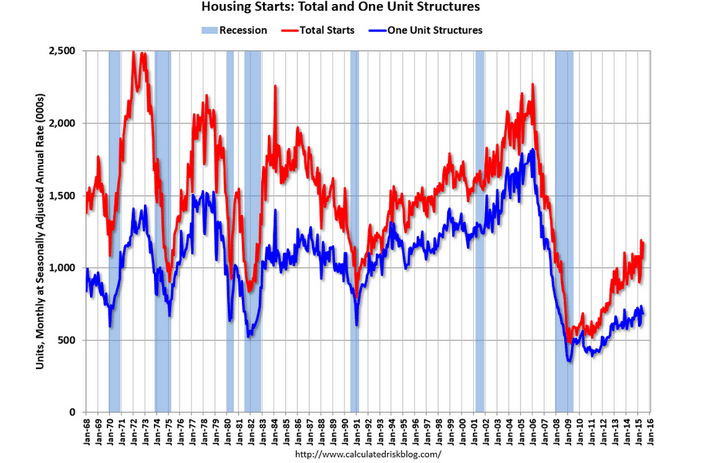
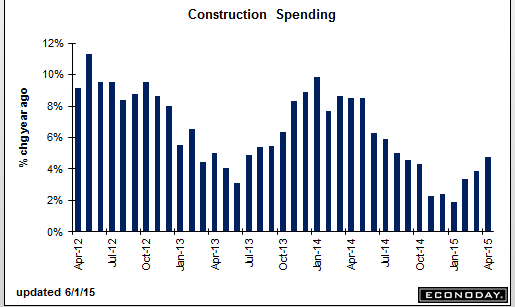
Construction spending is showing life, up 2.2 percent in April which is well above Econoday’s consensus for plus 0.7 percent and Econoday’s high-end forecast of 1.6 percent. Spending on residential construction rose 0.6 percent with strong gains posted for both single-family and multi-family homes. The gain here is no surprise and follows April’s big surge in housing starts & permits.
Private non-residential spending looks very strong in this report, up 3.1 percent and led by gains out of the power and office sectors. Pubic spending is also strong led by an outsized gain for highways & streets and including a large gain for educational building. The gain in public spending came entirely from the state and local governments as federal construction spending declined for a second straight month.
Adding to the positive news are big upward revisions, to plus 0.5 percent from an initial reading of minus 0.6 percent for March and no change from minus 0.6 percent in February. This will help boost the next revision to first-quarter GDP. And construction should give a badly needed lift to second-quarter growth which isn’t getting much help from the consumer, evidenced by this morning’s personal income & outlays report, nor from manufacturing, underscored by mostly soft readings in both this morning’s PMI index and ISM index.
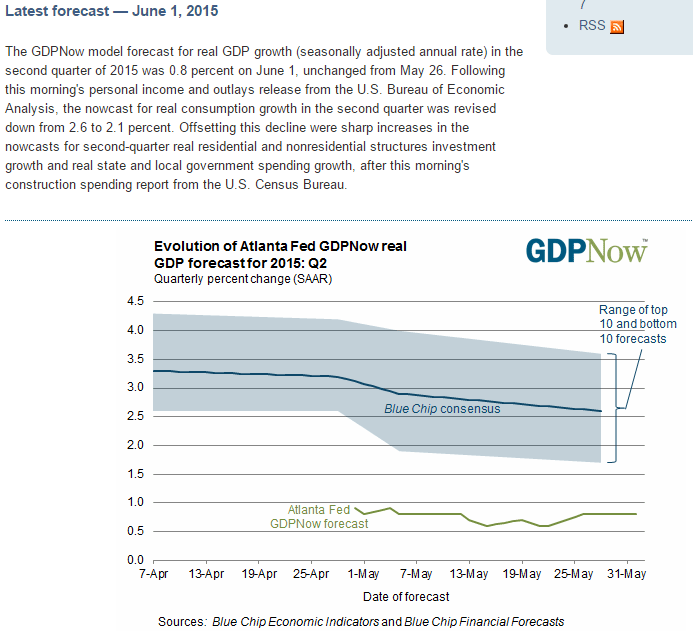
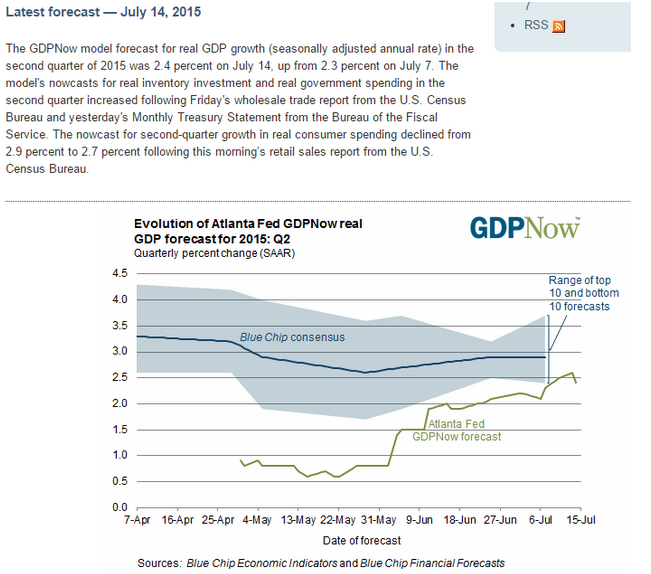
After factoring in today’s numbers the Atlanta Fed GDP forecast remains at .8% annualized for Q2: