placebo’s doing their thing

As previously discussed, financial placebos like QE do cause market participants to alter behavior out of either a misunderstanding of the actual fundamentals, or in anticipation of reactions by others presumed to be misinformed. And while the effects of these activities get reversed, however sometimes the effects are more lasting.

And there are also first order and second order effects. For example, a QE announcement could unleash misinformed fears about ‘money printing’ and ‘currency debasement’ and subsequent portfolio shifting that drives down the currency in the fx markets and drives up the price of gold. And the same misguided fears could cause bond yields to go higher in anticipation of a stronger/inflationary economy, even with the Fed buying bonds in an attempt to take yields lower.

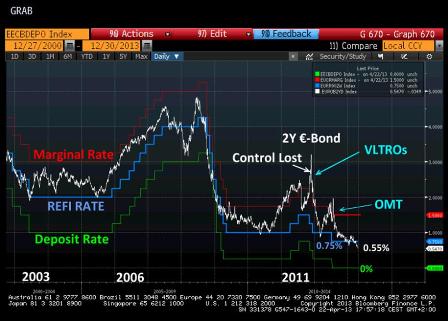
So right now the QE/’monetary policy works if large enough’ placebo is at least partially driving things in both Japan and the US, and today’s announcement of the possibility of the ECB buying asset backed securities is now also at work.

And along the same lines but with a different ‘sign’ is the ideologically driven idea that cutting govt spending in the face of a large output gap- the sequester- is a plus for output and employment. Same for the year end tax hikes.

The underlying fundamental I don’t see discussed is whether private sector credit expansion can continue to sufficiently ‘overcome’ the declining govt deficit spending and satisfy the ‘savings desires’/demand leakages.

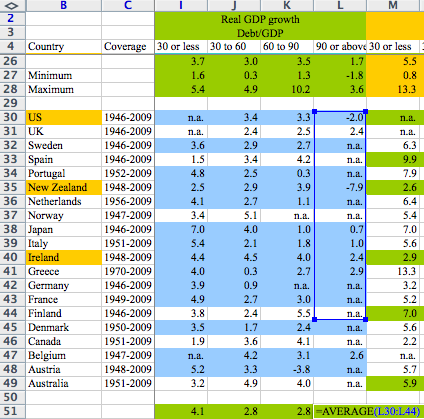
The main sources of private sector credit expansion are housing, student loans ($9 billion increase in March), and cars. Since 2009, the private sector credit expansion has managed to stay far enough ahead of the declining govt deficit, which has fallen from about 9% of GDP to about a rate of 6% of GDP by year end (mainly via the ‘automatic fiscal stabilizers’ of higher tax receipts and moderating transfer payments) resulting in about 2% real growth.

The question now is whether the private sector credit expansion can survive the 1.25% of GDP shock of the FICA tax hike and sequesters- which reduce support from the govt deficit to only maybe 4.5% of GDP- and still continue to sufficiently feed the (ever growing) demand leakages enough to generate positive GDP growth.

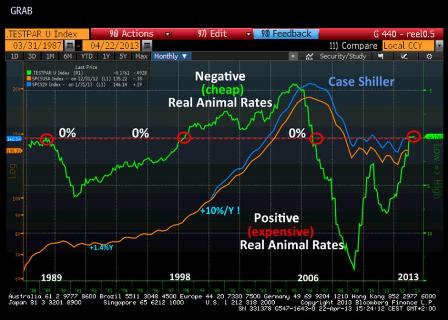
The stock market is often the best leading indicator of the macro economy, but it has ‘paused’ for two double dips that didn’t happen over the last few years, and it is subject to influence from placebos. Additionally, valuations change as implied discount rates change, and so in this case P/E’s shifting upwards may be discounting interest rates staying low for longer, due to an economy too weak to trigger Fed rate hikes, but strong enough to keep sales and earnings at least flat.

Placebo Surgery Shows Surprising Results

By Kate Melville

Research by Doctor Cynthia McRae of the University of Denver’s College of Education provides strong evidence for a significant mind-body connection among patients who participated in a Parkinson’s surgical trial.

Forty persons from the United States and Canada participated to determine the effectiveness of transplantation of human embryonic dopamine neurons into the brains of persons with advanced Parkinson’s disease. Twenty patients received the transplant while 20 more were randomly assigned to a sham surgery condition. Dr. McRae reports that the “placebo effect” was strong among the 30 patients who participated in the quality of life portion of the study.

“Those who thought they received the transplant at 12 months reported better quality of life than those who thought they received the sham surgery, regardless of which surgery they actually received,” says Dr. McRae. More importantly, objective ratings of neurological functioning by medical personnel showed a similar effect. In the report, appearing in the Archives of General Psychiatry, Dr. McRae writes “medical staff, who did not know which treatment each patient received, also reported more differences and changes at 12 months based on patients’ perceived treatment than on actual treatment.”

One patient reported that she had not been physically active for several years before surgery, but in the year following surgery she resumed hiking and ice skating. When the double blind was lifted, she was surprised to find that she had received the sham surgery.

Although patient perceptions influenced their test scores, when the total sample of patients was grouped by the actual operation they received, patients who had the actual transplant surgery showed improvement in movement while, on average, patients who had sham surgery did not.

Professor Dan Russell at Iowa State, the study’s co-author, says the findings have both scientific and practical implications. “This study is extremely important in regard to the placebo effect because we know of no placebo studies that have effectively maintained the double-blind for at least 12 months. The average length of placebo studies is eight weeks,” according to Russell. Dr. McRae notes that similar results related to the placebo effect have been found in other studies with patients with Parkinson’s disease. She says that there is a need for placebo controls in studies evaluating treatment for Parkinson’s as the placebo effect seems to be very strong in this disease. Dr. McRae also reports that although the sham surgery research design is somewhat controversial and has raised some ethical concerns, the results of this study show “the importance of a double-blind design to distinguish the actual and perceived values of a treatment intervention.”

Knee Surgery Proves No Better Than Placebo

By Katrina Woznicki

July 10, 2002 (UPI) — For individuals suffering from osteoarthritis in their knees, a common type of knee surgery has been found to be no more beneficial than a placebo, a new study revealed Wednesday.

Researchers at the Houston VA Medical Center and at Baylor College of Medicine came to this surprising conclusion after comparing various knee treatments to placebo surgery on 180 patients with knee pain.

The patients were randomly divided into three groups. One group underwent debridement, in which the damaged or loose cartilage is the knee is surgically removed by an arthroscope, a pencil-thin tube that allows doctors to see inside the knee. The second group received arthoscopic lavage, which flushes out the bad cartilage from the healthier tissue. A third group underwent a placebo surgery. They were sedated by medication while surgeons simulated arthroscopic surgery on their knees by making small incisions on the leg, but not removing any tissue.

During a two-year follow-up, researchers found no differences among the three groups. All patients reported improvement in their symptoms of pain and ability to use their knees. Throughout the two years, patients were unaware whether they had received the “real” or placebo surgery.

However, patients who received actual surgical treatments did not report less pain or better functioning of their knees compared to the placebo group. In fact, periodically during the follow-up, the placebo group reported a better outcome compared to the patients who underwent debridement.

Rogoff & Reinhart answering my call in FT – Austerity is not the only answer to a debt problem

Good to see Ken, who I’ve never met, and Carmen who I do know, no doubt assisted by her husband Vince, beginning to come clean with this response. While not complete, it’s the beginning of an encouraging, epic reversal and a first step in the right direction!

My comments added below:

Austerity is not the only answer to a debt problem

By Kenneth Rogoff and Carmen Reinhart

May 1 (FT) — The recent debate about the global economy has taken a distressingly simplistic turn. Some now argue that just because one cannot definitely prove very high debt is bad for growth (though the weight of the results still say it is),

They could add here ‘though likely via the reaction functions of govts and not the high debt per se.’

then high debt is not a problem. Looking beyond the recent public debate about the literature on debt we have already discussed our results on debt and growth in that context the debate needs to be reconnected to the facts.

Let us start with one: the ratios of debt to gross domestic product are at historically high levels in many countries, many rising above previous wartime peaks. This is before adding in concerns over contingent liabilities on private sector balance sheets and underfunded old-age security and pension programmes. In the case of Germany, there is also the likely need to further cushion the debt loads of eurozone partners.

Adding here ‘as they are ‘users’ of the euro the way US states are ‘users’ of the dollar, and not the actual issuer of the currency like the ECB, the Fed, the BOE, the BOJ, and the rest of the world’s central banks.’

Some say not to worry, pointing to bursts of growth after the world wars. But todays debts,

Add ‘while they pose no solvency risk for the issuer of the currency.’

will not be dealt with by boosts to supply from postwar demobilisation and to demand from the lifting of wartime controls.

To be clear, no one should be arguing to stabilise debt, much less bring it down, until growth is more solidly entrenched if there remains a choice, that is.

BRAVO!!!! And add ‘as is always the case for the issuer of the currency.’

Faced with, at best, haphazard access to international capital markets and high borrowing costs, periphery countries in Europe face more limited alternatives.

Add ‘as is the case for ‘users’ of a currency in general, including the US states, for example’.

Nevertheless, given current debt levels, enhanced stimulus should only be taken selectively and with due caution. A higher borrowing trajectory is warranted, given weak demand

BRAVO!

and low interest rates,

Add ‘which are confirmation by the CB policy makers who set the rates low that they too believe demand is weak’.

where governments can identify high-return infrastructure projects. Borrowing to finance productive infrastructure raises long-run potential growth, ultimately pulling debt ratios lower. We have argued this consistently since the outset of the crisis.

BRAVO! And add ‘additionally, weak demand can be addressed by tax reductions, recognizing that counter cyclical fiscal policy of currency users, like the euro zone members, requires funding support from the issuer of the currency, which in this case is the ECB.’

Ultra-Keynesians would go further and abandon any pretense of concern about longer-term debt reduction.

Add ‘without a credible long term inflation concern, as for the issuer of the currency inflation is the only risk from excess demand.’

This position has been in the rhetorical ascendancy in recent months, with new signs of weaker growth. It throws caution to the wind on debt

Add ‘with regards to solvency, as is necessarily the case for the issuer of the currency.’

and, to quote Star Trek, pushes governments to go where no man has gone before

Add ‘apart from war time, when the importance of maximum output and employment takes center stage.’

The basic rationale

Add ‘of the mainstream deficit doves (not the ultra Keynesian MMT school of thought)’

is that low interest rates make borrowing a free lunch.

Unfortunately,

Add ‘the mainstream believes’

ultra-Keynesians are too dismissive of the risk of a rise in real interest rates. No one fully understands why rates have fallen so far so fast,

Add ‘apart from the Central Bankers who voted to lower them this far and this fast, and in some cases provide guarantees to other borrowers.’

and therefore no one can be sure for how long their current low level will be sustained.

Add ‘as it’s a matter of second guessing those central bankers.’

John Maynard Keynes himself wrote How to Pay for the War in 1940 precisely because he was not blas about large deficits even in support of a cause as noble as a war of survival. Debt is a slow-moving variable that cannot and in general should not be brought down too quickly. But interest rates can change rapidly.

Add ‘all it takes is a vote by central bankers.’

True, research has identified factors that might combine to explain the sharp decline in rates.

Add ‘in fact, all you have to do is research the votes at the central bank meetings.’

Greater concern

Add ‘by central bankers’

over potentially devastating future events such as fresh financial meltdowns may be depressing rates. Similarly, the negative correlation between returns on stocks and long-term bonds, while admittedly quite unstable, also makes bonds a better hedge. Emerging Asias central banks have been great customers for advanced economy debt, and now perhaps the Japanese will be once more. But can these same factors be relied on to keep yields low indefinitely?

Add ‘In the end, it’s all a matter of the central bank’s reaction function.’

Economists simply have little idea how long it will be until rates begin to rise. If one accepts that maybe, just maybe, a significant rise in interest rates in the next decade

Add ‘due to inflation concerns’

might be a possibility, then plans for an unlimited open-ended surge in debt should give one pause.

Add ‘if he does not see the merits of leaving risk free rates near 0 in any case, as there is no convincing central bank research that shows rate hikes reduce inflation rates, and even credible theory and evidence to be concerned that rate hikes instead exacerbate inflation.’

What, then, can be done? We must remember that the choice is not simply between tight-fisted austerity and freewheeling spending. Governments have used a wide range of options over the ages. It is time to return to the toolkit.

First and foremost,

Add ‘only’

governments

Add ‘who fail to recognize that these are merely matters of accounting that don’t themselves alter output and employment’

must be prepared to write down debts rather than continuing to absorb them. This principle applies to the senior debt of insolvent financial institutions, to peripheral eurozone debt and to mortgage debt in the US.

Add ‘Additionally’

For Europe, in particular, any reasonable endgame will require a large transfer

Add ‘of public goods production’

from Germany to the periphery.

Add ‘which in fact would be a real economic benefit for Germany.’

The sooner this implicit transfer becomes explicit, the sooner Europe will be able to find its way towards a stable growth path.

There are other tools. So-called financial repression, a non-transparent form of tax (primarily on savers), may be coming to an institution near you. In its simplest form, governments cram debt into domestic pension funds, insurance companies and banks

By removing governmental support of higher rates from their net issuance of debt instruments, particularly treasury securities.

Europe is there already and it has been there before, several times. How to Pay for the War was, in part, about creating captive audiences for government debt. Read the real Keynes, not rote Keynes, to understand our future.

One of us attracted considerable fire for suggesting moderately elevated inflation (say, 4-6 per cent for a few years) at the outset of the crisis. However, a once-in-75-year crisis is precisely the time when central banks should expend some credibility to take the edge off public and private debts, and to accelerate the process bringing down the real price of housing and real estate.

It is therefore imperative for the central bankers to make it clear to the politicians that there is no solvency risk, and that central bankers, and not markets, are necessarily in control of the entire term structure of risk free rates, and that their research shows that rate hikes are not the appropriate way to bring down inflation, should the question arise’

Structural reform always has to be part of the mix. In the US, for example, the bipartisan blueprint of the Simpson-Bowles commission had some very promising ideas for simplifying the tax codes.

There is a scholarly debate about the risks of high debt. We remain confident in the prevailing view in this field that high debt is associated with lower growth

Add ‘but must add that the risk is that of misguided policy response, and not the level of debt per se.’

Certainly, lets not fall into the trap of concluding that todays high debts are a non-issue.

Add ‘as we must be ever mindful of the possibility of excess demand using up our productive capacity’

Keynes was not dismissive of debt. Why should we be?

The writers are professors at Harvard University. They have written further on carmenreinhart.com

de Niall on Krugman

Not that Krugman is right, but that ‘de Niall is wrong here. Comments in below:

Niall Ferguson to Paul Krugman: Youre Still Wrong About Government Spending

By Morgan Korn

April 30 (Daily Ticker) — Niall Ferguson has two words for Paul Krugman: youre wrong.

The Harvard University history professor and author of Civilization: The West and the Rest says Krugmans pro-government spending thesis not only fails to address the core problems facing the U.S. and Europe today but also has dire consequences for individuals living in these economies.

You cant borrow trillions of dollars a year for the rest of time, Ferguson says in an interview with The Daily Ticker at the Milken Institute Global Conference 2013.

Operationally there is no numerical limit to US govt deficit spending. Nominal restrictions are political only. Yes, the currency might go down, there might be inflation, you might lose your job, but US Treasury checks won’t bounce unless congress decides to bounce them.

Once a government gets to a very very high level of debt, the risk is very small increases in borrowing costs which create a vast ocean of red ink. So that risk is not negligible.

So what happens as that ‘debt’ grows larger? Nothing if it isn’t spent. And if it’s spent, the risk is the risk of too much spending in the economy. Overspending would mean unemployment got ‘too low’ and the ‘excess spending’ was simply driving up prices. Comes back to the only risk of ‘too much’ deficit being inflation. So what’s his long term inflation forecast? He probably doesn’t even have one!!!

Very large debts do not simply disappear by magic.”

Correct, they remain as balances in either securities accounts (aka Treasury securities) at the Fed, or in reserve accounts at the Fed, or as actual cash, to the penny. And they constitute the $US net financial assets of the global economy that supports the global $US credit structure. To the penny.

Ferguson argues that Carmen Reinharts and Ken Rogoffs conclusions about the relationship between high debt and low growth are still true. The two Harvard economists had to defend their seminal book This Time is Different: Eight Centuries of Financial Folly after three University of Massachusetts academics correctly identified a spreadsheet coding error that led us to miscalculate the growth rates of highly indebted countries since World War II, according to Reinhart and Rogoff. (Lawmakers across the world cited their work as justification to institute austerity policies; they argued that economic growth slowed after a country’s public debt equaled 90 percent of its GDP).

The headlines have done a disservice to Ken Rogoff and Carmen Reinhart, Ferguson notes. Its extremely implausible that governments with already high debt can improve their situation by making their debt even larger. High debt scenarios often end with inflation or default. They dont end with a rapid increase in the growth rate. A minor error in the Rogoff and Reinhart paper does not refute the case that governments with excessively large public debt have to bring them under control.”

Presenting data doesn’t ever show causation.

But regardless of the level of cumulative deficit spending for a currency issuing govt, with a proposed tax cut and/or spending increase every economist paid to be right will revise his GDP forecast up.

Moreover, Ferguson compares government accounting of public debt to one of the most famous and hated public companies that ever existed.

If companies behaved like governments, they would essentially be Enron, he says. There is a fundamental problem with government accounting.

There are likely govt accounting problems, but not solvency problems for the issuer of the currency.

US consumers keep spending despite reduced pay

This is the current thinking, but the pieces don’t add up?
Hoping I’m being too negative here…

Comments below:

US consumers keep spending despite reduced pay

By Christopher S. Rugaber

April 29 (AP) — This year got off to a sour start for U.S. workers: Their pay, already gasping to keep pace with inflation, was suddenly shrunk by a Social Security tax increase.

Which raised a worrisome question: Would consumers stop spending and further slow the economy? Nope. Not yet, anyway.

On Friday, the government said consumers spent 3.2 percent more on an annual basis in the January-March quarter than in the previous quarter the biggest jump in two years. It highlighted a broader improvement in Americans’ financial health that is blunting the impact of the tax increase and raising hopes for more sustainable growth.

Yes, but the ‘slope’ has been negative, with March way down.

Consumers have shed debt. Gasoline has gotten cheaper. Rising home values and record stock prices have restored household wealth to its pre-recession high. And employers are steadily adding jobs, which means more people have money to spend.

Sort of. There have been new jobs, but often at lower pay, and the participation rate has continued to fall. Rising home values are from very low, foreclosure depressed levels, and reports show substantial negative equity remains. And it seems that while total household wealth may be back to the highs, the ‘1%’ has benefited disproportionately.

“No one should write off the consumer simply because of the 2 percentage-point increase in payroll taxes,” says Bernard Baumohl, chief economist at the Economic Outlook Group. “Overall household finances are in the best shape in more than five years.”

Yes, better than 08 after the crash, but still marginal. Debt is down, but take home pay vs the cost of living isn’t doing all that well.

Certainly, spending weakened toward the end of the January-March quarter. Spending at retailers fell in March by 0.4 percent, the worst showing in nine months. And more spending on utilities accounted for up to one-fourth of the increase in consumer spending in the January-March quarter, according to JPMorgan Chase economist Michael Feroli, because of colder weather.

Higher spending on utilities isn’t a barometer of consumer confidence the way spending on household goods, such as new appliances or furniture, would be.

Right. Not good and the slope is negative.

Americans also saved less in the first quarter, lowering the savings rate to 2.6 percent from 3.9 percent in 2012. Economists say that was likely a temporary response to the higher Social Security tax, and most expect the savings rate to rise back to last year’s level. That could limit spending.

‘Saving less’ generally takes the form of ‘borrowing more’, in this case to pay utility bills and make up for the income lost to the tax hike, which is not sustainable.

But several longer-term trends are likely to push in the other direction, economists say, and help sustain consumer spending. Among those trends:

Wealth is up

Home prices rose more than 10 percent in the 12 months that ended in February. And both the Dow Jones industrial average and Standard & Poor’s 500 stock indexes reached record highs in the first quarter. As a result, Americans have recovered the $16 trillion in wealth that was wiped out by the Great Recession.

Again, skewed to the higher income groups who’s ‘consumer spending’ wasn’t all that sensitive to income in any case.

Economists estimate that each dollar of additional wealth adds roughly 3 cents to spending.

Or is it every 3 cents in spending adds a dollar of additional wealth?

That means last year’s $5.5 trillion run-up in wealth could spur about $165 billion in additional consumer spending this year. That’s much more than the $120 billion cost of the higher Social Security taxes.

Or the 120 billion tax hike will reduce wealth by $5.5 trillion from where it would have been otherwise?

‘The wealth’ has to ‘come from’ somewhere. In this case, so sustain spending, non govt debt would have to climb that much more just to make up for the tax hike. It’s possible, but working against that happening is the lower after tax income makes it harder to qualify for new debt, even if you wanted to.

Debt is down

Household debt now equals 102 percent of after-tax income, down from a peak of 126 percent in 2007. That’s almost back to its long-term trend, according to economists at Deutsche Bank.

And so why should it grow faster than the long term trend? The burst last time around was from the sub prime fraud. Before that the .com nonsense and the Y2K scare. Before that the expansion phase of the S&L fraud. And it won’t happen this time if we’re careful to not allow a credit expansion we’ll later regret…

And households are paying less interest on their debts, largely because of the Federal Reserve’s efforts to keep borrowing rates at record lows.

And earning less on their savings. Households are net savers.

The percentage of after-tax income that Americans spent on interest and debt payments dropped to 10.4 percent in the October-December quarter last year. That’s the lowest such figure in the 32 years that the Federal Reserve has tracked the data.

And personal income from interest has likewise dropped, and probably more so.

Jobs are up

Employers have added an average of 188,000 jobs a month in the past six months, up from 130,000 in the previous six. Job gains slowed in March to only 88,000.

Yes, negative slope again. And not even beginning to close the output gap.

But most economists expect at least a modest rebound in coming months. And layoffs sank to a record low in January. Fewer layoffs tend to make people feel more secure in their jobs and more willing to spend.

Gas prices are down

Gasoline prices have fallen in the past year and are likely to stay low. Nationwide, the average price of a gallon of gas has dropped 28 cents since this year’s peak of $3.79 on Feb. 27. Analysts expect gas to drop an additional 20 cents over the next two months. Each 10 cent drop over a full year translates into roughly $13 billion in savings for consumers.

Yes, that helps, except gas prices have been going back up most recently.

Loan costs are down

Lower interest rates have enabled millions of Americans to save money by refinancing their mortgages. Mortgage giant Freddie Mac estimates that in the fourth quarter of 2012, homeowners who refinanced cut their interest rate by one-third, the biggest reduction in 27 years the agency has tracked the data. On a $200,000 loan, that means $3,600 in savings over the next 12 months.

And savers are losing that much.

Some economists note that the Social Security tax cut didn’t spur much more spending when it first took effect at the start of 2011. The tax cut gave someone earning $50,000 about $1,000 more to spend each year. A household with two high-paid workers had up to $4,500 more.

Despite the tax cut, Baumohl notes that consumer spending rose only 2.5 percent in 2011 and 1.9 percent in 2012. In the 10 years before the recession began in December 2007, the average annual spending increase was 3.4 percent.

And a study by the Federal Reserve Bank of New York found that consumers spent only 36 percent of the increased income that resulted from the tax cut. The rest went to paying down debt or to savings.

Ok, so the question is whether with the tax hike they will cut spending or consume from borrowing and dipping into savings. Initially that’s what happened, but seems by March the increasing consumption had started to fade?

And the sequesters hadn’t even begun.

Since the tax cut didn’t boost spending that much, its expiration may not drag it down much, either. Economists say temporary tax cuts are often ineffective because many consumers assume that the tax breaks will eventually disappear. So they don’t ramp up spending in response.

As just discussed. It’s not necessarily symmetrical.

Scott Loehrke, 25, hasn’t cut back spending this year. Loehrke went ahead in March with some car repairs that could have been delayed. And he still plans to vacation in May in Mexico with his wife, Jackie.

The couple, who live just outside Cleveland, feel secure in their jobs. Loehrke is a salesman for a company that makes T-shirts, cups, key chains and other promotional products. Business has picked up in the past year as the economy has improved. His wife is a pharmacist.

“Everything that we’ve planned to do we’re still doing,” Loehrke says.

That proves their case!!!
:(

The Loehrkes both have heavy student debt and so are focused on keeping their expenses in check. They both drive used cars. That’s enabled them to build up some savings and made it easier to absorb the tax increase.

New threats have emerged. Across-the-board government spending cuts kicked in March 1. The spending cuts have triggered government furloughs and could lead private companies that do business with the government to cut staff. And the cuts are expected to shave a half-point from economic growth this year.

And that’s just the first order effect.

Even so, most economists are relieved that consumers have proved so resilient so far.

“It’s very encouraging that consumers and thus the broader economy have been able to weather that storm as well as they have,” says Mark Zandi, an economist at Moody’s Analytics.

‘The beatings will continue until morale improves’

Overall view of the economy

This is my overall view of the economy.

The US was on the move by Q4 last year. A housing and cars (and student loans) driven expansion was happening, with slowing transfer payments and rising tax revenues bringing the deficit down as the automatic stabilizers were doing their countercyclical thing that would eventually reverse the growth. But that could take years. Look at it this way. Someone making 50,000 per year borrowed 150,000 to buy a house. The loan created the deposit that paid for the house. The seller of the house got that much new income, with a bit going to pay taxes and the rest there to be spent. Maybe a bit of furniture etc. was bought on credit as well, again adding income and (gross) financial assets to the recipients of the borrowers spending. And increasing sales added employment as well as output, albeit not enough to keep up with population growth etc.

I was very hopeful. Back in November, after the ‘Obama is a socialist’ sell off, I wrote that it was time to buy stocks and go play golf for three years, as, left alone, the credit accelerator in progress could go on for a long time.

But it wasn’t left along. Only a few weeks later the cliff drama began to intensify, with lots of fear of going over the ‘full cliff’. While that didn’t happen, we did go over about 1/3 cliff when both sides let the FICA reduction expire, thus removing some $170 billion from 2013, along with strong prospects of an $85 billion (annualized) sequester at quarter end. This moved me ‘to the sidelines’. Seemed to me taking that many dollars out of the economy was a serious enough negative for me to get out of the way.

But the Jan and then Feb numbers showed I was wrong, and that the consumer had continued to grow his spending as before via housing and cars, etc. Even the cliff constrained -.1 GDP of Q4 was soon revised up to .4. Stocks kept moving up and bonds moved higher in yield, even as the sequester kicked in, with the market view being the FICA hike fears were bogus and same for the sequester fears. Balancing the budget and getting the govt out of the way does indeed work to support the private sector. The UK, Eurozone, and Japan were exceptions. Austerity inherently does work. And markets were discounting all that, as it’s what market participants believed and the data supported.

Then, it all changed. April releases of March numbers showed not only suddenly weak March numbers, but Jan and Feb numbers revised lower as well. The slope of things post FICA hike went from positive to negative all at once. The FICA hike did seem to have an effect after all. And with the sequesters kicking in April 1, the prospects for Q2 were/are looking worse by the day.

My fear is that the FICA hikes and sequesters didn’t just take 1.5% of GDP ‘off the top’ as forecasters suggest, leaving future gains from the domestic credit expansion there to add to GDP as they had been. That is, the mainstream forecasts are saying when someone’s paycheck goes down by $100 per month from the FICA hike, or loses his job from the sequester, he slows his spending, but he still borrows to buy a car and/or a house as if nothing bad had happened, and so GDP is reduced by approximately the amount of the tax hikes and spending cuts, with a bit of adjustment for the ‘savings multipliers’. I say he may not borrow to buy the house or the car. Which both removes general spending and also slows the credit accelerator, shifting the always pro cyclical private sector from forward to reverse. And the ‘new’ negative data slopes have me concerned it’s already happening. Before the sequesters kicked in.

Looking at Japan, theory and evidence tells me the lesson is that lower interest rates require higher govt deficits for the same level of output and employment. More specifically, it looks to me like 0 rates may require 7-8% or even higher deficits for desired levels of output and employment vs maybe 3-4% deficits when the central bank sets rates at maybe 5% or so, etc. And US history could now be telling much the same.

And another lesson from Japan we should have learned long ago is that QE is a tax that does nothing good for output or employment and is, if anything, ‘deflationary’ via the same interest income channels we have here. Note that the $90 billion of profits the Fed turned over to the tsy would have been earned in the economy if the Fed hadn’t purchased any securities. So, as always in the past, watch for Japan’s QE to again ‘fail’ to add to output, employment, or inflation. However, their increased deficit spending, if and when it materialize, will support output, employment, and prices as it’s done in the past.

Oil and gasoline prices are down some, which is dollar friendly and consumer friendly, but only back to sort of ‘neutral’ levels from elevated ‘problematic’ levels And there is risk that the Saudis decide to cut price for long enough to put the kibosh on the likes of North Dakota’s and other higher priced crude, wiping out the value of that investment and ending the output and employment and currency support from those sources. No way to tell what they may be up to.

So my overall view is negative, with serious deflationary risks looming.

And the solution is still fiscal- a tax cut and/or spending increase.
However, that seems further away then ever, as the President is now moving towards an additional 1.8 trillion of deficit reduction.

:(

Thaler’s Corner 04-22-2013 2013: And now?

Again, very well stated!

Thaler’s Corner

I must admit that I am at a loss for words these days. The analytical items at our disposal describe a situation so complex, given a myriad of contradictory influences, that I find it impossible to develop any sort of reasonable scenario.


I have spent a lot of time in recent weeks exchanging ideas and perceptions with academics, political officials and others in an effort to develop a coherent explanation of the events unfolding before us (Cyprus, wealth tax, etc.), but the conclusions are anything but conclusive!

Changes in financial securities will no longer be determined by purely economic factors but more and more by political decisions, such as whether or not to establish a real European banking union with all that implies in terms of cross-border budget transfer risks.

Whatever, lets take a look at the state of the real economy in the United Sates and Europe, given that it is still a bit early to draw any sort of conclusions about a third economic motor, Japan.

By the way, I strongly recommend that people check out the links in todays Macro Geeks Corner toward the end of the newsletter. It is interesting to see how two fairly divergent schools of thinking (the two first texts) end up with rather similar conclusions.

United States

In the United States, the economy is (logically) slowing as the effects of the Sequester slowly make themselves felt. Only the (increasingly discredited) partisans of Reinhold & Rogoffs constructive austerity thought it would not affect household consumption.

We had to wait for the hike in payroll taxes for the effect to be seen in retail sales figures, down 0.4% in March. Similarly, all the latest leading economic (PMI) and confidence indicators came in below expectations, which augurs for a soft patch in the US.

Moreover, the yens decline can only have a negative impact on America trade balance with Japan as it puts US exporters at a disadvantage, in particular, as they compete with their Japanese rivals on Asian markets. And the pitiful state of the European economy is not going to help this sector of the US economy either.

But there remains one bright spot, namely the residential real estate market, which should remain a powerful support in the quarters ahead. Check out one of my favorite graphs real animal rates.

Real animal rates in the US:


Full size image

These rates are calculated using a proprietary equation I developed, which includes, in addition to terms like mortgage interest rates, recent home price trends, the difference between the reported unemployment rate and that during periods of full employment, and the difference between the average length of unemployment and that existing in times of full employment.

With the Animal Spirits so dear to Keynes and behavioral science in mind, the goal was to factor in items more subjective than simple economic criteria (nominal borrowing rates) in the home purchase decision-making process of a household.

If experience has taught us anything, it is that the factors which most influence a potential homebuyers decision is his degree of job security and the feeling that prices can only rise.

The first point is that the only time these real animal rates dipped into negative territory (in the upper part of graph, transcribed in inverted scale) corresponds perfectly with the great real estate bubble of 1998 to 2006.

This big trend reversal occurred in 2006 when rates resurfaced above zero and thus below the graphs red line.

The only other time real animal rates became negative was in 1989, but that was abruptly reversed by the sharp hike in nominal interest rates.

In the current context, nominal interest rates are unlikely to undergo any such sharp hike in the quarters ahead, and this dip of real animal rates into negative territory should enable the real estate market to continue to recover. This all the more true, given that the yens decline will only strengthen disinflationary trends in North America, which ensure accommodative monetary policies for some time to come!

All you need to do is look at the steep decline in inflationary expectations, as expressed by the TIPS market in the US, to understand that investors seem to have finally realized that QE policies have nothing to do with the so-called dollar printing press. Notwithstanding the ZeroHedge paranoids!

That said, existing home sales in the US, out just a few minutes ago, came in weak, at -0.6% m-o-m (vs expected +0.4%, i.e. 4.92M vs 5M), which explains this afternoon shiver on stockmarket indices.

Now, as the IMF has said in recent days, the main brake on a worldwide recovery is the Eurozone, which remains paralyzed by the obsession of its northern member states on austerity and by the ECBs total and unforgivable incapacity to comply with its own mandate! In todays Macro Geeks Corner, you will find two instructive links on this matter.

Eurozone

Instead of harping on the endless stream of errors made by our beloved European monetary and governmental leaders, I prefer to comment on some far more instructive graphs.

Lets start with our graph on aggregate 2-year Eurozone government bond rates, which have proven to be so useful in recent years for evaluating the ECBs reaction function.

This rate, currently at a record low 0.55%, is now well below the 0.75% set for the refi. This stems from two factors.

First, in view of the state of the economy and the latest comments by certain ECB board members, investors expect that the refi rate will very soon (May or June) be cut to 0.50%.

Second, certainty that short-term interest rates, like the Eonia, which have been stuck between 5 bps and 12 bps for the past 9 months, are not going to rise anytime soon is pushing investors to seek yields wherever they can still find them, like in Spain and Italy where 2-year bonds still fetch between 1.95% and 1.25%, now that they are assured that, henceforth, in case of insolvency, bank depositors will be forced to pay the bill without pushing sovereign issuers into default, as happened in Greece!

Aggregated Eurozone government 2-year rate:

Full size image

However, we have reason to be concerned that the ECB, if it does lower the refi to 0.50%, will be satisfied with what it already deems a low rate and highly accommodative monetary policy. Such is far from being the case, even if we go by the ECBs own obsolete aggregates, like M3, as money velocity continues to skid to a halt, following Cyprus.

And all this has an impact on the real economy, as you can see in the following graphs.

Eurozone Industrial Production

Full size image

The least we can say is that this graph is particularly distressing. Of course, it does not account for the economys industrial aspect, which some call the old economy. But it provides a whole lot of jobs and no economic area can afford to neglect it.

And the impact of Mr Sarkozys renowned Walk of Canossa, following his summons by Ms Merkel in July 2011 to Berlin where the unfortunate decision to create the first sovereign default of a developed country was endorsed (Greek PSI), is very clear on this graph. Together with a hardening of austerity policies and the nefarious consequences of the ECBs hikes of benchmark interest rates in the spring of 2011, this decision torpedoed already distressed economies, with the consequences we all know today.


But if there is one depressing economic indicator, which reflects even more cruelly how austerity affected the Eurozone, it is surely the unemployment curve.

Eurozone Unemployment

Full size image

Here again, no comment is needed. I included earlier in this newsletter the graph comparing the US and Eurozone curves, but even that is no longer all that relevant. If people are happy to underperform the United States, who cares? If the Eurozone wants to try liquidationist economic policies to help drive home the morality message, it has every right to do so, just as its citizens merit the leadership they elect.

But to go from there to creating a situation of hysteria, leading to an increasingly large segment of the active population being ejected from the labor market, is a big step that must never be taken.

In some countries, the figures are just horrifying, with nearly 30% general unemployment and over 50% for those under 25 years of age. It is incredible that some continue to boast the merits of such policies for countries like Ireland while ignoring the daily siphoning of the population due to massive immigration to seek jobs elsewhere!!

I wonder if those responsible for such policies have forgotten the consequences of such an approach in Europe and the breakdown in the social fabric during the Great Depression, especially now, with so many leaders spicing their speeches with anti-German references?

This pathetic situation, reflecting month after month of economic policies based on no worthwhile or credible foundations, be it on a theoretical or empirical basis, explains why I am having a hard time re-establishing a decent pace of publication.

This is especially so in that the conflict between this depressive macro situation and the strong efforts undertaken by the Fed and the BoJ (among others) to reignite economic activity leave no space for laying out clear asset allocation biases.

We continue to enable our clients to take advantage of opportunities on option markets which make it possible during these troubled times to make bets on the cheap but without any real conviction.

Has our asset allocation strategy, dating from 2007 (a bit early, I know), of favoring government debt came to maturity with German 10-year rates at 1.23%, i.e. more than 30 bps below those of the United States?

Will European stock markets continue to suffer from our big fear, the Japanese syndrome? Or will popular pressure push the ECB and the Austrian School proponents to realize that they have a modern currency at their disposal and that reversing their entire intellectual edifice is possible?


Despite all my efforts, studies, reading and discussion, I am totally incapable of responding to these questions, which a great lesson in humility. Sorry for the consequences in terms of this newsletters clarity and frequency of publication, but if anyone has any ideas, I am all ears!

The Macro Geeks Corner:

Dear Northern Europeans Monetary easing is not a bailout

A factual rebuttal of remarks of ECB chief Jrg Asmussen, made at the Bank of America/Merrill Lynch Investor conference

Breaking bad inflation expectations

financial repressionists painting frauds

Conclusion: The financial repressionists have it all backwards

So the idea is the govt is ‘pushing rates down’ through QE and the like, thereby keeping rates below the rate of inflation, and that without this active ‘financial repression’ rates would otherwise be higher and not ‘repressed’.

That is, the govt is interfering with the ‘free market’ by said pushing of rates down, and this ‘distortion’ adversely affects all kinds of things, as happens with any interference in said ‘free markets’.

Well, to begin with, interest rates are subject to market forces with fixed exchange rate regimes, like a gold standard, currency board arrangement, or other such ‘peg’ where the govt by law exchanges the currency to some ‘reserve’ thing at a fixed rate. So today this would, at best, apply to HK, for example.

However, it does not apply to floating fx regimes, where the currency has no conversion features at the govt of issue, like the $US, yen, pound, euro, etc. etc. etc. contrary to the claims of the repressionists.

Either way, the currency is a public monopoly, with taxation a coercive, non market ‘interference’.
And, of course, monopolists are ‘price setters’ rather than ‘price takers’.

With a gold standard, for example, the govt sets the price of gold and in theory allows all other price to express relative value as they continuously gravitate towards floating indifference levels.
This includes interest rates (the ‘own rate’ for the currency) which then fluctuate based on ‘storage costs’ of the object of conversion which includes govt default risk with regard to conversion. The same holds for other fixed exchange rate arrangements.

With floating exchange rate policy, without govt interference, the ‘risk free rate’ is permanently at 0%, as there is no conversion option, and therefore no conversion default risk.

In this case, the only way rates can be supported at higher levels is by ‘govt interference’. This includes paying interest on reserve balances at the Fed, issuing Treasury Securities, and open market operations where the Fed buys and sells Treasury securities directly or via repurchase agreements and other such arrangements. All of these function as ‘interest rate support’ to keep rates higher than otherwise.

So once again, and another ‘who would have thought’, it seems the mainstream has it entirely backwards. Yes, govt is ‘interfering’ in the interest rate markets, but rather than engaging in ‘repression’ via ‘pushing rates down’ it’s instead engaging in ‘rentier support’ by pushing rates up.

So if these ‘free market types’ want to make the case that govt isn’t sufficiently interfering to push rates up to adequately support holders of various financial assets, fine. Bring it on! But more likely the realization of what they’ve actually be purporting should be embarrassing enough to cause them to back off for at least 3 or 4 minutes, don’t you think?

(Feel free to distribute)

Reinhart-Rogoff data errors found!

If true, this is very bad:

Researchers Finally Replicated Reinhart-Rogoff, and There Are Serious Problems.

By Mike Konczal

April 16 (Bloomberg) — In 2010, economists Carmen Reinhart and Kenneth Rogoff released a paper, “Growth in a Time of Debt.” Their “main result is that…median growth rates for countries with public debt over 90 percent of GDP are roughly one percent lower than otherwise; average (mean) growth rates are several percent lower.” Countries with debt-to-GDP ratios above 90 percent have a slightly negative average growth rate, in fact.

This has been one of the most cited stats in the public debate during the Great Recession. Paul Ryan’s Path to Prosperity budget states their study “found conclusive empirical evidence that [debt] exceeding 90 percent of the economy has a significant negative effect on economic growth.” The Washington Post editorial board takes it as an economic consensus view, stating that “debt-to-GDP could keep rising and stick dangerously near the 90 percent mark that economists regard as a threat to sustainable economic growth.”

Is it conclusive? One response has been to argue that the causation is backwards, or that slower growth leads to higher debt-to-GDP ratios. Josh Bivens and John Irons made this case at the Economic Policy Institute. But this assumes that the data is correct. From the beginning there have been complaints that Reinhart and Rogoff weren’t releasing the data for their results (e.g. Dean Baker). I knew of several people trying to replicate the results who were bumping into walls left and right – it couldn’t be done.

In a new paper, “Does High Public Debt Consistently Stifle Economic Growth? A Critique of Reinhart and Rogoff,” Thomas Herndon, Michael Ash, and Robert Pollin of the University of Massachusetts, Amherst successfully replicate the results. After trying to replicate the Reinhart-Rogoff results and failing, they reached out to Reinhart and Rogoff and they were willing to share their data spreadsheet. This allowed Herndon et al. to see how how Reinhart and Rogoff’s data was constructed.

They find that three main issues stand out. First, Reinhart and Rogoff selectively exclude years of high debt and average growth. Second, they use a debatable method to weight the countries. Third, there also appears to be a coding error that excludes high-debt and average-growth countries. All three bias in favor of their result, and without them you don’t get their controversial result. Let’s investigate further:

Selective Exclusions. Reinhart-Rogoff use 1946-2009 as their period, with the main difference among countries being their starting year. In their data set, there are 110 years of data available for countries that have a debt/GDP over 90 percent, but they only use 96 of those years. The paper didn’t disclose which years they excluded or why.

Herndon-Ash-Pollin find that they exclude Australia (1946-1950), New Zealand (1946-1949), and Canada (1946-1950). This has consequences, as these countries have high-debt and solid growth. Canada had debt-to-GDP over 90 percent during this period and 3 percent growth. New Zealand had a debt/GDP over 90 percent from 1946-1951. If you use the average growth rate across all those years it is 2.58 percent. If you only use the last year, as Reinhart-Rogoff does, it has a growth rate of -7.6 percent. That’s a big difference, especially considering how they weigh the countries.

Unconventional Weighting. Reinhart-Rogoff divides country years into debt-to-GDP buckets. They then take the average real growth for each country within the buckets. So the growth rate of the 19 years that England is above 90 percent debt-to-GDP are averaged into one number. These country numbers are then averaged, equally by country, to calculate the average real GDP growth weight.

In case that didn’t make sense let’s look at an example. England has 19 years (1946-1964) above 90 percent debt-to-GDP with an average 2.4 percent growth rate. New Zealand has one year in their sample above 90 percent debt-to-GDP with a growth rate of -7.6. These two numbers, 2.4 and -7.6 percent, are given equal weight in the final calculation, as they average the countries equally. Even though there are 19 times as many data points for England.

Now maybe you don’t want to give equal weighting to years (technical aside: Herndon-Ash-Pollin bring up serial correlation as a possibility). Perhaps you want to take episodes. But this weighting significantly reduces the average; if you weight by the number of years you find a higher growth rate above 90 percent. Reinhart-Rogoff don’t discuss this methodology, either the fact that they are weighing this way or the justification for it, in their paper.

Coding Error. As Herndon-Ash-Pollin puts it: “A coding error in the RR working spreadsheet entirely excludes five countries, Australia, Austria, Belgium, Canada, and Denmark, from the analysis. [Reinhart-Rogoff] averaged cells in lines 30 to 44 instead of lines 30 to 49…This spreadsheet error…is responsible for a -0.3 percentage-point error in RR’s published average real GDP growth in the highest public debt/GDP category.” Belgium, in particular, has 26 years with debt-to-GDP above 90 percent, with an average growth rate of 2.6 percent (though this is only counted as one total point due to the weighting above).

Being a bit of a doubting Thomas on this coding error, I wouldn’t believe unless I touched the digital Excel wound myself. One of the authors was able to show me that, and here it is. You can see the Excel blue-box for formulas missing some data:


This error is needed to get the results they published, and it would go a long way to explaining why it has been impossible for others to replicate these results. If this error turns out to be an actual mistake Reinhart-Rogoff made, well, all I can hope is that future historians note that one of the core empirical points providing the intellectual foundation for the global move to austerity in the early 2010s was based on someone accidentally not updating a row formula in Excel.

So what do Herndon-Ash-Pollin conclude? They find “the average real GDP growth rate for countries carrying a public debt-to-GDP ratio of over 90 percent is actually 2.2 percent, not -0.1 percent as [Reinhart-Rogoff claim].” Going further into the data, they are unable to find a breakpoint where growth falls quickly and significantly.

This is also good evidence for why you should release your data online, so it can be probably vetted. But beyond that, looking through the data and how much it can collapse because of this or that assumption, it becomes quite clear that there’s no magic number out there. The debt needs to be thought of as a response to the contigent circumstances we find ourselves in, with mass unemployment, a Federal Reserve desperately trying to gain traction at the zero lower bound, and a gap between what we could be producing and what we are. The past guides us, but so far it has failed to provide an emergency cliff. In fact, it tells us that a larger deficit right now would help us greatly.

U.S. Warns Japan on Yen

So does the US have a strong dollar policy, a weak dollar policy, or an ‘unchanged’ dollar policy?

In any case, President Obama and Congress still fail to recognize that imports are real benefits and exports real costs. And that net imports mean taxes can be lower and/or spending higher to sustain full employment levels of demand.

So what would you rather have?
1. A strong dollar, rising net imports, and lower taxes, or
2. A weak dollar, falling net imports, and higher taxes?

How hard is this???

As for Japan, the BOJ hasn’t actually done anything to weaken the yen. Nor has fiscal policy, at least yet, though if the announced deficit hike goes through it could be a modestly weakening influence. The trade flows going into deficit from surplus have hurt the yen, as gas and oil replaced the nukes that were shut down, though they are in the process of relighting them. And portfolio shifting has probably weakened the yen the most, with life insurance companies, pensions, etc. reportedly adding risk to their portfolios by shifting from yen assets to dollar and euro assets. Yes, this is a ‘one time’ adjustment, but it can be sizable and take years, or it could have already run its course. I personally have no way of knowing, but no doubt ‘insiders’ are fully aware of how this will play out.

Furthermore, the US is going the other way with tax hikes and spending cuts a firming influence on the dollar, which is at least part of the yen/dollar weakness.

Too many cross currents for me to bet on one way or another. If you have to trade it go by the charts and don’t watch the news…

U.S. Warns Japan on Yen

By Thomas Catan and Ian Talley

April 12 (WSJ) — The Obama administration used new and pointed language to warn Japan not to hold down the value of its currency to gain a competitive advantage in world markets, as the new government in Tokyo pursues aggressive policies aimed at recharging growth.

In its semiannual report on global exchange rates, the U.S. Treasury on Friday also criticized China for resuming “large-scale” market interventions to hold down the value of its currency, calling it a troubling development. The U.S. stopped short of naming China a currency manipulator, avoiding a designation that could disrupt relations between the world powers.

The Chinese Embassy didn’t immediately respond to a request for comment. A Japanese government official reached early Saturday in Tokyo declined to comment directly on the Treasury report, but said, “We will continue to abide by” recent commitments by global financial policy makers to avoid intentional currency devaluation”as we have done until now.”

The Treasury report appears to be part of a broader strategy by the Obama administration in response to a sharp shift in economic policy in Japan under new Prime Minister Shinzo Abe.

Hours before the currency warning, the White House said it had accepted Mr. Abe’s request to join negotiations to create an ambitious pan-Pacific free trade zone, despite objections from the American auto industry and other domestic sectors worried about new competition from Japan. The U.S. government is welcoming economic reforms in Japan while trying to discourage Tokyo from reverting to prior tactics of trade manipulation.

The Bank of Japan kicked off the latest drop in the yen by shocking markets last week by announcing plans for a massive increase in money supply, pledging a sharp increase in purchases of government bonds and other assets. The dollar has risen nearly 7% against the yen since then, and is up 15% since Mr. Abe came into power on Dec. 26.

Policy makers in Japan sensitive to currency complaints and warnings have repeatedly insisted in recent days that the yen’s sharp fall has merely been a byproduct of its stimulus policies, not a goal.

“We have no intention to conduct monetary policy targeting the exchange rate,” Haruhiko Kuroda, the new Bank of Japan governor whose policies have helped push down the yen, said in a Tokyo speech Friday. The BOJ’s policies, he added, were aimed at pulling Japan out of its long slump and that “achieving this goal will eventually provide the global economy with favorable effects.”

Amid sluggish global growth, governments face the temptation to lower the value of their currencies to juice exports. Those pressures are aggravated as central banks in the U.S., Europe and Japan seek to spur their economies by pushing cash into the systempolicies that have the effect of weakening their currencies. Seeking higher returns, investors are putting their money into emerging markets, putting upward pressure on those countries’ currencies and making their exports more expensive abroad.

The U.S. said it would “closely monitor” Japan’s economic policies to ensure they are aimed at boosting growth, not weakening the value of the currency. The yen is now hovering near a four-year low against the dollar, in response to Mr. Abe’s policies.

“We will continue to press Japanto refrain from competitive devaluation and targeting its exchange rate for competitive purposes,” the Treasury report said.

The yen quickly strengthened following the report, pulling the dollar to as low as 98.08, its lowest level this week, in a thin Friday afternoon market. The yen later gave back some of those gains, as investors came to see the comments less as criticism than as a statement of fact.

American officials have been walking a tightrope in recent months. While worried about a deliberate currency devaluation, they have also tried to encourage Japan’s attempts to jump-start growth, after years of frustration in Washington that Tokyo wasn’t doing enough to fix its economy.

“The wording does make it clear that the U.S. Treasury is watching extremely closely” to ensure that Japan lives up to promises not to purposely weaken its currency, said Alan Ruskin, a currency strategist at Deutsche Bank in New York. But, he added, “the report does not infer that Japan is breaking any agreement.”

The Treasury report, required by Congress and closely followed by markets, highlighted the need for more exchange-rate flexibility in many Asian countries, most notably China.

The Treasury used tougher-than-usual language on China, saying Beijing’s “recent resumption of intervention on a large scale is troubling.” While it noted that China had allowed the yuan to appreciate by about 10% against the dollar since June 2010or 16% including inflationthe report said the Chinese currency remained significantly undervalued and “further appreciation” was warranted.

The Treasury in recent years under both Republican and Democratic administrations has declined to formally label China as a currency manipulator, with officials suggesting publicly and privately that such a step would hurt efforts to encourage Beijing to let the yuan rise.

Still, the question of China’s currency has become shorthand in Washington for the broader debate over the economic relationship between the two countries. It was a frequent topic on the campaign trail for both President Barack Obama and GOP challenger Mitt Romney last year, as Mr. Romney pledged that if elected, he would label China a currency manipulator.

On Friday, some U.S. manufacturers criticized the Obama administration for its reluctance to call China a currency manipulator. “The Treasury Department’s latest refusal to label China a currency manipulator once again demonstrates President Obama’s deep-seated indifference to a major, ongoing threat to American manufacturing’s competitiveness, and to the U.S. economy’s return to genuine health,” said the U.S. Business and Industry Council, an industry lobby group.

The Treasury report also took South Korea to task for seeking to keep a lid on the won as foreign investors flood the economy with cash. “Korean authorities should limit foreign-exchange intervention to the exceptional circumstances of disorderly market conditions,” and capital controls should only be used to prevent financial instability, not reduce upward pressure on the exchange rate, Treasury said.