Fyi, we will be in Spain next week.
Here are some of the details:
There is a newly formed MMT Group in Spain called APEEP which stands for “Asociación para el Pleno Empleo y la Estabilidad de Precios”.
In an effort to bring MMT into the political debate in Spain, they will be hosting me for a presentation of the Spanish translation of “The Seven Deadly Innocent Frauds of Economic Policy”, starting with a presentation in Madrid on the 14th of September, Valencia on the 15th of September, and Vila-real on the 17th of September.
Here are links for the events, including time/date/location
14th September Madrid
15th September Valencia
17th September VilaRealAnd this is the press release for the events containing more details.
Also:
Asociación Para el Pleno Empleo y la Estabilidad de Precios (APEEP) (Association for Full Employment and Price Stability), is a non-profit organization devoted to raising awareness and disseminating Modern Monetary Theory amongst the Spanish public. APEEP believes that full employment and price stability are compatible if public policy is conducted within an MMT framework. The current economic crisis within the Eurozone highlights the need for a Post Keynesian and MMT approach to public policy.
You’d think by now word would be out it’s just a placebo, but ancient beliefs tend to linger on…
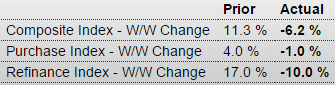
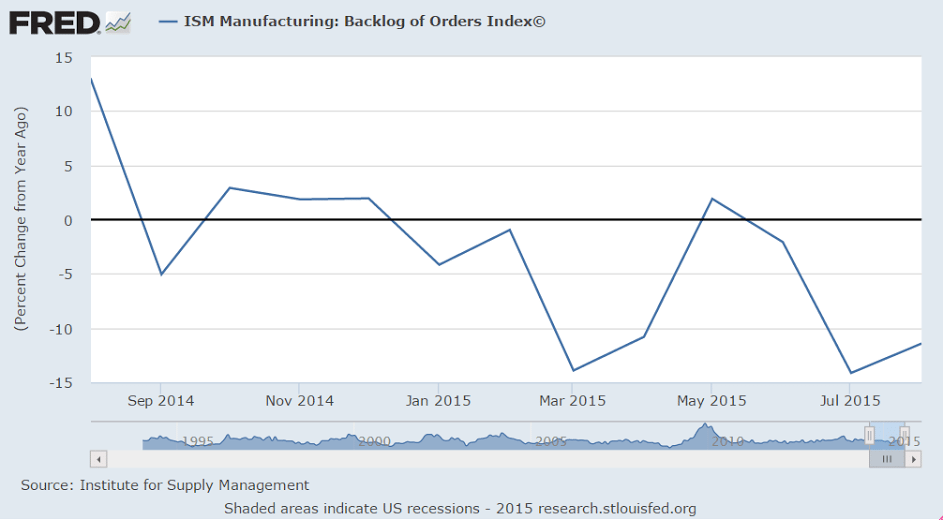
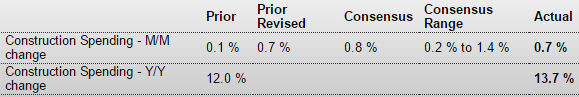
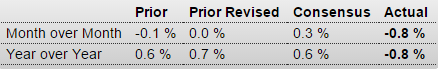
Not good- sales down and inventories remain elevated:
United States : Wholesale Trade
Highlights
Factory inventories held stable in July as did wholesale inventories, down 0.1 percent against a 0.3 percent decline in sales that leaves the stock-to-sales ratio unchanged at 1.30. Wholesale inventories look light for machinery and apparel but heavy for farm products and metals.
The nation’s inventories are heavier than they were last year which may limit future production and hiring. Next data on inventories will be the business inventories report on Tuesday.
MONTHLY WHOLESALE TRADE: SALES AND INVENTORIES July 2015 Sales. The U.S. Census Bureau announced today that July 2015 sales of merchant wholesalers, except manufacturers’ sales branches and offices, after adjustment for seasonal variations and trading-day differences but not for price changes, were $449.5 billion, down 0.3 percent (+/-0.5)* from the revised June level and were down 4.2 percent (+/-1.4%) from the July 2014 level. The June preliminary estimate was revised upward $1.0 billion or 0.2 percent.

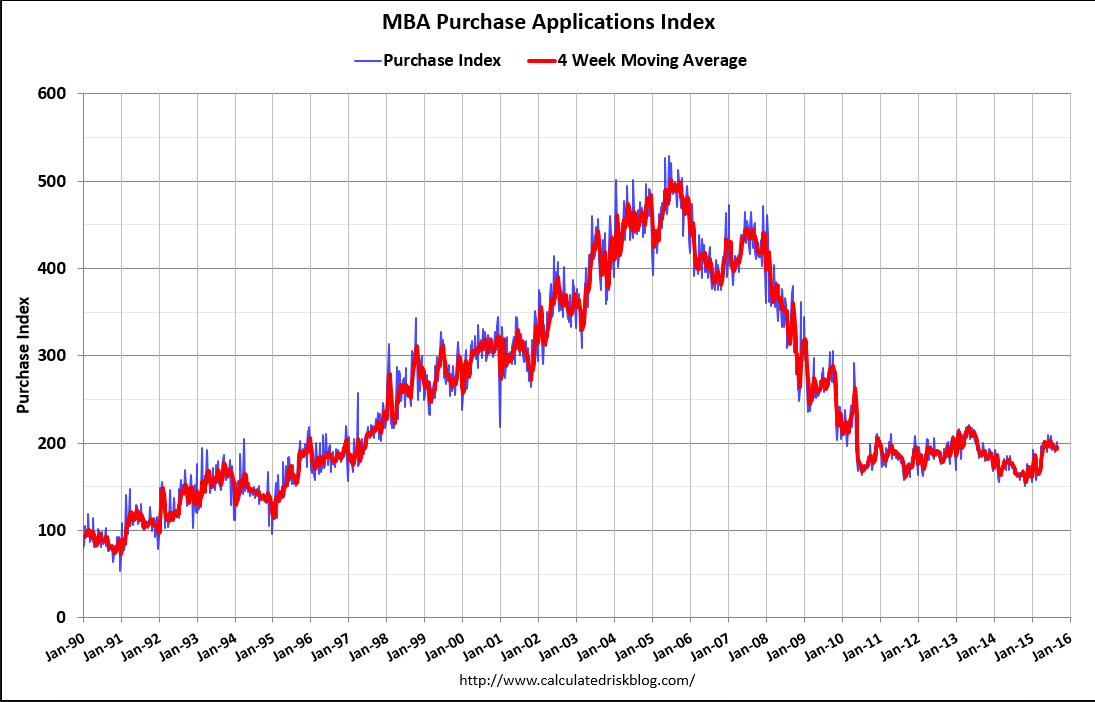
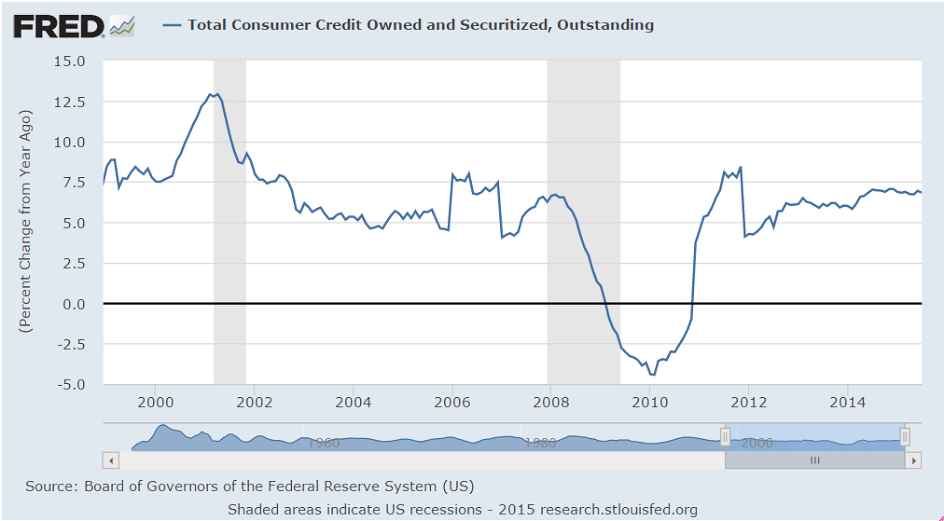
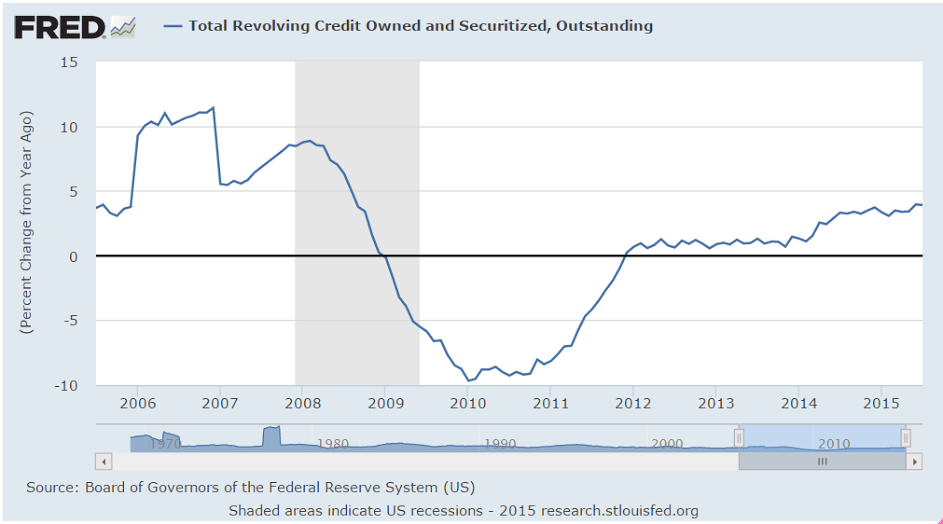
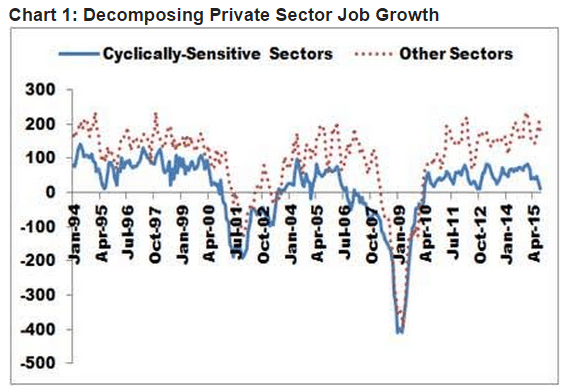
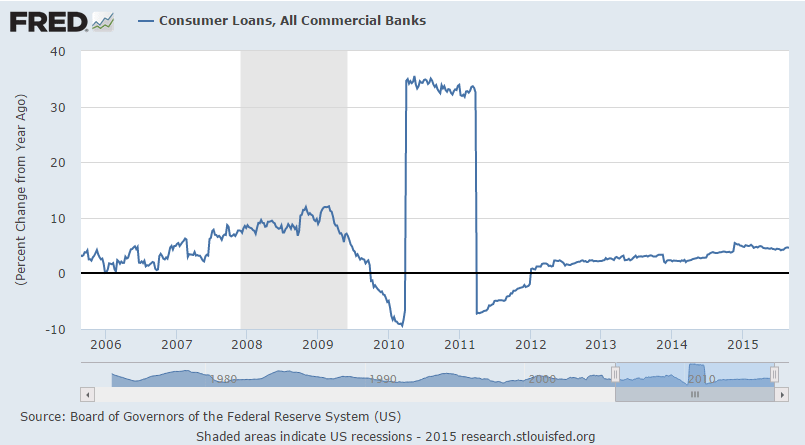
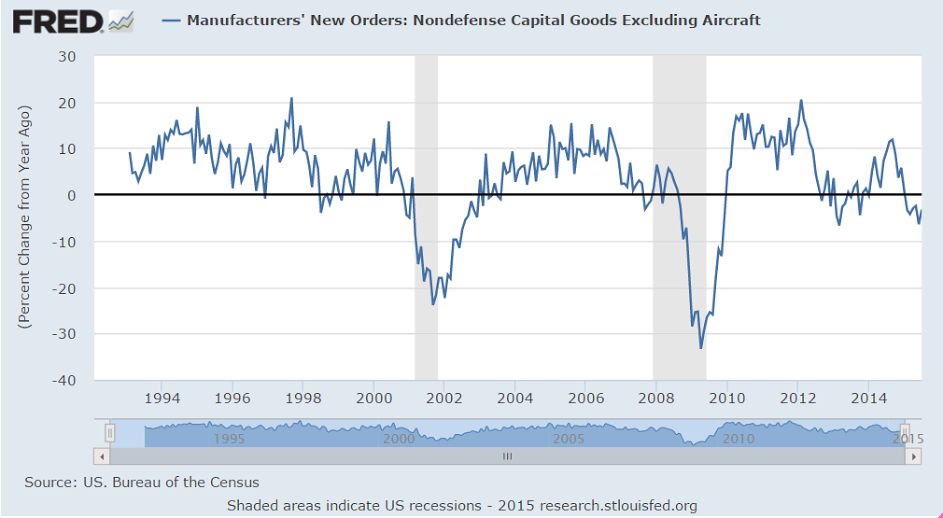
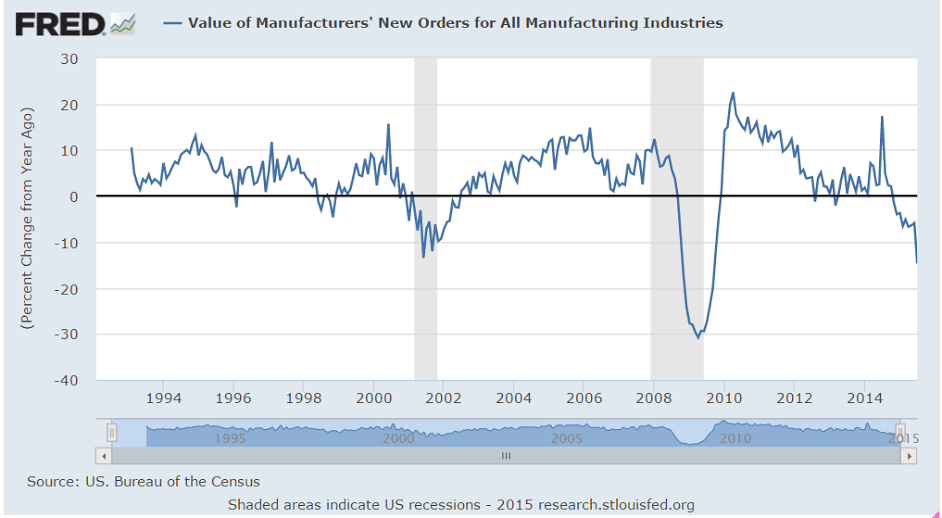
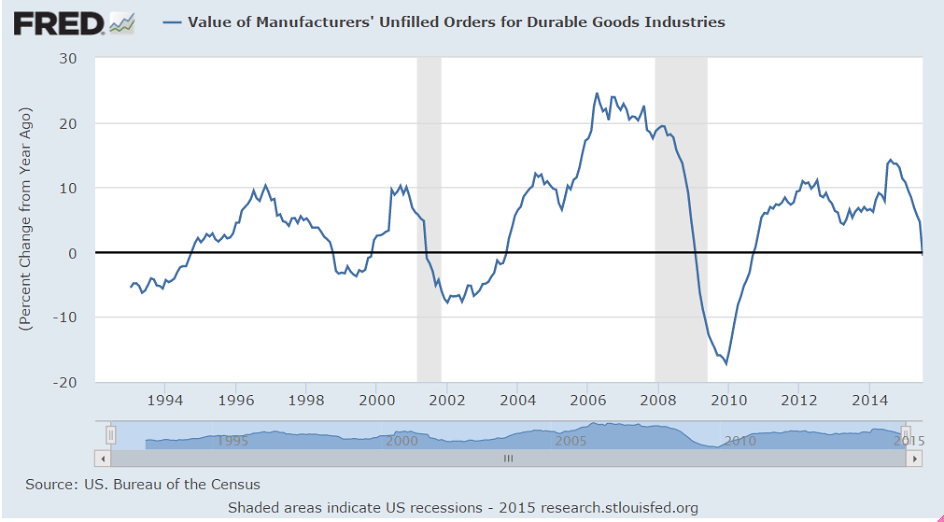
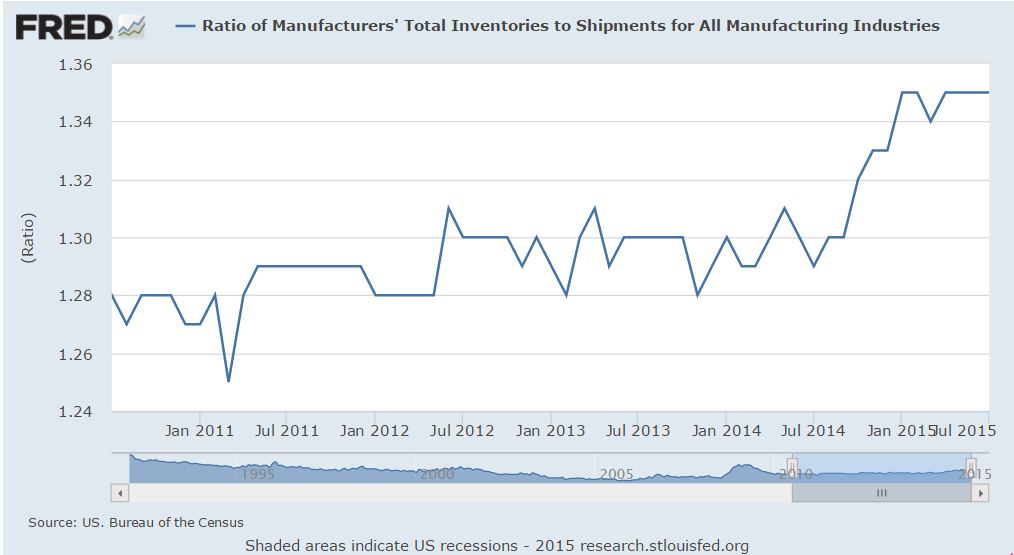
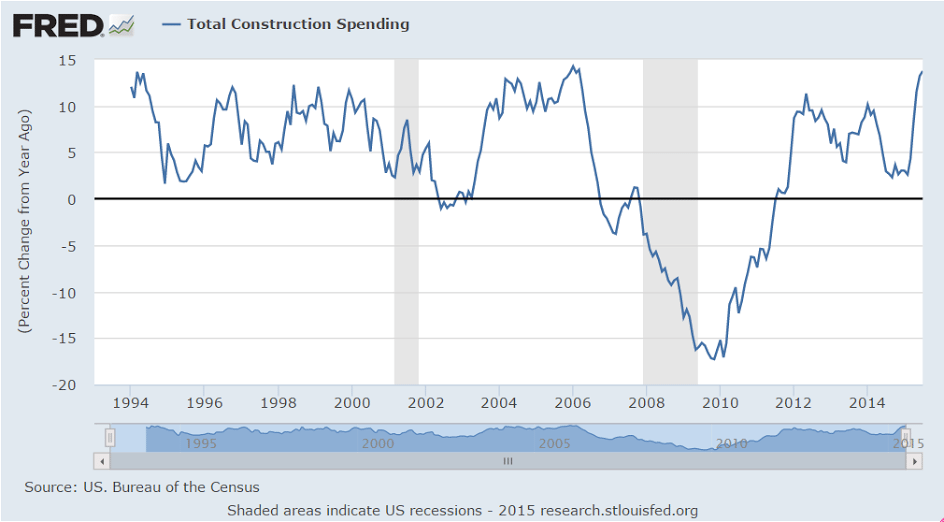
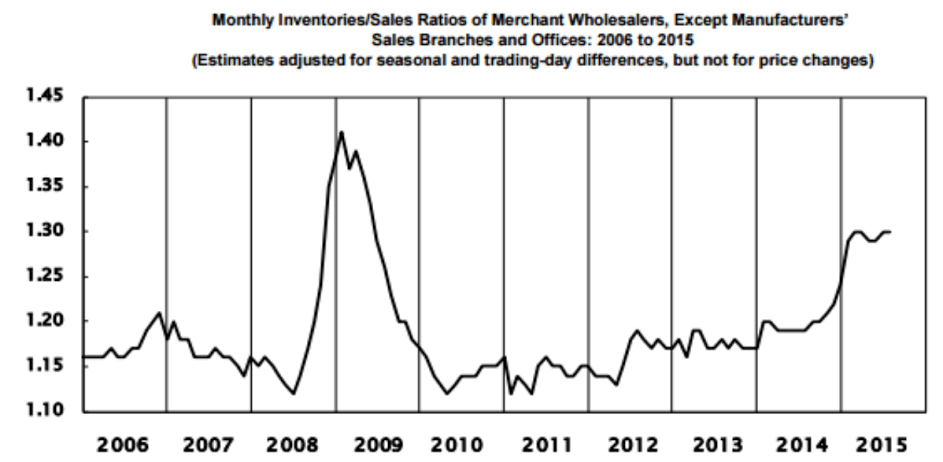
This chart is now looking a lot like prior recessions:
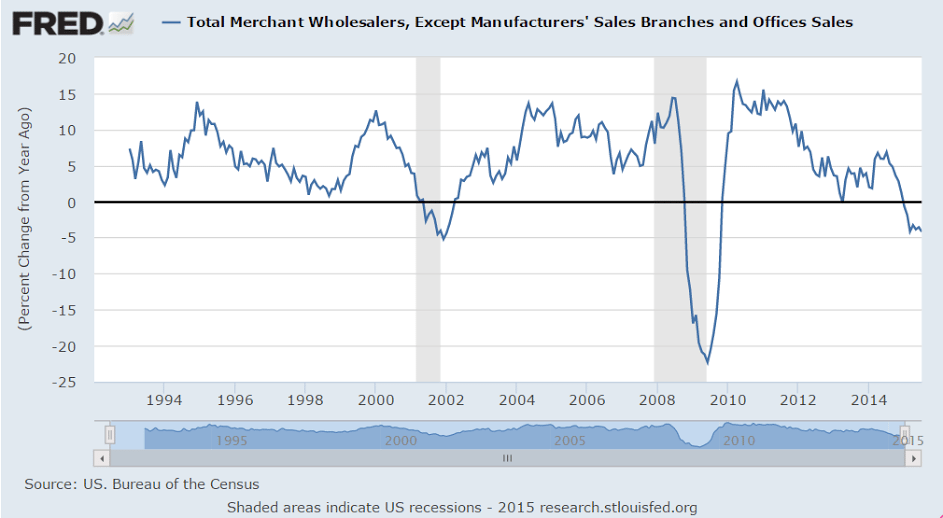
Inventories/Sales Ratio. The July inventories/sales ratio for merchant wholesalers, except manufacturers’ sales branches and offices, based on seasonally adjusted data, was 1.30. The July 2014 ratio was 1.19.
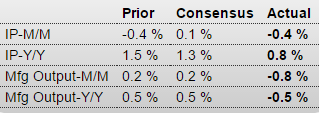
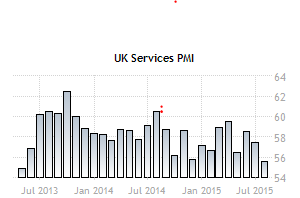
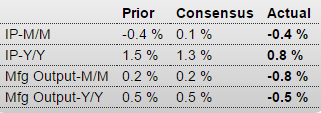
Great Britain : Industrial Production
France : Industrial Production
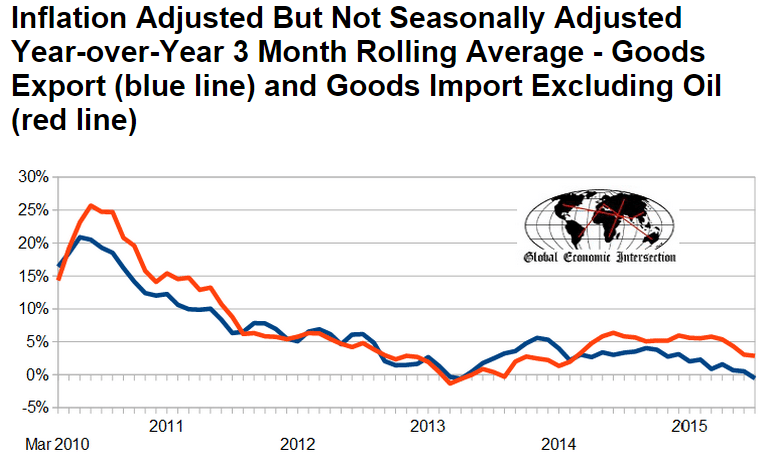
United States : Import and Export Prices
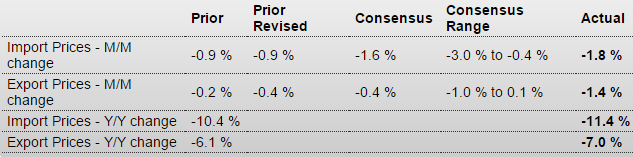
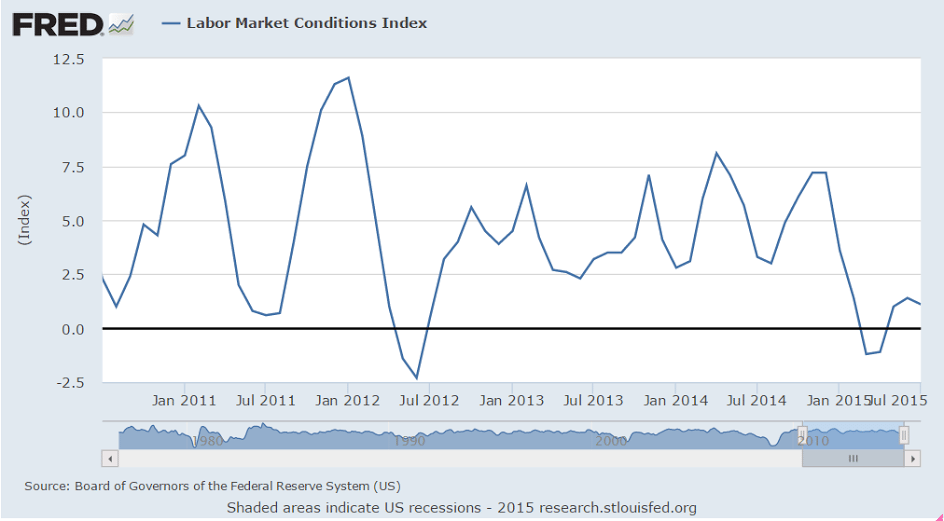
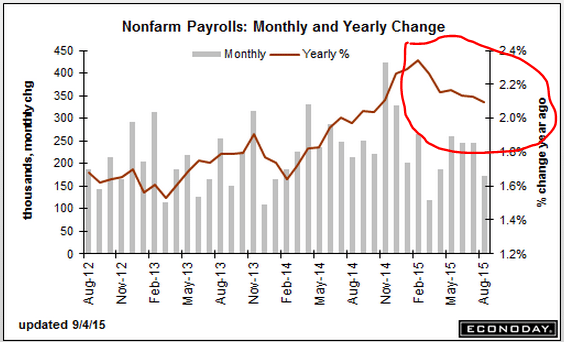
None of this is considered the ‘some improvement’ Chairman Yellen was looking for going into the Fed meeting next week…