Producer Price Index, Consumer sentiment, Italy IP

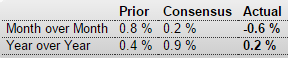
United States : PPI-FD
er-9-11-1

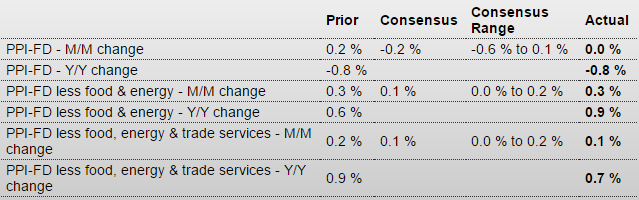
Down again, and not wrong to say it peaked shortly after oil prices collapsed. See chart below:

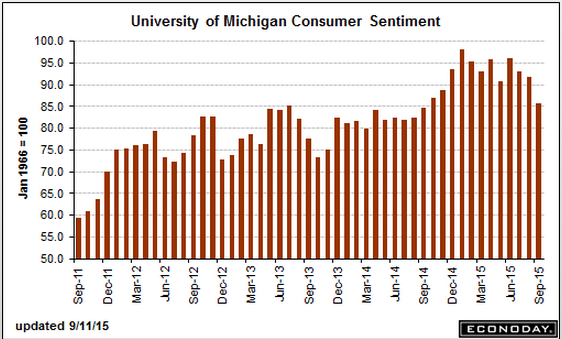
United States : Consumer Sentiment
er-9-11-2
Highlights
Just when you think you’ve gotten through the week, consumer sentiment dives and, perhaps, tips the balance against a rate hike. The mid-month September flash for the consumer sentiment index is down more than 6 points to 85.7 which is below Econoday’s low-end forecast. The index is now at its lowest point since September last year.

Weakness is centered in the expectations component which is down more than 7 points to 76.4, also the lowest reading since last September. Weakness in this component points to a downgrade for the outlook on jobs and income. The current conditions component also fell, down nearly 5 points to 100.3 for its weakest reading since October. Weakness here points to weakness for September consumer spending. Inflation readings are quiet but did tick 1 tenth higher for both the 1-year outlook, at 2.9 percent, and the 5-year, at 2.8 percent.

New York Fed President William Dudley himself has said he is focused on this report as an early indication of how U.S. consumers are responding to Chinese-based market turbulence. These results offer a rallying cry for the doves at next week’s FOMC meeting.
er-9-11-3

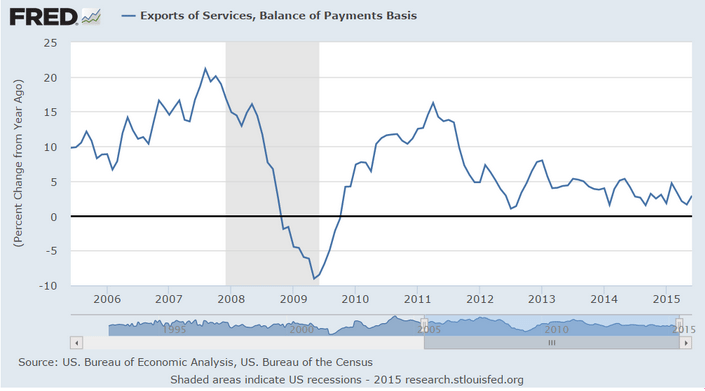
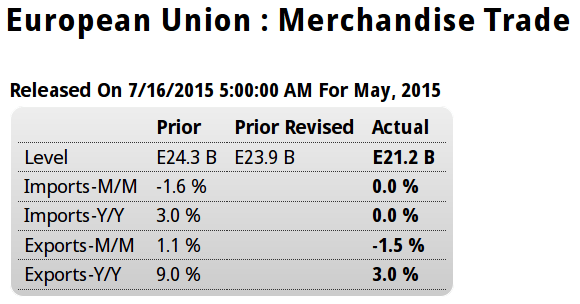
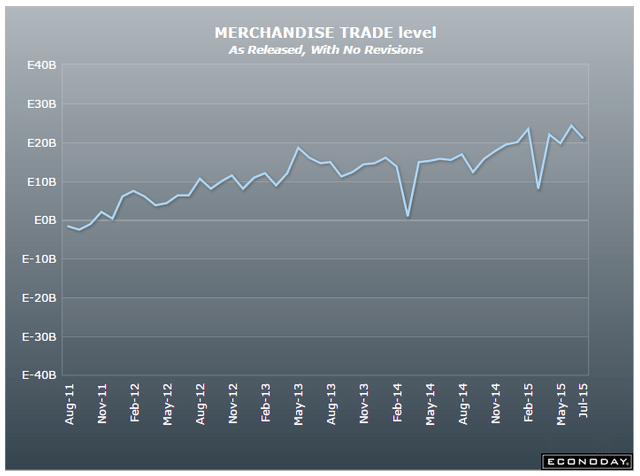
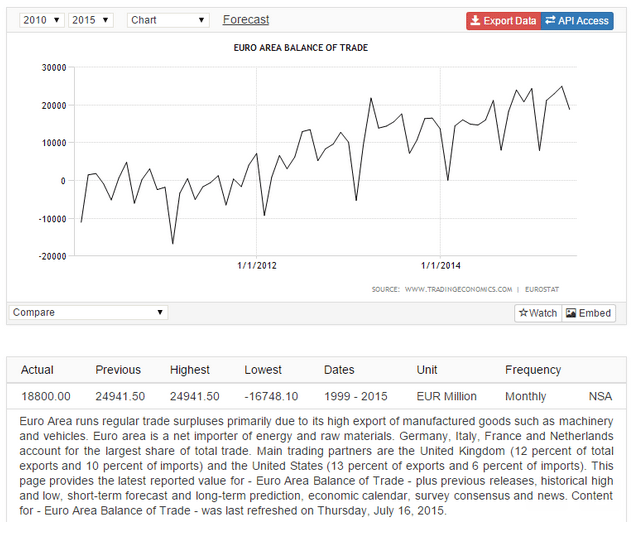
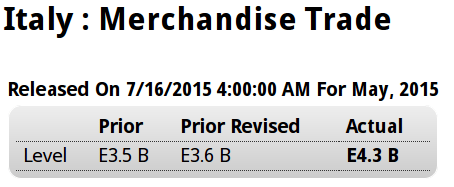
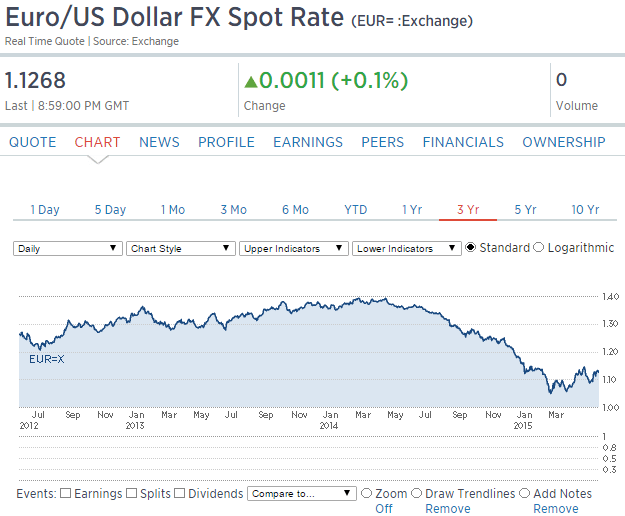
Low euro helping Italy:

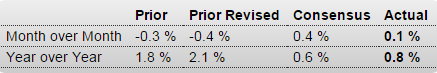
Italy : Industrial Production
er-9-11-4
Highlights
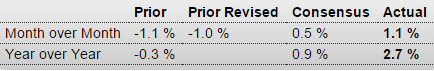
The goods producing sector comfortably exceeded expectations in July. A 1.1 percent monthly increase in output ex-construction followed a minimally smaller revised 1.0 percent drop in June for annual workday adjusted growth of 2.7 percent, up from minus 0.3 percent at the end of the second quarter. The monthly profile remains volatile but the trend at least appears to be mildly positive.

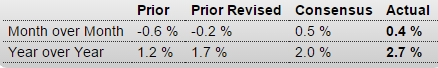
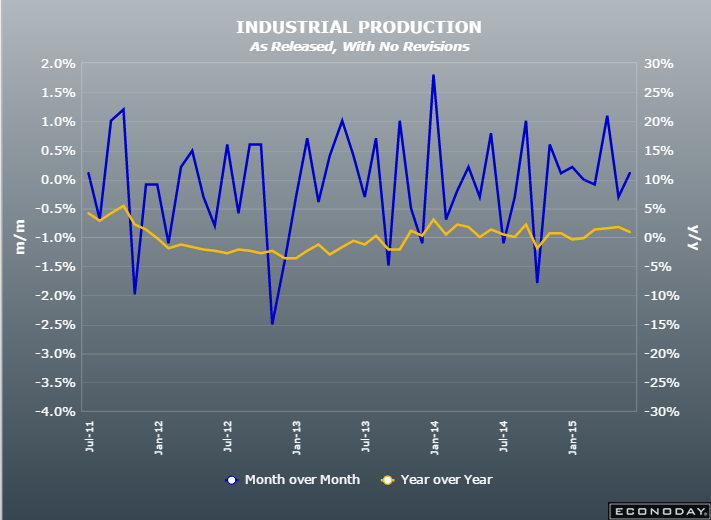
July’s monthly bounce, the sharpest since June 2014, was reassuringly broad-based. The erratic energy subsector (7.1 percent) led the way but there were tidy gains too in consumer goods (1.0 percent), capital goods (0.3 percent) and intermediates (0.6 percent).

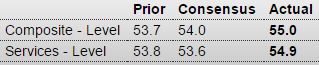
July’s data put overall industrial production (ex-construction) 0.7 percent above its average level in the second quarter when it climbed 0.5 percent versus the January-March period. Moreover, while August’s manufacturing PMI (53.8) saw its lowest level since April, it still indicated further healthy increases in both output and, importantly, new orders. Accordingly it looks as if goods production should provide useful support to third quarter GDP growth. That said, the sector still has a long way to go to get anywhere near its pre-Great Recession peak in April 2008. Compared with then, output is still down some 24 percent.

France PMI, Germany PMI, EU PMI, EU Retail Sales, UK service PMI, US Trade, ISM Non Manufacturing, Saudi Pricing

France : PMI Composite
er-9-4-1
Highlights
French private sector activity in August expanded at a significantly slower pace than indicated in the flash report according to the final PMI data for the month. At just 50.2, a 7-month low, the key composite output index was revised down an unusually large 1.1 points versus its preliminary reading to stand 1.3 points below its final July mark and close enough to 50 to signal a period of virtual stagnation in economic activity.

The flash service sector PMI was reduced by 1.2 points to 50.6, also a 7-month trough. As previously indicated, what growth there was reflected stronger new orders and rising backlogs although the growth rate of both hit multi-month lows. Certainly firms were not confident enough to add to headcount although, rather surprisingly, business expectations still climbed to their highest level since March 2012.

Meantime, another increase in input costs saw margins squeezed still further as service provider charges continued to fall.

The final PMI figures suggest that the French economy was really struggling last month. Total output was only flat in the April-June period and the survey data so far suggest little better this quarter.

Germany : PMI Composite
er-9-4-2
Highlights
August’s flash composite output index was revised up a full point to 55.0 in the final data for the month. The new level was 1.3 points above July’s final reading, a 5-month high and strong enough to indicate a solid performance by the economy in mid-quarter.

The adjustment to the composite output gauge came courtesy of the service sector for which the preliminary PMI was revised some 1.3 points firmer to 54.9, also its best reading in five months. New orders rose strongly, backlogs were up and employment posted its largest gain since February. Against this backdrop, business expectations for the year ahead climbed to a 4-month peak.

What little progress they continue to make will evaporate with a strong euro, which I see as inevitable given their trade surplus:

European Union : PMI Composite
er-9-4-3
Highlights
The final composite output index for August weighed in at 54.3, a couple of ticks stronger than its flash estimate and 0.4 points above its final July mark.

The flash services PMI was nudged just 0.1 points higher but, at 54.4, now matches June’s 4-year high. Increased output was supported by rising new orders and a sizeable increase in backlogs which, in turn, helped to ensure that employment growth remained respectably buoyant. Firms also became more optimistic about the economic outlook and business expectations for the year ahead climbed higher following July’s 7-month low. Meantime, inflation developments were mixed. Hence, although higher wages and salaries prompted another rise in input costs, margins were squeezed further as service provider charges declined for a remarkable forty-fifth consecutive month.

Regionally, the best performer in terms of the composite output measure was Ireland (59.7) ahead of Spain (58.8) and Italy (55.0 and a 53-month high). Germany (55.0) also had a good month but France (50.2 and a 7-month low) all but stagnated and remains a real problem for Eurozone economic growth.

The final PMI figures suggest that the Eurozone economy is on course for something close to a 0.4 percent quarterly growth rate in the current period, a slight improvement on the second quarter’s 0.3 percent rate. While this would be good news, faster rates of expansion will likely be needed if inflation is to meet the ECB’s near-2 percent target over the central bank’s 2-year policy horizon.

European Union : Retail Sales
er-9-4-4
Highlights
Retail sales were slightly weaker than expected in August but with July’s decline more than halved, annual growth of purchases still comfortably exceeded the market consensus. Volumes were 0.4 percent firmer on the month after a 0.2 percent drop in June for a workday adjusted yearly rise of 2.7 percent, up from 1.7 percent last time.

July’s monthly rebound was led by a 0.8 percent jump in purchases of auto fuel and without this, non-food sales were just 0.1 percent higher having only stagnated in June. Food recorded a 0.2 percent advance. As a result, overall sales in July were 0.3 percent above their average level in the second quarter when they also increased 0.3 percent.

Regionally the advance was dominated by a 1.4 percent monthly jump in Germany. Spain (0.6 percent) also made a positive contribution but France (minus 0.2 percent) saw its first decline since March. Elsewhere, there were solid gains in Estonia (2.5 percent), Malta and Portugal (both 1.1 percent) but Slovakia (minus 0.2 percent) struggled.

Growth of retail sales has slowed in recent months, in keeping with signs that consumer confidence may have peaked, at least for now. According to the latest EU Commission survey, household morale improved slightly in August but still registered its second weakest reading since January. Consumption may continue to rise over coming months but the signs are that its contribution to real GDP growth will be only limited.
er-9-4-5

I’ve been suggesting exports would slow more than what’s been reported so far, though year over year numbers are in decline. It may show up in revisions down the road:
er-9-4-6

er-9-4-7

International Trade
er-9-4-9

Highlights
The nation’s trade gap narrowed to a nearly as expected $41.9 billion in July following an upward revised gap of $45.2 billion in June (initially $43.8 billion). The improvement reflects a monthly rise of 0.4 percent in exports, which were led by autos, and a 1.1 percent contraction in imports that reflected a decline in pharmaceutical preparations and cell phones which helped offset a monthly rise in imports of oil where prices were higher in July.

Aside from autos, exports of industrial supplies, specifically nonmonetary gold, were strong in July while exports of capital goods also expanded. This helped offset a monthly decline in exports of civilian aircraft and consumer goods. Turning again to imports, other details include a rise in capital goods in what is the latest sign of life for business investment.

By nation, the gap with China widened slightly, to an unadjusted $31.6 billion in the month, while the gap with the EU widened more substantially to $15.2 billion, again unadjusted which makes month-to-month conclusions difficult. Gaps with Mexico and Canada both narrowed.

This report is another positive start to the quarter and will lift early third-quarter GDP estimates. But these will be cautious estimates as recent market turbulence pushes back conclusions and will make August’s trade data especially revealing.

Lower but still indicating ok expansion:
er-9-4-1

Saudi price setting adjustment:

Aramco Cuts All October Crude Pricing to U.S., Northwest Europe

By Anthony DiPaola

Sept 3 (Bloomberg) — Saudi Arabia, the world’s largest crude exporter, cut pricing for all October oil sales to the U.S. and Northwest Europe and reduced the premium on its main Light grade to Asia by 30 cents a barrel.

State-owned Saudi Arabian Oil Co. cut its official selling price for October sales to Asia of Arab Light crude to 10 cents a barrel more than the regional benchmark, the company said in an e-mailed statement. The discount for Medium grade crude for buyers in Asia widened 50 cents to $1.30 a barrel less than the benchmark.

Brent, a global oil benchmark, fell almost 50 percent last year as Saudi Arabia and other OPEC members chose to protect market share over cutting output to boost prices. Brent fell from over $100 a barrel in July 2014 to less than half that six months later. It traded at about $50 on Thursday.

The Organization of Petroleum Exporting Countries led by Saudi Arabia decided on June 5 to keep its production target unchanged to force higher-cost producers such as U.S. shale companies to cut back. The producer group has exceeded its target of 30 million barrels a day since May 2014.

Saudi Arabia reduced production in August to 10.5 million barrels a day, the first decline this year, according to data compiled by Bloomberg.

Dallas Fed, Chicago PMI, Japan Industrial Production, Italy Retail Sales, Comments on GDI and GDP

Shockingly negative:

Dallas Fed Mfg Survey
er-9-31-1
er-9-31-2

Not so good:

Chicago PMI
er-9-31-3
Highlights
The headline for August looks solid, at 54.4 for the Chicago PMI, but the details look weak. New orders and production both slowed and order backlogs fell into deeper contraction. Employment contracted for a fourth straight month while prices paid fell back into contraction. Lifting the composite index are delays in shipments which point to tight conditions in the supply chain. Inventories rose sharply in the month and the report hints that the build, despite the weakness in orders, was likely intentional. But strength is less than convincing and this report suggests that activity for the Chicago-area economy may be flat going into year end.
er-9-31-4

Japan : Industrial Production
er-9-31-5
Italy : Retail Sales
er-9-31-6

Highlights
Retailers had another poor month in June as nominal sales fell 0.3 percent versus May when they declined a slightly steeper revised 0.2 percent. Unadjusted annual growth actually accelerated from 0.1 percent to 1.7 percent but this was due to extra shopping days in this year’s report. Volume purchases were also 0.3 percent lower on the month.

Real gross domestic income (GDI) was up at only a .6% annual rate, only a bit higher than Q1, and in contrast to GDP being up 3.7% for the same quarter. This time looks to me like it’s GDP that’s out of line, as per my narrative where I don’t see any signs of any other sector stepping up and replacing the GDP supported by the now lost oil capital expenditures:
er-8-31-7

er-8-31-8
er-8-31-9
The capital goods sector remains in retreat:
er-8-31-10
Lots of anecdotals don’t jibe with 3.7% growth:

21 August 2015: ECRI’s WLI Growth Index Sinks Slightly More Into Contraction

(Econintersect) — ECRI’s WLI Growth Index which forecasts economic growth six months forward – remains in negative territory. This index had spent 28 weeks in negative territory then 15 weeks in positive territory – and now is in its second week in negative territory.

Rail Week Ending 22 August 2015: Some Improvement But Continued Deterioration Of Year-over-Year Rolling Averages

(Econintersect) — Week 33 of 2015 shows same week total rail traffic (from same week one year ago) marginally expanded according to the Association of American Railroads (AAR) traffic data. Intermodal traffic expanded year-over-year, which accounts for approximately half of movements. but weekly railcar counts continued in contraction.

Lots of reasons to suspect net exports will revert in Q3, or be revised down for Q2 as blips up like this latest one tend to quickly reverse, especially with all the surveys showing exports in retreat:
er-8-31-11
The goods component is looking in full retreat:
er-8-31-12
And the service component of exports isn’t offering any material support either:
er-8-31-13
And the Atlanta Fed’s Q3 GDP forecast of only 1.2% remains well below mainstream forecasts:
er-8-31-14

Atlanta Fed, 2004 vs 2015 US data, EU trade

The Atlanta Fed forecast as of July 14 is was +2.3% annualized for Q2, which is far below initial estimates of most professional forecasters, and below their current forecasts as well, and likely to be lowered further due to recent data.

The first government estimate for Q2 GDP will be released on July 30th. June trade numbers will not be released until August, and it looks to me like May was a zig that could zag in June and could cause a downward revision to Q2 GDP.

Inventories also look high to me which means a correction would further reduce Q2 GDP, and the low productivity numbers and decelerating employment reports tell me business is overstaffed for the current pace of sales and likely to adjust accordingly as well.


er 7-16-7

The economy before the 2004 rate hikes vs now:


er 7-16-8

Another strong surplus:


er 7-16-9

Highlights

The seasonally adjusted trade balance returned another healthy surplus in May. At E21.2 billion the black ink was short of April’s slightly downwardly revised E23.9 billion but still above the E20 billion mark for the fourth time so far this year.

The deterioration in the headline reflected a 1.5 percent monthly fall in exports, their first drop since January. Imports were flat. Annual growth of the former was 3.0 percent and of the latter 0.0 percent.

At E2.6 billion the average surplus in April/May was 6.4 percent above its first quarter mean which points to a probable small positive contribution from total net exports to second quarter real GDP growth. Quite apart from the weakness of the oil market, the current soft level of the euro should help to ensure continued strong trade data over the rest of 2015.

er 7-16-10

This is just the euro area, also in surplus:


er 7-16-11

Italy in surplus as well:


er 7-16-12

Highlights

The seasonally adjusted trade balance was in a E4.3 billion surplus in May following a marginally larger revised E3.6 billion excess in April.

The headline gain was mainly attributable to stronger exports which rose 1.5 percent from April, their third increase in the last four months. Much of this came courtesy of a 28.4 percent jump in the energy sector excluding which exports were up only 0.6 percent. Consumer goods (2.2 percent) had a good period but intermediates were only flat and capital goods were weak (minus 0.3 percent). Compared with May 2015 exports were 2.0 percent stronger.

Imports fell a monthly 0.3 percent, largely due to a 5.3 percent slump in energy although capital goods also struggled (minus 0.9 percent). Annual import growth was 0.5 percent.

Atlanta Fed, Italy trade, mtg purchase apps, oil prices

Up some then back down some, still at a very low rate off of a negative Q1:
er-6-17-1
Down a bit but still positive, as is most all of the euro zone now with the euro at current levels:

Italy : Merchandise Trade

er-6-17-2
Highlights
The seasonally adjusted trade balance was in a E3.5 billion surplus in April, short of a marginally downwardly revised E3.8 billion in March and the smallest excess since September 2014.

The modest deterioration reflected a 0.8 percent monthly fall in exports, their first decline since December, as imports were flat after three successive months of growth. Compared with April 2014 exports rose 9.0 percent, little different from their end of quarter rate (9.1 percent) while imports increased 9.3 percent, also much in line with the previous month’s rate (9.7 percent).

The monthly change in exports was hit by falls in capital goods (3.9 percent) and intermediates (0.4 percent) but boosted by consumer goods (1.3 percent) and, in particular, energy (9.9 percent). Excluding energy exports fell a sharper 1.1 percent. Imports saw broad-based declines amongst the major categories and would have dropped versus March but for an 8.8 percent bounce in energy.

The latest data leave the trade gap at the start of the second quarter some 13.1 percent below its average in the first quarter. In part this will reflect higher oil costs but it also increases the risk of another negative contribution from net exports to real GDP growth.

Back down, not good, but now looking like it was a modest blip up in front of a feared increase in mtg rates that accelerated a few purchases. Still about 15% over last year which just about makes up for the loss of all cash purchases, indicating similar sales but with a shift towards more financing:

United States : MBA Mortgage Applications

er-6-17-3
Highlights
Volatility in interest rates is making for volatility in mortgage applications which fell sharply in the June 12 week, down 4.0 percent for the purchase index and down 7.0 percent for the refinancing index. Mortgage rates moved sharply higher in the week, up 5 basis points for the average 30-year conforming loan ($417,000 or less) to 4.22 percent. But rates have since been coming down this week, following the 10-year Treasury note which, after spiking near 2.50 percent last week, is back near 2.30 percent.

From the MBA:Mortgage Applications Decrease in Latest MBA Weekly Survey

Mortgage applications decreased 5.5 percent from one week earlier, according to data from the Mortgage Bankers Association’s (MBA) Weekly Mortgage Applications Survey for the week ending June 12, 2015. …

The Refinance Index decreased 7 percent from the previous week. The seasonally adjusted Purchase Index decreased 4 percent from one week earlier. The unadjusted Purchase Index decreased 6 percent compared with the previous week and was 15 percent higher than the same week one year ago.

And here’s a chart of housing starts on a per capita basis. It’s not yet up to prior recession lows:

er-6-17-4
The Saudis continue to hold the price in $ constant, however the spread between West Texas and Brent has narrowed, indicating US production may have peaked and be in at least relative decline. This follows the narrative that the collapse in operating drilling rigs leads to production declines as existing wells see their output decline over time.

er-6-17-5

EU Industrial Production, Credit Check, Atlanta Fed

Even with increasing net exports, over all GDP isn’t benefiting all that much, as fiscal policy and structural reforms that assist exports do so by restricting incomes and domestic demand to achieve ‘competitiveness’. Additionally, negative rates and QE remove some interest income from the economy, which also restricts domestic demand to some degree. And, ironically, the subsequent current account surplus puts upward pressure on the euro until there are no net exports, obviating the efforts and sacrifices that went into achieving the competitiveness. Further note that a Greek default, for example, fundamentally removes net euro financial assets from the economy, further tightening the euro, as Greek debt is nothing more than bank deposits in the ECB system:

European Union : Industrial Production
er-6-12-6
Highlights
The goods producing sector began the second quarter on a surprisingly soft note. A 0.1 percent monthly rise in production (ex-construction) was comfortably short of expectations and followed a steeper revised 0.4 percent decline in March. As a result, annual workday adjusted output growth dropped from 2.1 percent to 0.8 percent, its slowest pace since January.

However, April’s minimal monthly rebound would have been rather more impressive but for a 1.6 percent slide in energy. Elsewhere there were gains in intermediates (0.3 percent), capital goods (0.7 percent) and consumer durables (1.0 percent). Non-durable consumer goods were down 0.8 percent but, apart from this category, all sectors reported increases versus a year ago.

Amongst the larger member states output rose a solid 0.8 percent on the month in Germany but there were falls in France (1.0 percent), Italy (0.3 percent) and Spain (0.1 percent). Elsewhere Finland, already technically in recession, only saw output stagnate following a cumulative 2.4 percent loss since the end of last year while Greece (also back in recession) posted a hefty 2.3 percent reversal.

April’s advance leaves Eurozone industrial production just 0.1 percent above its average level in the first quarter when it increased fully 0.9 percent versus October-December. This provides early warning of a probable smaller contribution from the sector to real GDP this quarter and so underscores the need for the ECB to see out its QE programme in full.
er-6-12-7

Portfolio selling from blind fear of QE and negative rates and Greece, etc. drove down the euro, but fundamentally inflation was falling and ‘competitiveness’ increasing so the trade surplus was pushed higher by the lower levels of the currency. Now it looks like the increasing trade flows are ‘winning’ and beginning drive the euro higher, with portfolios ‘sold out’ of euro, all of which should continue until the trade flows subside:
er-6-12-8
Back to the US:

I see no sign of whatsoever of accelerating credit growth:
er-6-12-9
This got some attention when the growth rate was increasing, but not anymore since it rolled over and remains well below prior cycles:
er-6-12-10
They make point of potential growth every time one of the little wiggles bends up, but just look at how low the growth rate actually is, especially compared to prior cycles:
er-6-12-11
er-6-12-12
Nothing happening with consumer lending:
er-6-12-13
This shows how competitive banking is as banks compete by narrowing their spreads over their cost of funds:
er-6-12-14
er-6-12-15
er-6-12-16
The Atlanta Fed forecast ticked up with the latest retail releases, but still remains well below mainstream forecasts and is also indicating what would be a very weak ‘bounce’ from the negative Q1 print, as the implied first half GDP growth rate would only be around .6%- very close to an ‘official’ recession. And as you’ve seen from the charts, those same releases indicated continued year over year deceleration of growth (including autos and retail sales) as well as elevated inventories, which doesn’t bode well for Q3 and Q4:
er-6-12-17

Stephanie Kelton, Rail cars, Econintersect forecast, Italy comment, corp profits

Professor Kelton hit the ground running in January and has been making serious inroads!

This article has the usual misrepresentations, of course, but now Stephanie’s position gives her the opportunity to respond publicly and decisively.

U.S. Senate economist explains why deficits aren’t always evil: Walkom

By Thomas Walkom

Stephanie Kelton is part of a new generation of economists trying to figure out how things work in our grim, new world.

Rail Week Ending 23 May 2015: Contraction Worsens On Rolling Averages

(Econintersect) — Week 20 of 2015 shows same week total rail traffic (from same week one year ago) declined according to the Association of American Railroads (AAR) traffic data. Intermodal traffic improved year-over-year, which accounts for half of movements – but weekly railcar counts continues deep into contraction.


June 2015 Economic Forecast: Significant Decline In Our Economic Index

By Steven Hansen

(Econintersect) — Econintersect’s Economic Index continues to weaken. Most tracked sectors of the economy are relatively soft with most expanding well below rates seen since the end of the Great Recession. When data is this weak, it is not inconceivable that a different methodology could say the data is recessionary. The significant softening of our forecast this month was triggered by marginal declines in many data sets which are dancing closer and closer to zero growth.

The currency depreciation a while back took away real spending power as did the tax increase, shifting income from people to businesses, and helping exports as well:

Japan : Household Spending
er-5-28-1
Highlights
April household spending was down 1.3 percent from a year ago. This was the thirteenth consecutive month of decline. The retreat in spending began when the sales tax was increased from 5 percent to 8 percent in April 2014. Consumers went on a spending frenzy prior to the enactment of the increase and shut off the spending spigot when it was introduced. The weak consumption figures could threaten to keep inflation subdued in the months ahead, though recent commentary from the BoJ suggests the bank is optimistic about the economy’s resilience.

First they credit reforms and THEN oil and the euro:

Italy:

Early efforts with labor and bank reform show progress and Italy’s economy is showing signs of life, expanding 0.3 percent in the first quar ter – the first uptick since the third quarter of 2013 — as a weaker euro and lower oil prices help push the country out of its longest recession on record.

The economic figures tie with recent business confidence data and yet unemployment is still ticking higher – hitting 13 percent in March. As one Italian worker told me in Milan: “If recovery is happening, it isn’t happening fast enough.”
er-5-28-2

Revised lower as expected. The question is q2 which so far isn’t looking so good.

GDP
er-5-28-3

er-5-28-4

EU GDP, Mtg apps, retail sales

European Union : GDP Flash

er-5-13-8

Highlights
Eurozone economic activity extended its recovery into last quarter with a provisional and slightly smaller than expected 0.4 percent increase in real GDP versus the previous period. The fourth quarter rise was unrevised at 0.3 percent and annual growth edged a tick firmer to 1.0 percent. In line with normal procedure, Eurostat provided no details of the latest GDP expenditure components.

Growth was hindered by a sharp slowdown in Germany where total output expanded a quarterly 0.3 percent following a 0.7 percent rise at the end of last year. However, France (0.6 percent after 0.0 percent) was surprisingly robust and Spain (0.9 percent after 0.7 percent) posted its strongest performance in more than seven years. Italy (0.3 percent after 0.0 percent) saw its first positive print since the third quarter of 2013. Amongst the smaller countries Cyprus (1.6 percent after minus 0.4 percent) finally pulled out of recession but Finland (minus 0.1 percent after minus 0.2 percent) saw a second successive quarter of falling output.

Early signals on the current quarter have pointed to little change in Eurozone economic momentum which will probably be seen as disappointing by policymakers and investors alike. Still, the ECB’s QE programme was only launched in March so much of its potential benefit has yet to be realised. That said, with the region’s inflation currently running at just a provisional 0.0 percent annual rate, Eurozone governments and the ECB will be hoping for a significantly stronger growth profile over the second half of the year.

Q2 not getting any help here…

United States : MBA Mortgage Applications
er-5-13-9

Still not spending that gas savings…
Q2 still not showing signs of life

Retail Sales
er-5-13-10

GDP detail, EU unemployment, personal income, ECI, Jobless Claims, chicago pmi, Bloomberg consumer comfort

Note the inventory build:
er-4-30-1
er-4-30-2
Note the ‘bending of the curve’ for nominal spending that almost never happens:
er-4-30-3
A bit of a disconnect between headline car sales and car sales’ contribution to GDP?
er-4-30-4
Disposable income has ratched down twice recently- once from the recession and jump in unemployment, and again with the tax hikes:
er-4-30-5

European Union : Unemployment Rate
er-4-30-6
Highlights
The Eurozone labour market made limited progress in March. Joblessness fell a further 36,000 to 18.105 million but the unemployment rate held steady at 11.3 percent, a tick above market expectations.

Amongst the larger member states the national jobless rate was unchanged in France (10.6 percent) and Germany (4.7 percent) and declined another tick to 23.0 percent in Spain. However, Italy saw its rate jump 0.3 percentage points to 13.0 percent, just a couple of ticks short of last November’s record high. Top of the pile was again Greece (25.7 percent in January) while Germany remained at the bottom.

Youth unemployment was also unchanged at 22.7 percent following a downward revision to the February rate.

The income lost due to falling oil revenues might be starting to show and the growth rate remains near stall speed:

Personal Income and Outlays
er-4-30-7
Highlights
March consumer spending rebounded 0.4 percent (and was up 3.0 percent from a year ago) from a revised increase of 0.2 percent in February. But the data suggest that people remain somewhat cautious in their spending despite months of cheaper gasoline and rising confidence. Consumer spending generates more than two thirds of GDP and is a key driver of growth. Spending on services increased 0.2 percent from the prior month. Spending on goods added 1.0 percent after three consecutive monthly declines, including a 1.8 percent increase in purchases of durable goods like trucks and washing machines that are designed to last at least three years.

Personal income was flat on the month the weakest reading since December 2013. On the year, income was up 3.8 percent.

The Federal Reserve acknowledged that the economy slowed during the winter months, but they blamed the weakness on “transitory factors.” Officials said in a statement they “continue to expect that, with appropriate policy accommodation, economic activity will expand at a moderate pace.”

Personal consumption expenditures price index undershot the Fed’s 2 percent target increasing 0.3 percent in March from a year earlier, the same increase as the previous month. Excluding the volatile food and energy categories, prices climbed 1.3 percent in March from a year earlier for the fourth consecutive month.
er-4-30-8
er-4-30-9

A bit higher than expected but I attribute this to hiring getting ahead of itself as reported employment gains have been outrunning growth of output:

Employment Cost Index
er-4-30-10
er-4-30-11
In the 12 months through March, labor costs jumped 2.6 percent, the largest rise since the fourth quarter of 2008. That is still below the 3 percent threshold that economists say is needed to bring inflation closer to the Fed’s 2 percent target.

Lower than expected and the Fed knows it shows separations and not new hires, though it has correlated to hiring historically:

Jobless Claims
er-4-30-12
Highlights
The Fed is ready now to pull the trigger at anytime and today’s jobless claims data may have their finger a little itchy. Initial claims, not skewed by special factors, plunged 34,000 in the April 25 week to 262,000 which is the lowest level since all the way back to April 2000. The 4-week average is down 1,250 to a 283,750 level which is just below a month-ago and is also a 15-year low.
er-4-30-13
Bloomberg Consumer Comfort Index
er-4-30-14
Highlights
Bloomberg’s consumer confidence index declined for a third consecutive week to a six-week low of 44.7 as Americans took a less favorable view of their finances and the slowdowns at factories and oilfields soured attitudes among men. Sentiment among men showed one of the biggest decreases in the past four years, while confidence in the Midwest slumped by the most in more than a decade. While the Bloomberg comfort gauge cooled from an almost eight-year high reached earlier this month, it remains well above last year’s average of 36.7, which was the best since 2007.

Housing starts, Italy Merchandise Trade, UK opinion chart, ECB euro policy musings

Moving up some but still relatively low, but as previously discussed,
this is about people losing jobs, not new hires:

Jobless Claims
er-4-16-1
er-4-16-2

And yet another lower than expected release:

Housing Starts
er-4-16-3
er-4-16-4
sg2015041635556

Just anecdotal evidence of what happens as the euro is pushed down by CB portfolio selling to ‘equate supply and demand’ etc.

Italy : Merchandise Trade
er-4-16-5
Highlights
The seasonally adjusted merchandise trade balance was in a sizeable E4.6 billion surplus in February, up from an unrevised E3.9 billion excess in January.

The headline gain was attributable to a tidy bounce in exports which, up 2.5 percent on the month, essentially reversed their January decline. Capital goods saw a 7.6 percent rise while consumer goods were up 0.2 percent and energy 2.7 percent. Intermediates fell 0.5 percent. Overall exports were 3.7 percent higher than in February 2014, a marked acceleration versus their minus 4.2 percent January rate.

Low odds of the UK going for fiscal expansion:
er-4-16-6
Not to forget every Fed member recognizes their role in ‘managing expectations’ as they all believe that the economic performance has a large psychological component. That is, if people were led to believe things were getting worse that would cause a downturn.

Beige Book: U.S. Economy Powers Through Headwinds

By Jefferey Sparshott

April 15 (WSJ) — The U.S. economy continued to expand across most of the country in February and March, though a strong dollar, falling oil prices and harsh winter weather slowed activity in some sectors, according to the Federal Reserve’s latest survey of regional economic conditions. The Fed found modest or moderate growth in eight of its 12 districts. Elsewhere, the pace of economic activity was described as steady, slight or continuing to expand. Minutes of the March meeting showed “several” officials thought June would be the right time, though others said it would be better to wait.

Possible narrative?:
China told Draghi that if the ECB not to go to negative rates and QE or they would retaliate by selling their euro reserves. So Draghi did exactly that to induce a ‘devaluation’ to support EU net exports. The ploy worked, for as long as it lasts. When the CB reserve liquidation fades, the euro will appreciate until the current account surplus turns to a deficit, reversing prior gains in output and employment, and dashing any hoped of growth and employment:

ECB’s Mario Draghi Says Stimulus Is Working

By Brian Blackstone and Todd Buell

April 15 (WSJ) — ECB President Mario Draghi said there is “clear evidence the monetary policy measures we put in place have been effective.” Mr. Draghi said, “The euro area economy has gained further momentum since the end of 2014. We expect the economic recovery to broaden and strengthen substantially.”

German GDP forecasts hiked on weak euro