Comments on Greece

So the euro is down a % or 2 because of the Greek debt drama. Generally currencies go down on debt drama when the debt is in a foreign currency and it’s feared the govt will have to sell local currency to get the fx to make the payments. For example, the peso might go down should there be concern over Mexico paying the IMF in dollars. But with Greece this isn’t the case, as there’s no fear they will sell euro to get euro to make payments. But the players sell euro anyway, because that’s what you do when there is a debt crisis. Then they have to buy them back, with no state selling to help them cover.

What’s been exposed yet again is a world that doesn’t understand its monetary systems, including central bankers who don’t understand banking, as well as the mainstream media and all of the politicians and their finance ministers talking and doing the big stupid at the expense of their electorate, which also doesn’t understand it enough to have any awareness whatsoever of the total lack of expertise at the highest levels.

Meanwhile, at the macro level, deflationary policy continues including negative rates, QE, tight fiscal, structural reforms, and all that goes with it. And debt defaults, should they happen are also deflationary. And all of this deflationary bias is also evidenced by most all market prices.

Greece at the cross roads

On Fri, Jun 19, 2015 at 6:47 AM, wrote:
Hi Warren!

Do you know this proposal by Rob Parentau and Trod Andresen of introducing a parallel currency in the form of Tax Anticipation Notes?

A program proposal for creating a complementary currency in Greece

From rumours seem it could be introduced in Greece.

What do you think?

Yes, it’s been around for a while- a take off on Mosler bonds and my California proposal years ago when they had problems.

The Greeks have known about these things all along but didn’t want to go in that direction. If they come to any kind of agreement, they get full conventional funding. If they don’t, they are afraid of what might happen to the banking system and the economy if the EU retaliates, whether or not they get alternative funding. And that could mean political turnover and the rise of Golden Dawn, etc.

So it hasn’t been about funding- it’s been about coming to terms that allow Greece to stay in the EU. As we discussed, leaving is looked at as a move to the right, and a victory for the right and nationalism.

It’s the right that has said the the EU was a mistake from the beginning for reasons of governance more than economics. The current Greek leftist government considers themselves as ‘progressive Europeans’ who look to the European Union and the common currency as the progressive future, moving away from the nationalism that caused the previous centuries of warfare, etc. So their first choice is to remain Europeans and work within the EU for a progressive economic agenda.

If they do break from the EU and move towards alternative finance to support their progressive economic agenda, which could very well happen, they will see it as a catastrophic failure of their diplomatic efforts to achieve their personal ideals.

Greek bank liquidity, credit check

So people transferred their deposits to other banks, and those other banks wouldn’t redeposit/lend those euro back to the Greek banks via the interbank market, at any rate of interest.

So instead the lost deposits were replaced by what functionally are deposits from the ECB via what’s called the ELA. What’s wrong with that? Why have an interbank market at all? Why not simply let banks have debits/deposits from the ECB as needed as long as they are deemed adequately capitalized and in good standing by that same ECB? And no other entity has the access and authority to fully regulate and supervise, qualifying it regarding the decision of providing ‘liquidity’.

The way I say it is ‘the liability side of banking is not the place for market discipline.” Hopefully they know this and don’t decide to punish privately owned ECB member banks for sins of their govt.

On Monday, ECB President Mario Draghi told European lawmakers that, so far, the bank had helped out Greek lenders to the tune of 118 billion euros ($133 billion) – about 66 percent of Greece’s overall economy. At the end of 2014, that sum was only half the current level.

Still no bounce:
cc-21-1
cc-21-2
cc-21-3
cc-21-4
cc-21-5

EU Industrial Production, Credit Check, Atlanta Fed

Even with increasing net exports, over all GDP isn’t benefiting all that much, as fiscal policy and structural reforms that assist exports do so by restricting incomes and domestic demand to achieve ‘competitiveness’. Additionally, negative rates and QE remove some interest income from the economy, which also restricts domestic demand to some degree. And, ironically, the subsequent current account surplus puts upward pressure on the euro until there are no net exports, obviating the efforts and sacrifices that went into achieving the competitiveness. Further note that a Greek default, for example, fundamentally removes net euro financial assets from the economy, further tightening the euro, as Greek debt is nothing more than bank deposits in the ECB system:

European Union : Industrial Production
er-6-12-6
Highlights
The goods producing sector began the second quarter on a surprisingly soft note. A 0.1 percent monthly rise in production (ex-construction) was comfortably short of expectations and followed a steeper revised 0.4 percent decline in March. As a result, annual workday adjusted output growth dropped from 2.1 percent to 0.8 percent, its slowest pace since January.

However, April’s minimal monthly rebound would have been rather more impressive but for a 1.6 percent slide in energy. Elsewhere there were gains in intermediates (0.3 percent), capital goods (0.7 percent) and consumer durables (1.0 percent). Non-durable consumer goods were down 0.8 percent but, apart from this category, all sectors reported increases versus a year ago.

Amongst the larger member states output rose a solid 0.8 percent on the month in Germany but there were falls in France (1.0 percent), Italy (0.3 percent) and Spain (0.1 percent). Elsewhere Finland, already technically in recession, only saw output stagnate following a cumulative 2.4 percent loss since the end of last year while Greece (also back in recession) posted a hefty 2.3 percent reversal.

April’s advance leaves Eurozone industrial production just 0.1 percent above its average level in the first quarter when it increased fully 0.9 percent versus October-December. This provides early warning of a probable smaller contribution from the sector to real GDP this quarter and so underscores the need for the ECB to see out its QE programme in full.
er-6-12-7

Portfolio selling from blind fear of QE and negative rates and Greece, etc. drove down the euro, but fundamentally inflation was falling and ‘competitiveness’ increasing so the trade surplus was pushed higher by the lower levels of the currency. Now it looks like the increasing trade flows are ‘winning’ and beginning drive the euro higher, with portfolios ‘sold out’ of euro, all of which should continue until the trade flows subside:
er-6-12-8
Back to the US:

I see no sign of whatsoever of accelerating credit growth:
er-6-12-9
This got some attention when the growth rate was increasing, but not anymore since it rolled over and remains well below prior cycles:
er-6-12-10
They make point of potential growth every time one of the little wiggles bends up, but just look at how low the growth rate actually is, especially compared to prior cycles:
er-6-12-11
er-6-12-12
Nothing happening with consumer lending:
er-6-12-13
This shows how competitive banking is as banks compete by narrowing their spreads over their cost of funds:
er-6-12-14
er-6-12-15
er-6-12-16
The Atlanta Fed forecast ticked up with the latest retail releases, but still remains well below mainstream forecasts and is also indicating what would be a very weak ‘bounce’ from the negative Q1 print, as the implied first half GDP growth rate would only be around .6%- very close to an ‘official’ recession. And as you’ve seen from the charts, those same releases indicated continued year over year deceleration of growth (including autos and retail sales) as well as elevated inventories, which doesn’t bode well for Q3 and Q4:
er-6-12-17

Comments on transport weakness, Draghi comments, Japan exports to US, new home sales,PMI and Fed indexes chart, Dallas Fed, Richmond Fed, Consumer confidence

Transport Is Saying Consumer Spending Should Slow Further

By Steven Hansen

When one analyzes the economy, there are always some sections which do better than others. When the economic growth is weak (like currently), several segments can be in contraction while others are expanding.

Everything but the needed fiscal relaxation:

ECB’s Draghi urges euro zone to unite for economic reform

May 23 (Reuters) — “The current situation in the euro area demonstrates that this delay could be dangerous,” ECB President Mario Draghi said while acknowledging progress had been made, for example with banking union. But private risks need to be shared within the euro zone, with financial integration improving access to credit for companies and leading to a complete capital markets union, Draghi said. Countries should observe common standards when implementing structural reforms but also take a country-specific approach, as part of a process of “convergence in the capacity of our economies to resist shocks and grow together”.

Looks like our trade deficit is still on the rise:

“Exports to the United States rose 21.4 percent in the year to April, keeping the pace of gains in the previous month with brisk shipments of cars and vehicle engines.”

Chart not looking so good:

United States : Durable Goods Orders
er-5-26-1
er-5-26-2

Up a bit after a dip in March but not much different from the Q1 average so hard to say Q2 is doing better than Q1 from this report:

United States : New Home Sales
er-5-26-3
Highlights
New home sales bounced back solidly in April, up 6.8 percent to a 517,000 annual rate that is on the high side of Econoday expectations. Strength is centered in the South which is the largest and important housing region and where sales rose 5.8 percent, this however fails to reverse the region’s 11.8 percent drop in the prior month.

Supply rose slightly in the month, to 205,000 new homes on the market, but supply relative to sales fell to 4.8 months from 5.1 month. Low supply should encourage builders to bring more homes on the market but at the same time low supply hurts current sales. Price readings are mostly favorable led by a 4.1 percent rise in the median price to $297,300 for a strong 8.3 percent year-on-year gain.

Readings in this report are always volatile month-to-month but the gains for April underscore the recent surge in housing starts & permits and help offset last week’s disappointing weakness in existing home sales. The housing sector is still trying to get off the ground but indications, taken together, are improving.
er-5-26-4
er-5-26-5

Again, doesn’t look like Q2 is doing any better than Q1 here either:

er-5-26-6

This is notable as my narrative is about the end of the energy capex that was chasing $100 oil that had been keeping total US GDP positive in 2014. This key indicator of that energy investment is showing the deep cuts have not stabilized but are continuing to take their toll, and the drop in total spending and income necessarily ripples out to the rest of the US and global economies. And note the continuing reports of weakness in exports, as the foreign sector drop in oil capex reduces their ability to import:

United States : Dallas Fed Mfg Survey
er-5-26-7

Highlights
Contraction in the energy sector continues to pull the Dallas Fed report into deeply negative ground, to a headline minus 20.8 vs minus 16.0 and minus 17.4 in the prior two months. Production shows a turn for the worse, at minus 13.5 vs April’s minus 4.7, as does employment, at minus 8.2 vs plus 1.8. New orders remain deeply negative, at minus 14.1 vs minus 14.0. Prices paid also fell further though the decline is easing, to minus 1.7 from minus 11.2.

The regional Fed reports all point to another slow month for the manufacturing sector which is struggling with energy contraction, especially evident in this report, as well as weakness in exports.

Dallas Fed: Texas Manufacturing Activity Contracts Further

Texas factory activity declined again in May, according to business executives responding to the Texas Manufacturing Outlook Survey. … The general business activity index fell to -20.8 in May, its lowest reading since June 2009.

Labor market indicators reflected employment declines and shorter workweeks. The May employment index declined 10 points to -8.2, after rebounding slightly above zero last month. Twelve percent of firms reported net hiring, compared with 21 percent reporting net layoffs. The hours worked index fell from -5 to -11.6.

United States : Richmond Fed Manufacturing Index
er-5-26-8
Highlights
Regional Fed reports on the manufacturing sector continue to be soft with Richmond’s at only plus 1 for May following two prior months of declines. New orders, after three straight declines, did rise but only to plus 2. Backlog orders, however, remain deep in the negative column at minus 10.

Employment growth is down while shipments are in contraction for a 4th month. Price readings are flat except for wages which show a big 11-point gain to 20. Wage pressures are a trigger for an FOMC rate hike and this reading, though isolated, will get the attention of the hawks at the Fed.

First it was Empire State, then the Philly Fed, then Kansas City, all showing weakness this month and now including Richmond. Data from the Dallas Fed, also released this morning, is especially weak. The manufacturing sector is having a tough time gaining momentum, held down by weak exports and contraction in the energy sector.

This is one man one vote, not one dollar one vote, and is another indicator where Q2 isn’t doing as well as Q1:
er-5-26-9

wage growth and business investment

Interesting how these two reports relate to each other.

And the circled section is the last time the street was screaming about ‘wage inflation’ saying that every time in the past it went up as it had to that point it kept going up for the next 4 years. But it does track somewhat with investment, below:
ahe

Wage Growth Is Poised to Accelerate

By Gene Epstein

April 24 (Barrons) — Jason Benderly of Applied Global Macro Research has built an explanatory model that accounts for fluctuations in labor compensation with a far closer fit than a single-variable model that consists solely of the change in the unemployment rate. These four key variables (the change in the jobless rate, the jobless rate, the change in labor productivity, and after-tax profit margins), along with two other, minor ones relating to prices, explain real hourly compensation, which includes all benefits, going back to 1960. With no trouble explaining the recent period, the model predicts an acceleration in wage growth.

Weak U.S. business spending data hints at sluggish growth rebound

By Lucia Mutikani

April 24 (Reuters) — U.S. business investment spending plans fell for a seventh straight month in March. Non-defense capital goods orders excluding aircraft declined 0.5 percent last month after a revised 2.2 percent drop in February, which was the biggest decline since July 2013. In March, shipments of core capital goods fell 0.4 percent after a downwardly revised 0.1 percent gain in February.Shipments in February were previously reported to have risen 0.3 percent. That downward revision together with March’s weak reading could see economists trim their first-quarter GDP growth estimates.

Looks like this is coincident to recession, unless rescued by another fracking boom…
capex
Sure looks to me like there’s a high probability this cycle is over. And could have been over last year if not rescued by the fracking boom.

Fracksional reserve banking???
:( sorry!!!

Comments on DB research

I send my posts to both a mailing list and to my blog, www.moslereconomics.com, where they are posted for public viewing.

To get on the mailing list you must make a donation to the annual Pan Mass Challenge bicycle ride, which donates 100% of donations to Dana Farber in Boston, the world’s leading cancer research center. This year the donation is expected to exceed $45 million of 75% unrestricted funding critical to continue to developing the latest treatments and cures.

So let me again thank those who donated last year, and thanks in advance for donating again this year,
and I also welcome in advance all new donors who will be added to my mailing list!

Best to all!
Warren

Deutsche Bank – Fixed Income Research

Special Report – Euroglut here to stay: trillions of outflows to go
10 March 2015 (9 pages/ 370 kb)

Last year we introduced the Euroglut concept: the idea that the Euro-area’s huge current account surplus reflects a very large pool of excess savings that will have a major impact on global asset prices for the rest of this decade. Combined with ECB quantitative easing and negative rates we argued that this surplus of savings would lead to large-scale capital flight from Europe causing a collapse in the euro and exceptionally depressed global bond yields.

This is indeed strange- the notion that a current account surplus causes currency depreciation?

The current account surplus, in general, is evidence of restrictive fiscal policy that constrains domestic demand, including domestic demand for imports, along with depressing wages which adds to ‘competitiveness’ of EU exporters. Normally, however, this causes currency appreciation that works against increased net exports, unless the govt buys fx reserves. But this time it’s been different, as ECB policies and uncertainty surrounding Greece and related political events have managed to frighten global portfolio managers into doing the shifting out of euro financial assets in sufficient size to cause the euro to fall, particularly vs the $US, giving a further boost net EU exports.

With European portfolio outflows currently running at record highs, this piece now asks: Can outflows continue? How big will they be? The answer to this question is critical: the greater the European outflows, the more the euro can weaken and the lower global bond yields can stay.

Again, this is a very strange assertion, as exporters selling the dollars earned from their exports for euro needed to pay their domestic expenses in fact drain net euro financial assets from the global economy.

What can happen is that speculation and portfolio shifting can be associated with agents borrowing euro or depleting ‘savings’ which they sell for dollars, for example, to accomplish their desired currency weightings. And these new euro borrowings and savings reductions do indeed create new euro deposits for the purpose of selling them, which drives down the value of the euro as previously discussed. This leaves those selling euro for dollars either ‘short’ euro vs dollars, or underweight euro financial assets in their portfolios.

However, at some point the drop in the euro that makes EU real goods and services less expensive for Americans to import, and at the same time makes US goods and service more expensive for EU members, can cause EU net exports to increase. That is, Americans buy imports with their dollars, and the EU exporter then sells those dollars to get euro to pay their EU based production costs, and generally keep their net profits in euro as well. That is, EU exports to the US are facilitated by exporters selling dollars for euro, which is the opposite of what the speculators and portfolio managers are doing.

To review the process, speculators and portfolio managers sell euro for dollars driving the euro down to the point where the EU exporters are selling that many dollars for euro, all as the exchange rate continuously adjust as it expresses ‘indifference levels’.

And should the speculation and portfolio shifting drive the euro down far enough such that the net export activity is attempting to sell more dollars for euro than the speculators and portfolio managers desire, the evidence will be a reversal in the exchange rate as the dollar then falls vs the euro.

We answer the outflows question by modeling the Euro-area’s net international investment position (NIIP). We argue that Europeans now have to become net creditors to the rest of the world and that the NIIP needs to rise from -10% of GDP to at least 30%. We estimate that this adjustment requires net capital outflows of at least 4 trillion euros.

No ‘net capital inflow’ is needed for the EU to lend euro. As always, it’s a matter of ‘loans create deposits’. That is, the euro borrowings as I described create euro deposits as I described. The notion that borrowing comes from ‘available funds’ is entirely inapplicable with the floating exchange rate policies of the dollar and the euro.

This conclusion leads to three investment implications.

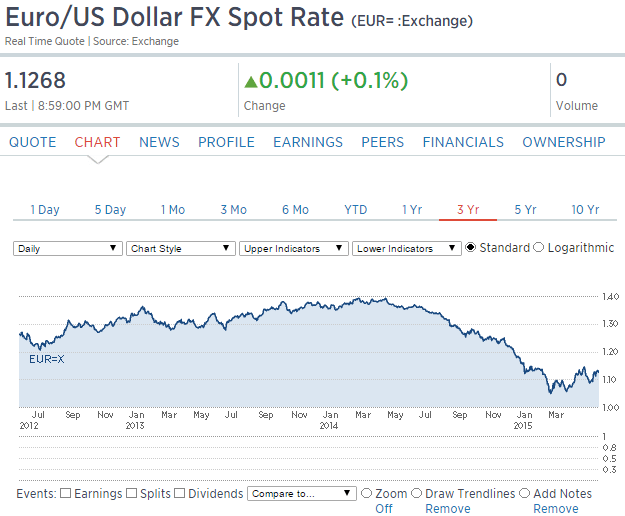
First, we continue to expect broad-based euro weakness.

They were right about that!

I say it’s from portfolio shifting and speculation desires exceeding the trade flows, even as restrictive fiscal policy and now currency depreciation from portfolio shifting and speculation has caused an acceleration of net exports.

They say it’s from a pool of ‘excess savings’.

European outflows have been even bigger than our initial (high) expectations, so we are revising our EUR/USD forecasts lower. We now foresee a move down to 1.00 by the end of the year, 90cents by 2016 and a new cycle low of 85cents by 2017.

It’s very possible, if the portfolio shifting and speculation continues to grow faster than the EU’s current account surplus grows. However, should the growing current account surplus ‘overtake’ the desired portfolio shifting and speculation, the euro will reverse and appreciate continuously until it gets high enough for the current account surplus to fall to desired portfolio and speculative fx weightings.

Second, we expect continued European inflows into foreign assets, particularly fixed income. Our earlier work demonstrated that the primary destination of European outflows will be core fixed income markets in the rest of the world, and evidence over the last few months supports these trends: most European outflows have gone to the US, UK and Canada. These flows should keep global yield curves low and flat.

Yes, to the extent that euro portfolios desire to shift to dollar financial assets due to the interest rate differential the shift can continue. However, history and theory tells us this is limited as the desire to take exchange rate risk is limited. Euro portfolios are most often matched with euro liabilities, and so shifting to dollar financial assets can result in substantial euro shortfalls should the exchange rate shift adversely. In fact, many portfolios, if not most, including the banking system, are in some way legally prohibited from exchange rate risk exposure.

Finally, we see Euroglut as continuing to constrain monetary policy across the European continent for the foreseeable future. Since our paper in September central banks in Switzerland, Norway, Sweden, Denmark, the Czech Republic and Poland have all eased.

Except this ‘easing’ is in the form of lower interest rates, which is effectively a fiscal tightening as govts pay less interest to the non govt sectors, which in fact works to make the euro stronger. Likewise, the deflationary forces unleashed by restrictive fiscal policy likewise imparts a strong euro bias.

These countries run large current account surpluses.

Yes, a force that generates currency appreciation as previously described.

This is why, once the shifting and speculation has run its course, I expect the euro to appreciate continuously until it gets high enough to again reverse the trade flows from surplus to deficit.

Feel free to distribute.

Through a unique mix of huge excess savings and structurally low yields, the entire European continent will continue to be a major source of global imbalances for the rest of this decade.

credit check

Commercial paper/shadow banking still down and nearly $100 billion off the recent highs:

cc-3-9-1

cc-3-9-2

Lets see if bank lending is picking up the slack:

C and I growth decelerating some and nothing special:
cc-3-9-3

Nice jump in real estate loans. Maybe some of the proceeds went to pay down commercial paper borrowings?
cc-3-9-4

Wells capping sub prime autos, bank margins and income, personal income and spending, ISM manufacturing, construction spending

Wells pulling back some on sub prime auto loans:

Wells Fargo Puts a Ceiling on Subprime Auto Loans

And banks in general fighting this:

net-income-margin-1

net-income-margin-2

A bit worse than expected. Fewer dollars spent, but more ‘real things’ purchased due to lower prices, but any calculation of a deflator with the large drop in oil prices is problematic:

Personal Income and Outlays
personal-income-table-jan
Highlights
In January, personal income was moderately healthy as was spending after price effects are discounted. Personal income posted a gain of 0.3 percent after growing 0.3 percent in December. January fell short of analysts’ forecast for a 0.4 percent boost. The wages & salaries component jumped 0.6 percent, following a rise of 0.1 percent the prior month.

Personal spending decreased 0.2 percent, following a decline of 0.3 percent in December. Durables slipped 0.1 percent, following a 1.4 percent drop in December-due to sluggish auto sales. Nondurables plunged 2.2 percent in January after decreasing 1.4 percent the month before—with lower gasoline prices pulling this component down. Services advanced 0.5 percent after a 0.2 percent gain in December.

But weakness in current dollar spending was price related as chain-weighted (price adjusted) personal spending came in at 0.3 percent, following a 0.1 percent dip in December. January actually is a good start for first quarter GDP in the PCE component.

Prices at the headline level fell again, down 0.5 percent in January after a 0.2 percent dip the month before. The core PCE price index firmed to up 0.1 percent from flat in December. On a year-ago basis, headline inflation eased to 0.2 percent from 0.8 percent in December. The year-ago core rate was steady at 1.3 percent.

Income growth was moderately healthy in January. The consumer sector has fuel for spending-especially in the important wages & salaries component. Inflation is low and well below the Fed’s target of 2 percent year-ago inflation, meaning the Fed likely will stick with no rate hike before June.

pce-jan

From the GDP report, through Q4:

rpce-jan
The monthly number shows January 2015 did better than January 2014 when the winter was particularly cold:
rpce-jan-2
ism-feb

Construction Spending
construction-spending-jan-table
construction-spending-jan

Greek bank liquidity, Fed minutes, Architecture Billings Index

As previously discussed, and relayed to the finance minister in Greece, there is no reason to assume the ECB will cut off liquidity to Greek banks.

First, those banks are private institutions, and regulated and supervised by the ECB, who has deemed them ‘solvent’ and ‘adequately capitalized’ and therefore eligible for liquidity support as members in good standing.

Think of it this way, if NY went rogue, would the Fed cut off Citibank?

ECB extends liquity for Greek banks: Report

Seems the last thing the Fed wants to do now is engineer higher mtg rates and set back the anemic housing markets.

Sort of like Bernanke did just before housing turned south and has yet to recover…

Federal Reserve minutes indicate no rush to raise interest rates

Below 50, not good:

abi-jan