QE, the dollar, and the euro, jobless claims, US trade deficit, Philadelphia Fed survey

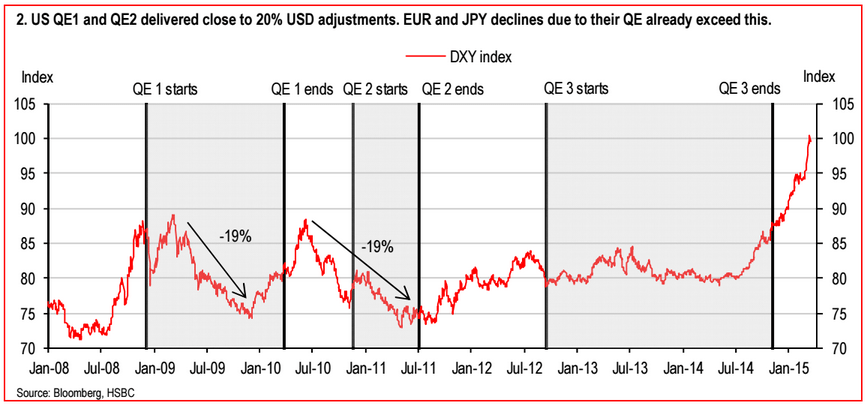
So my story is that traders and portfolio managers worried about inflation and currency depreciation from QE caused the depreciation during those periods, covering shorts and restoring dollar weightings after QE ended, returning the dollar to where it was. And now the latest spike is largely from the ECB’s QE announcement which caused strong desires to shift out of euro and into dollars. And this too should reverse at some point as, like everywhere else it’s been tried, QE will not reverse their deflationary forces or add to aggregate demand, and the euro shorts and underweight portfolios will be scrambling to get their euro back, while at the same time the current account surplus that resulted from the weak euro works to make those needed euro that much harder to get.
dxy
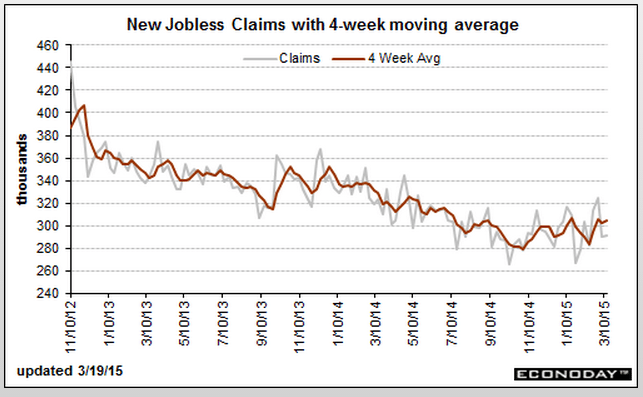
claims-3-12

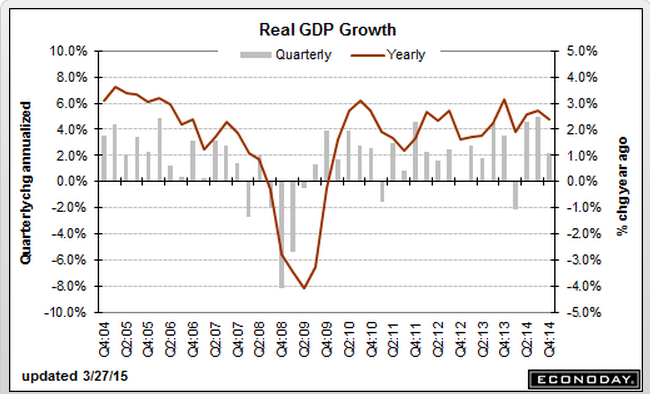
This should take q4 GDP down a bit more for the next published revision.
And it’s also consistent with my oil price narrative as well:

Current Account
ca-q4
Highlights
The nation’s current account gap widened sharply in the fourth quarter, to $113.5 billion vs a slightly revised $98.9 billion in the third quarter and driving the gap, relative to GDP, up 4 tenths to 2.6 percent. The gap on income is the main culprit, up $11.4 billion in the quarter and reflecting declining equity in foreign affiliates as well as transfers for fines and penalties. On trade, the goods gap rose $4.1 billion but was offset in part by a $1.0 billion increase in the services surplus.

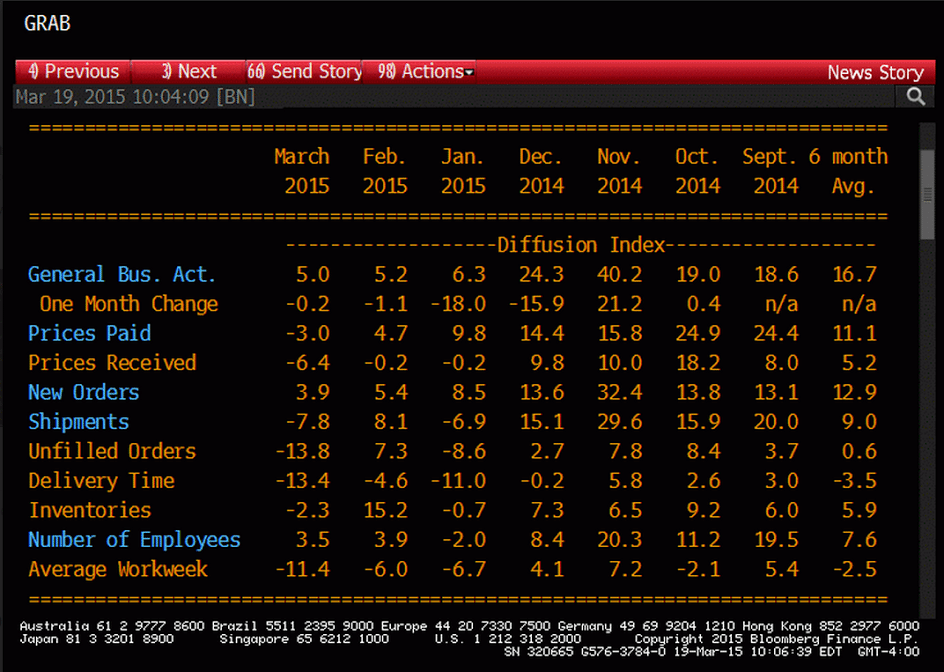
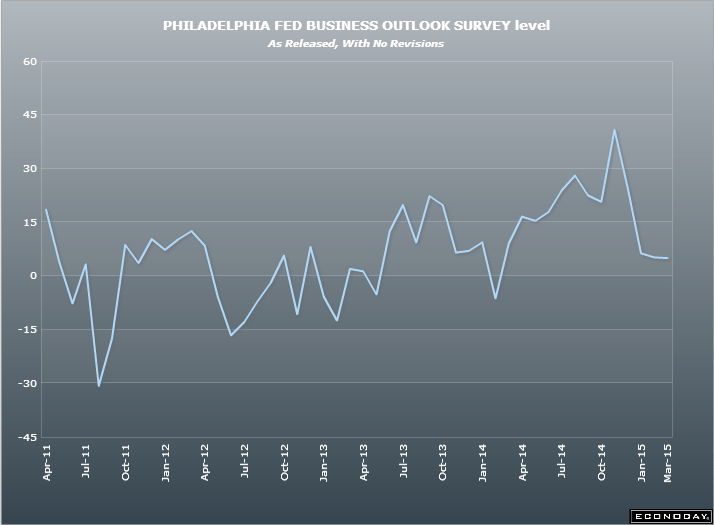
Down from last month and a bit worse than expected:

Philadelphia Fed Business Outlook Survey
philly-fed-mar-table
philly-fed-mar-detail
philly-fed-mar-graph

Comments on DB research

I send my posts to both a mailing list and to my blog, www.moslereconomics.com, where they are posted for public viewing.

To get on the mailing list you must make a donation to the annual Pan Mass Challenge bicycle ride, which donates 100% of donations to Dana Farber in Boston, the world’s leading cancer research center. This year the donation is expected to exceed $45 million of 75% unrestricted funding critical to continue to developing the latest treatments and cures.

So let me again thank those who donated last year, and thanks in advance for donating again this year,
and I also welcome in advance all new donors who will be added to my mailing list!

Best to all!
Warren

Deutsche Bank – Fixed Income Research

Special Report – Euroglut here to stay: trillions of outflows to go
10 March 2015 (9 pages/ 370 kb)

Last year we introduced the Euroglut concept: the idea that the Euro-area’s huge current account surplus reflects a very large pool of excess savings that will have a major impact on global asset prices for the rest of this decade. Combined with ECB quantitative easing and negative rates we argued that this surplus of savings would lead to large-scale capital flight from Europe causing a collapse in the euro and exceptionally depressed global bond yields.

This is indeed strange- the notion that a current account surplus causes currency depreciation?

The current account surplus, in general, is evidence of restrictive fiscal policy that constrains domestic demand, including domestic demand for imports, along with depressing wages which adds to ‘competitiveness’ of EU exporters. Normally, however, this causes currency appreciation that works against increased net exports, unless the govt buys fx reserves. But this time it’s been different, as ECB policies and uncertainty surrounding Greece and related political events have managed to frighten global portfolio managers into doing the shifting out of euro financial assets in sufficient size to cause the euro to fall, particularly vs the $US, giving a further boost net EU exports.

With European portfolio outflows currently running at record highs, this piece now asks: Can outflows continue? How big will they be? The answer to this question is critical: the greater the European outflows, the more the euro can weaken and the lower global bond yields can stay.

Again, this is a very strange assertion, as exporters selling the dollars earned from their exports for euro needed to pay their domestic expenses in fact drain net euro financial assets from the global economy.

What can happen is that speculation and portfolio shifting can be associated with agents borrowing euro or depleting ‘savings’ which they sell for dollars, for example, to accomplish their desired currency weightings. And these new euro borrowings and savings reductions do indeed create new euro deposits for the purpose of selling them, which drives down the value of the euro as previously discussed. This leaves those selling euro for dollars either ‘short’ euro vs dollars, or underweight euro financial assets in their portfolios.

However, at some point the drop in the euro that makes EU real goods and services less expensive for Americans to import, and at the same time makes US goods and service more expensive for EU members, can cause EU net exports to increase. That is, Americans buy imports with their dollars, and the EU exporter then sells those dollars to get euro to pay their EU based production costs, and generally keep their net profits in euro as well. That is, EU exports to the US are facilitated by exporters selling dollars for euro, which is the opposite of what the speculators and portfolio managers are doing.

To review the process, speculators and portfolio managers sell euro for dollars driving the euro down to the point where the EU exporters are selling that many dollars for euro, all as the exchange rate continuously adjust as it expresses ‘indifference levels’.

And should the speculation and portfolio shifting drive the euro down far enough such that the net export activity is attempting to sell more dollars for euro than the speculators and portfolio managers desire, the evidence will be a reversal in the exchange rate as the dollar then falls vs the euro.

We answer the outflows question by modeling the Euro-area’s net international investment position (NIIP). We argue that Europeans now have to become net creditors to the rest of the world and that the NIIP needs to rise from -10% of GDP to at least 30%. We estimate that this adjustment requires net capital outflows of at least 4 trillion euros.

No ‘net capital inflow’ is needed for the EU to lend euro. As always, it’s a matter of ‘loans create deposits’. That is, the euro borrowings as I described create euro deposits as I described. The notion that borrowing comes from ‘available funds’ is entirely inapplicable with the floating exchange rate policies of the dollar and the euro.

This conclusion leads to three investment implications.

First, we continue to expect broad-based euro weakness.

They were right about that!

I say it’s from portfolio shifting and speculation desires exceeding the trade flows, even as restrictive fiscal policy and now currency depreciation from portfolio shifting and speculation has caused an acceleration of net exports.

They say it’s from a pool of ‘excess savings’.

European outflows have been even bigger than our initial (high) expectations, so we are revising our EUR/USD forecasts lower. We now foresee a move down to 1.00 by the end of the year, 90cents by 2016 and a new cycle low of 85cents by 2017.

It’s very possible, if the portfolio shifting and speculation continues to grow faster than the EU’s current account surplus grows. However, should the growing current account surplus ‘overtake’ the desired portfolio shifting and speculation, the euro will reverse and appreciate continuously until it gets high enough for the current account surplus to fall to desired portfolio and speculative fx weightings.

Second, we expect continued European inflows into foreign assets, particularly fixed income. Our earlier work demonstrated that the primary destination of European outflows will be core fixed income markets in the rest of the world, and evidence over the last few months supports these trends: most European outflows have gone to the US, UK and Canada. These flows should keep global yield curves low and flat.

Yes, to the extent that euro portfolios desire to shift to dollar financial assets due to the interest rate differential the shift can continue. However, history and theory tells us this is limited as the desire to take exchange rate risk is limited. Euro portfolios are most often matched with euro liabilities, and so shifting to dollar financial assets can result in substantial euro shortfalls should the exchange rate shift adversely. In fact, many portfolios, if not most, including the banking system, are in some way legally prohibited from exchange rate risk exposure.

Finally, we see Euroglut as continuing to constrain monetary policy across the European continent for the foreseeable future. Since our paper in September central banks in Switzerland, Norway, Sweden, Denmark, the Czech Republic and Poland have all eased.

Except this ‘easing’ is in the form of lower interest rates, which is effectively a fiscal tightening as govts pay less interest to the non govt sectors, which in fact works to make the euro stronger. Likewise, the deflationary forces unleashed by restrictive fiscal policy likewise imparts a strong euro bias.

These countries run large current account surpluses.

Yes, a force that generates currency appreciation as previously described.

This is why, once the shifting and speculation has run its course, I expect the euro to appreciate continuously until it gets high enough to again reverse the trade flows from surplus to deficit.

Feel free to distribute.

Through a unique mix of huge excess savings and structurally low yields, the entire European continent will continue to be a major source of global imbalances for the rest of this decade.
trade and the dollar/euro- supply and demand doing their thing

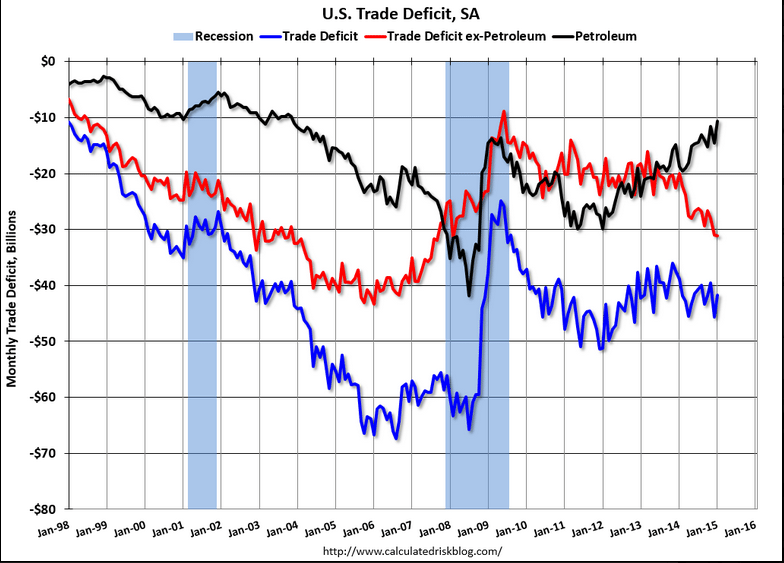
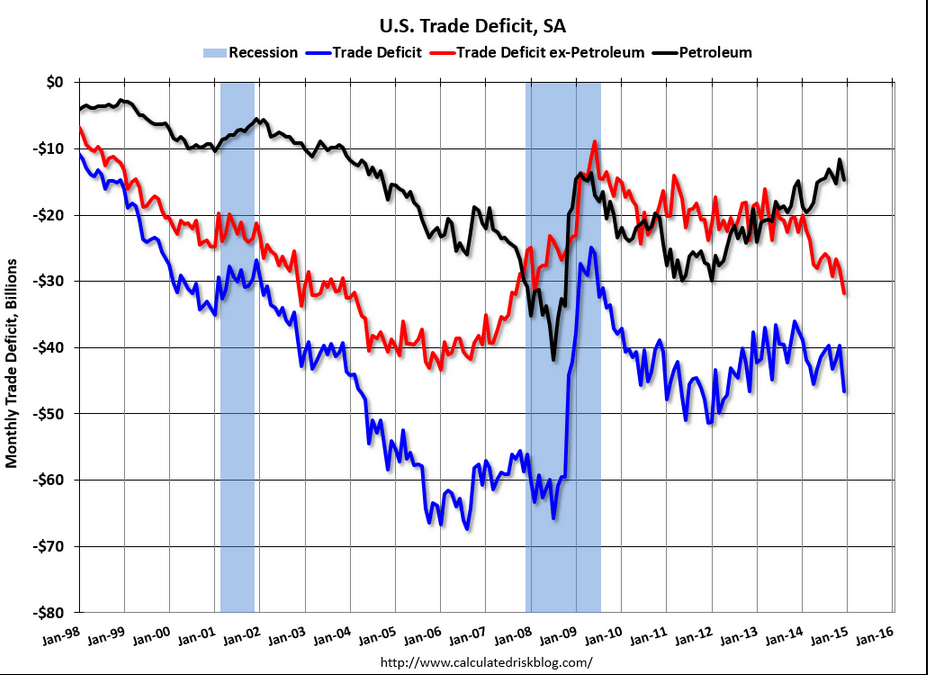
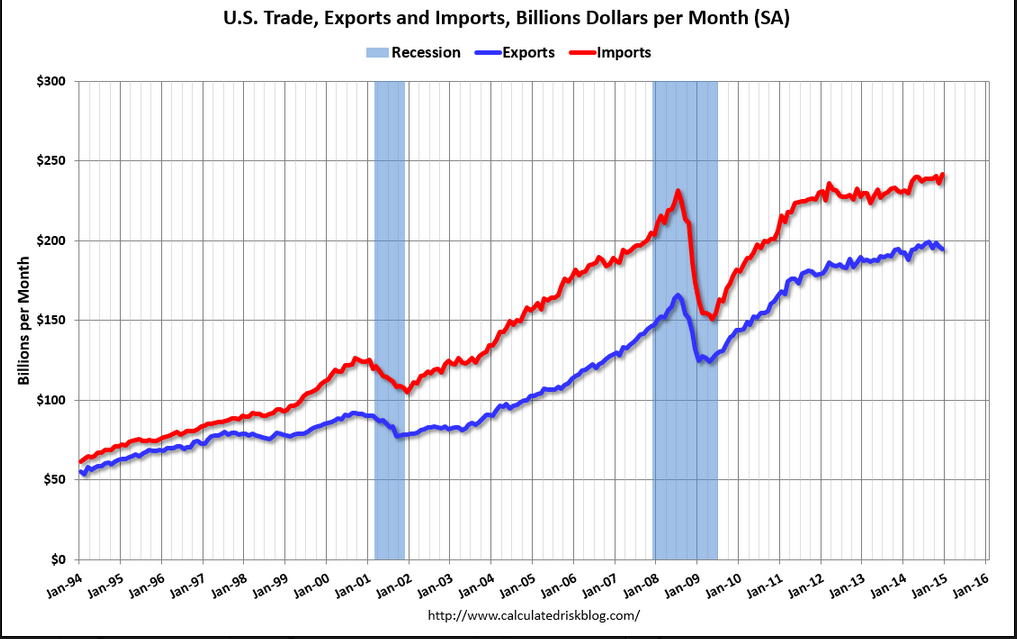
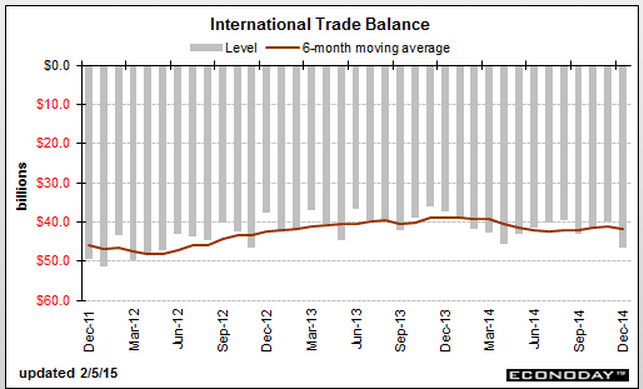
Note how the portfolio shifting that caused the dollar to appreciate has also caused the US trade deficit, excluding petroleum, to likewise increase. That is, it’s not wrong to say that the global portfolios shifting to dollars are getting more and more of those dollars from US resident’s growing net purchases of imports.

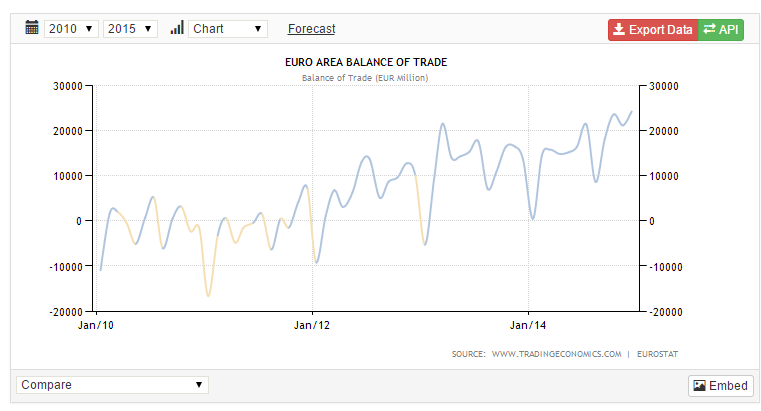
And likewise the EU is experiencing a rising trade surplus as the weak euro/strong dollar has increased EU ‘competitiveness’ by lowering their costs of labor and other domestic inputs vs their trading partners. From the EU point of view they are net selling to US residents and the selling those dollars/buying euro in the market place to get the euro they need to meet their domestic costs of production. This ‘removes’ the euro that are being sold to buy dollars.

This process continues as portfolios afraid of QE and negative rates continue to shift from euro to dollars, driving the exchange rate to the point where the trade flows accommodate their demands as markets continually adjust to express indifference levels.

Note however, that today, for example, the currencies are priced by portfolios where the US has a reasonably large and growing trade deficit and the EU has a reasonably large and growing trade surplus accommodating the ongoing portfolio shifting from euro to dollars. But what happens when the portfolio shifting subsides (which it sooner or later does as portfolios can only shift what they have in stock)? With the exchange rate at a level that is adding dollars and removing euro in line with the prior desired portfolio shifting, a drop in portfolio dollar buying/euro selling means the trade flows are generating an excess supply of dollars and creating a shortage of euro, in which case the exchange rate at the same time adjusts as per the new supply/demand dynamic. In other words, when that happens the dollar falls vs the euro and continues to fall until the trade flows sufficiently reverse to ‘restore’ balance.

From a trading point of view, however, I don’t know when the reversal will take place or from what level, but if any of you might know please let me know thanks!

us-trade-deficit

eu-trade-balance

JPM, MS Q1 revision, Fed labor market conditions index, German exports fall, Japan GDP

From JPM:

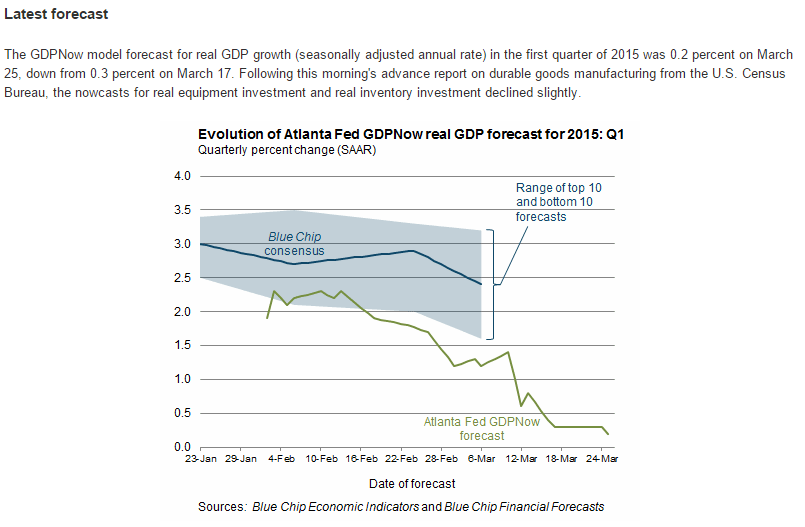
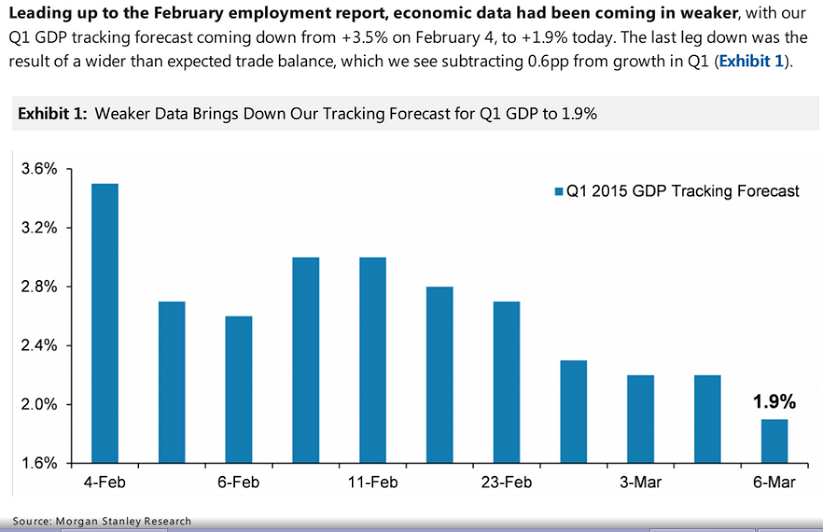
In light of the data we’ve received this week – January reports for real consumer spending, construction spending, and net exports that varied from disappointing to downright weak, as well as a softer February print for car sales –– we are marking down our tracking for annualized real GDP growth in Q1 from 2.5% to 2.0%. Even after this revision risks are more skewed to the downside than upside. By way of comparison, the Atlanta Fed’s tracking estimate of Q1 recently came down to 1.2%.

From MS:

weaker-q1

Labor Market Conditions Index
lmci-feb
Highlights
The Fed’s Labor Market Conditions Index remained positive in February but decelerated to 4 in February from 4.8 in January. This was despite stronger-than expected payroll gains this past Friday. One area of weakness likely was soft wage growth. The Fed’s Research Department does not give details on this unofficial report. While the employment situation’s payroll numbers have some analysts suggesting a June rate hike by the Fed, today’s LMCI indicates that there may be considerable debate within the Fed on “liftoff” timing-especially since inflation is very sluggish.

German exports post biggest drop in five months in January

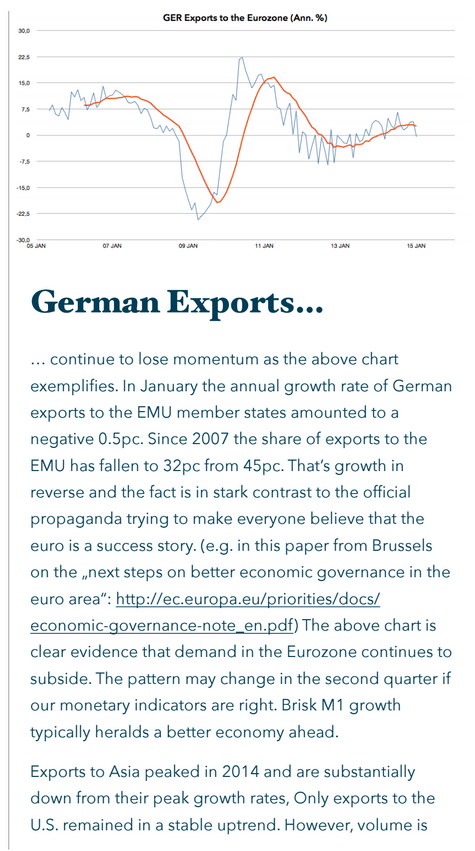
Mar 9 (Reuters) — Seasonally-adjusted exports decreased by 2.1 percent in January after a sharp rise in December. The data for December was revised down to a 2.8 percent gain from a previously reported 3.4 percent increase. An unadjusted breakdown showed shipments to the euro zone dropped by 2.8 percent in January compared with a year ago while Germany sent 0.5 percent fewer goods to countries outside of the European Union. Exports to countries within the EU that do not use the euro were the only ones to post a gain.

Japan’s 4th-qtr GDP downgraded as business investment falls

Mar 9 (Kyodo) — Gross domestic product for October-December grew an annualized real 1.5 percent, downgraded from 2.2 percent. The figure translated into a 0.4 percent increase from the previous quarter, against 0.6 percent growth in a preliminary report released Feb. 16 by the Cabinet Office. Business investment dropped 0.1 percent, against an earlier-reported 0.1 percent growth, for the third straight quarter of decline. Private consumption was upgraded to a 0.5 percent rise from a 0.3 percent increase. Exports grew 2.8 percent, revised upward from a 2.7 percent increase.

Japan trade surplus, US exports, US household loan growth

More US consumption of imports indicated here as well as with US trade data, as US growth continues to get downgraded post oil price collapse:

Japan’s annual exports jump most since late 2013 in boost to economy

May 25 (Reuters) — Japan’s annual exports in January jumped the most since late 2013. The 17.0 percent year-on-year gain in exports marked the fifth straight month of increase, supported by brisk shipments of cars to the United States and of electronics parts to Asia. The export data followed a 12.8 percent rise in December.

And US exports looking suspect as well:

Growth remains steady in Markit’s US manufacturing sample where the flash February reading is holding little changed, at 54.3 vs 53.9 at month-end January and 53.7 at mid-month January. The plus side is led by production volumes, which are at a 4-month high. Dragging on the index are slower growth in employment, the slowest in 7 months, and slower growth in new business, the slowest in 13 months and weighed down especially by weakness in exports and also by weakness among oil & gas customers.

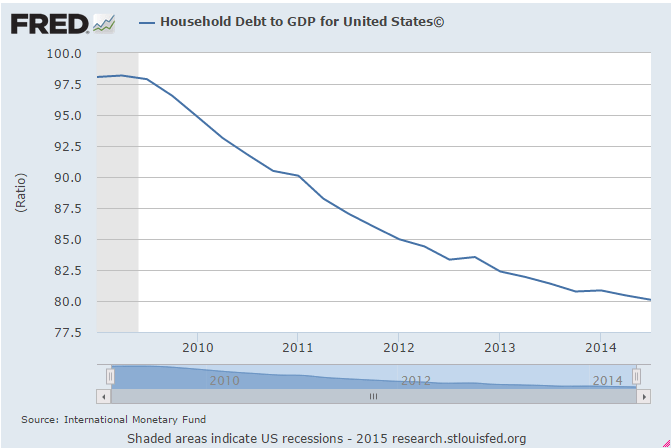
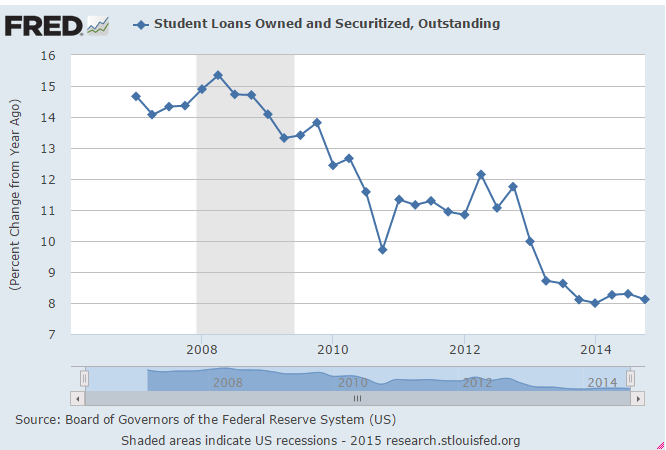
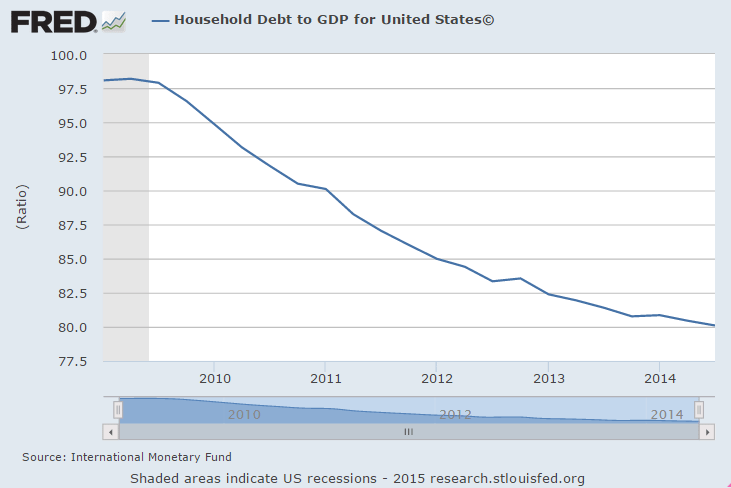
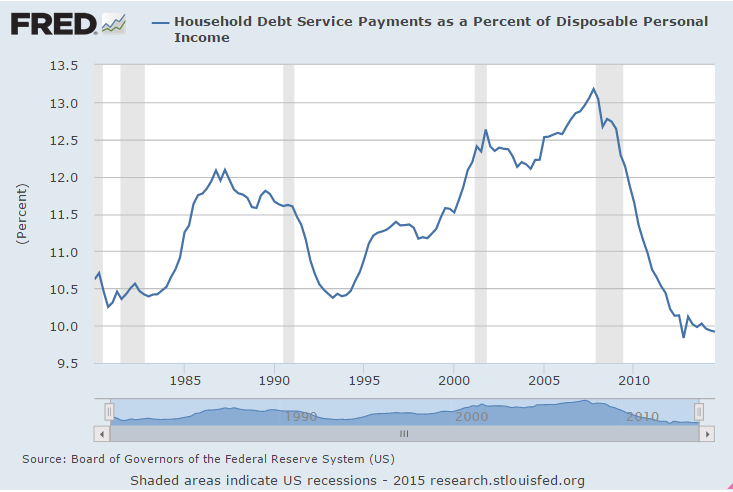
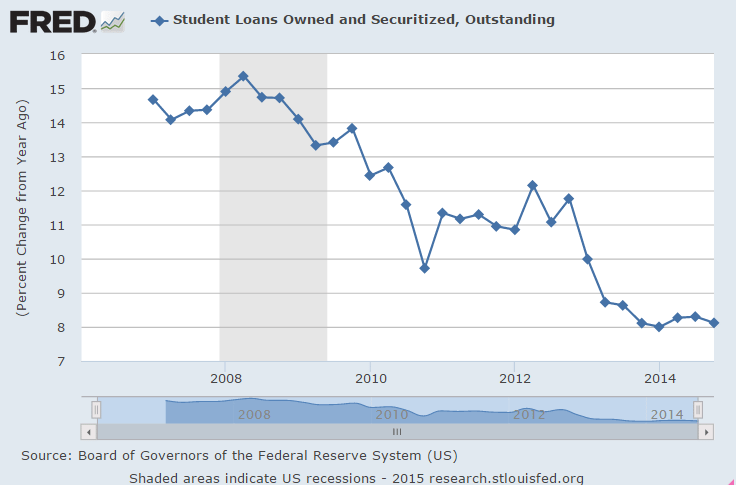
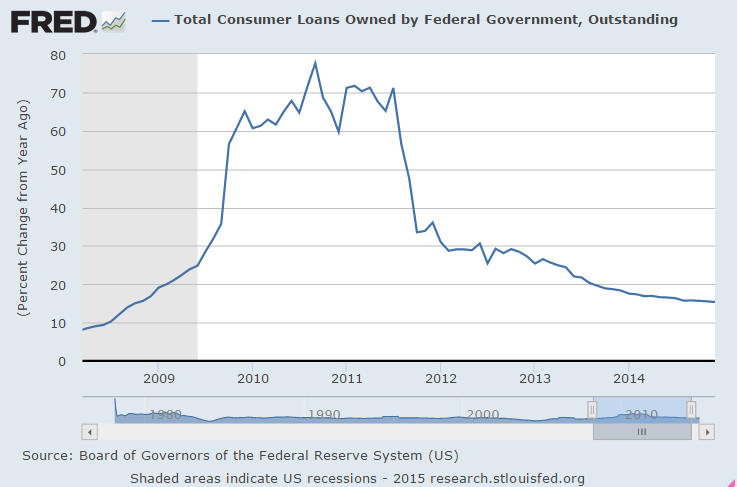
As the US demand leakages (agents spending less than their incomes) grow relentlessly, I look for the deficit spending required to sustain GDP growth. Turns out last year it came from the energy sector which ended abruptly in Q4 2014, with GDP growth sagging accordingly. And so far no sign of a credit expansion from the household sector. You can argue debt is more affordable, but not that it’s happening:

hh-debt

student-loans

Japan trade surplus, US household loan growth, Jobless claims

More US consumption of imports indicated here as well as with US trade data, as US growth continues to get downgraded post oil price collapse:

Japan’s annual exports jump most since late 2013 in boost to economy

Feb 18 (Reuters) — Japan’s annual exports in January jumped the most since late 2013. The 17.0 percent year-on-year gain in exports marked the fifth straight month of increase, supported by brisk shipments of cars to the United States and of electronics parts to Asia. The export data followed a 12.8 percent rise in December.

As the US demand leakages (agents spending less than their incomes) grow relentlessly, I look for the deficit spending required to sustain GDP growth. Turns out last year it came from the energy sector which ended abruptly in Q4 2014, with GDP growth sagging accordingly. And so far no sign of a credit expansion from the household sector. You can argue debt is more affordable, but not that it’s happening:

loan-1

loan-2

loan-3

loan-4

loan-5

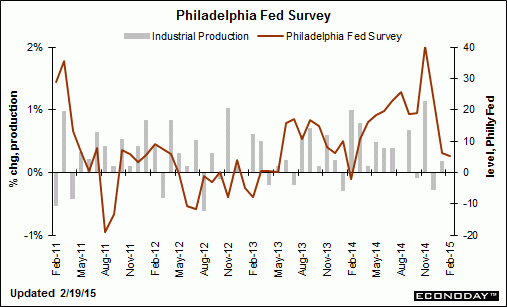
Philly Fed index falls to lowest in a year

philly-fed-feb

philly-fed-feb-graph

EU trade surplus

This is seriously strong euro stuff:

European Union : Merchandise Trade
eu-trade-dec
Highlights
The seasonally adjusted trade balance was in a record E23.3 billion surplus in December, up from a stronger revised E21.6 billion print in November. Unadjusted the black ink stood at E24.3 billion, nearly double the comparable outturn a year ago. The results were on the high side of expectations.

However, the improvement in the headline masked weakness in both sides of the balance sheet. Hence, exports fell 1.1 percent on the month while imports were off a sharper 2.4 percent, their third straight decline. Versus December 2013 exports grew 8.0 percent but weak domestic demand again restricted imports to a modest 1.0 percent advance.

Still, the December report made for an average fourth quarter surplus of E21.7 billion, a significant expansion from the previous period’s E15.7 billion. Although lower oil costs will have been an important factor here the signs are that net export volumes made a positive contribution to Eurozone real GDP growth last quarter. For 2014 as a whole the black ink weighed in at E194.8 billion after a E152.3 billion excess in 2013. Euro weakness should ensure that exports provide a still larger boost over 2015.

Layoffs, Claims, Trade

Challenger Job-Cut Report
eco-release-2-5-1
Highlights
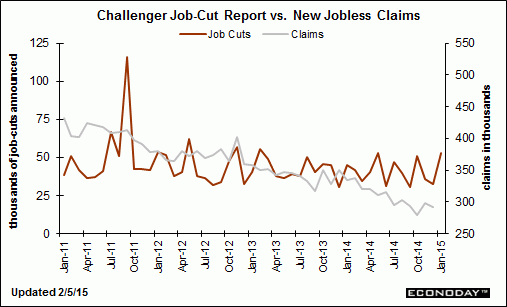
In perhaps the first warning of serious trouble from the oil patch, Challenger’s layoff count starts off the year with an elevated reading, at 53,041 for the highest reading since February 2013 and the highest January reading since 2012. Readings in December and November were much lower, at 32,640 and 35,940.

The energy sector represented roughly 40 percent of January’s cuts, at 20,193. Cuts in the energy sector were minimal in the fourth-quarter, averaging only 1,330 per month. The sector seeing the second largest number of cuts in January is retail, at 6,699 in downsizing following the holidays.

Jobless Claims
eco-release-2-5-2
Highlights
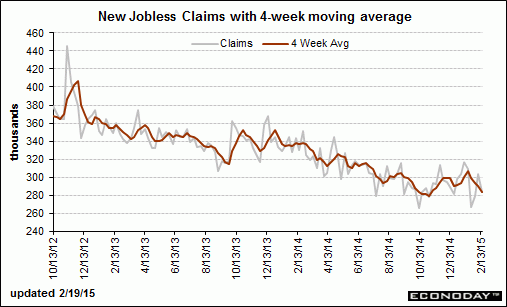
The jobs market is healthy based on jobless claims where initial claims, though up 11,000, came in at a much lower-than-expected 278,000 in the January 31 week, keeping the bulk of the improvement from the prior week’s revised 42,000 fall. The 4-week week average, down a sizable 6,500 in the week to 292,750, is trending right at the month-ago level in a comparison that points to another healthy monthly employment report for tomorrow.

Continuing claims, reported with a 1-week lag, are also at healthy levels though the month-ago comparison is less favorable. Continuing claims in the January 24 week rose 6,000 to 2.400 million while the 4-week average, though down 22,000, is at a 2.421 million level that is slightly above the month-ago trend. The unemployment rate for insured workers is holding at a recovery low of 1.8 percent.
eco-release-2-5-3

Negative productivity/jump in unit labor costs = over hiring given actual output?

Productivity and Costs
eco-release-2-5-4
Highlights
Nonfarm productivity growth for the fourth quarter declined an annualized 1.8 percent, following a 3.7 percent jump in the third quarter. Expectations were for a 0.2 percent rise. Unit labor costs increased 2.7 percent after falling an annualized 2.3 percent in the third quarter. Analysts projected a 1.2 percent gain.

Output growth softened to 3.2 percent in the fourth quarter, following a 6.3 percent jump the prior quarter. Compensation growth posted at 0.9 percent annualized after 1.3 percent the quarter before.

Year-on-year, productivity was unchanged in the fourth quarter, down from 1.3 percent in the third quarter. Year-ago unit labor costs were up 1.9 percent, compared to up 0.9 percent in the third quarter.

International Trade
eco-release-2-5-5
Highlights
The U.S. trade balance for December widened instead of narrowing as expected. Lower oil prices actually cut into petroleum exports.

In December, the U.S. trade gap grew to $46.6 billion from a revised $39.8 billion in November. Analysts forecast the deficit to narrow to $37.9 billion. Exports were down 0.8 percent after declining 1.1 percent the month before. Imports rebounded 2.2 percent after falling 1.8 percent in November.

Expansion in the overall gap was led by the goods excluding petroleum gap which increased to $49.7 billion from $46.3 billion in November.

The petroleum goods trade gap posted at $14.7 billion from $11.6 billion in November. Petroleum imports were up 7.7 percent while exports decreased 11.6 percent.

The services surplus was essentially unchanged at $19.5 billion.

On a seasonally adjusted basis, the December figures show surpluses, in billions of dollars, with
with South and Central America ($2.6), Brazil ($0.4), and United Kingdom ($0.1). Deficits were recorded, in billions of dollars, with China ($30.4), European Union ($12.7), Germany ($5.6), Mexico ($5.6), Japan ($5.4), Canada ($3.3), South Korea ($2.7), OPEC ($2.3), India ($2.1), Italy ($2.1), France ($1.1), and Saudi Arabia ($1.0).

Overall, the December number will likely lower estimates for fourth quarter GDP growth. But the good news is that the import numbers suggest that demand is moderately healthy.

eco-release-2-5-6

eco-release-2-5-7

eco-release-2-5-8

Jobs, Wages, Wholesale trade

Employment Situation
payrolls-dec
Highlights
The December employment situation was somewhat stronger than expected at the headline level but the payroll numbers softened. In terms of actual numbers, the report was mixed.

Payroll jobs advanced 252,000 after jumping a revised 353,000 in November. Analysts projected a 245,000 gain. October and November were revised up notably by a net 50,000. The unemployment rate decreased to 5.6 percent from 5.8 percent in November. Expectations were for 5.7 percent. Wages actually fell back for the latest month.

Going back to the payroll report, private payrolls increased 240,000 after rising 345,000 in November. Expectations were for 238,000.

Goods-producing jobs jumped in December, led by construction which advanced 67,000 in December after a 20,000 increase the month before. Manufacturing employment increased 17,000, following a jump of 29,000 in November. Mining rose 3,000 in December, following a 1,000 boost the prior month.

Private service-providing jobs gained 173,000 after a 294,000 jump in October. The latest increase was led by professional & business services. Government jobs increased 12,000 after rising 8,000 in November.

Average hourly earnings slipped 0.2 percent in December after gaining 0.2 percent the prior month. Expectations were for a 0.2 percent rise. Average weekly hours were unchanged at 34.6 hours and matched expectations.

The December jobs report was mixed. Payroll gains beat expectations but slowed from November. Wage growth softened. The unemployment rate dipped but partially on a lower participation rate. Still, the labor market is showing overall improvement. However, today’s numbers will only increase debate within the Fed on just how strong or soft the labor market really is.

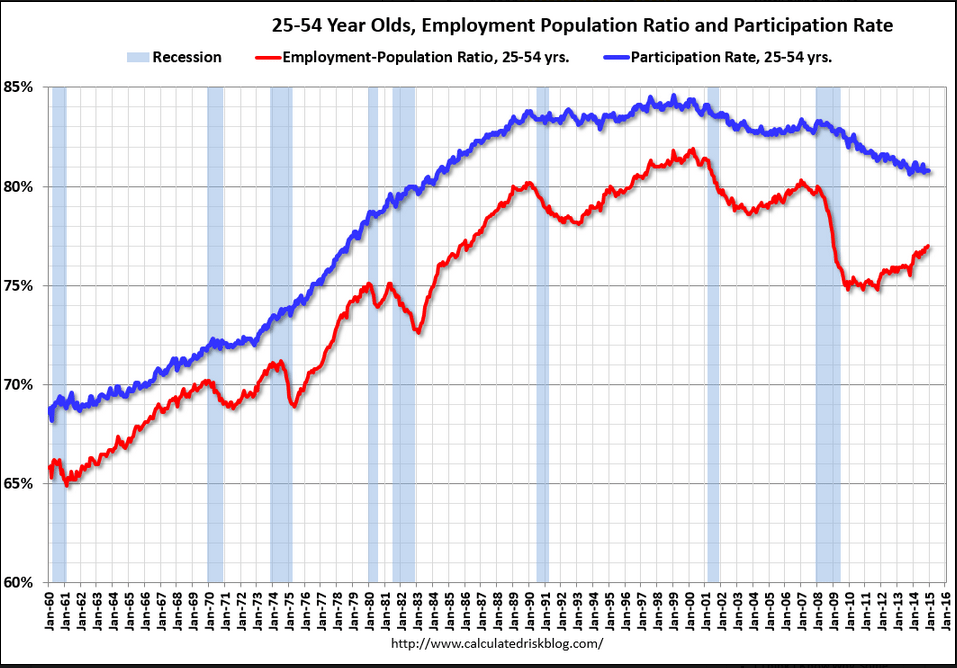
This chart takes out the ‘demographics’ by looking only at 24-55 year old Americans.

It shows how ‘the problem’ remains a massive shortage of aggregate demand:

payrolls-dec-graph

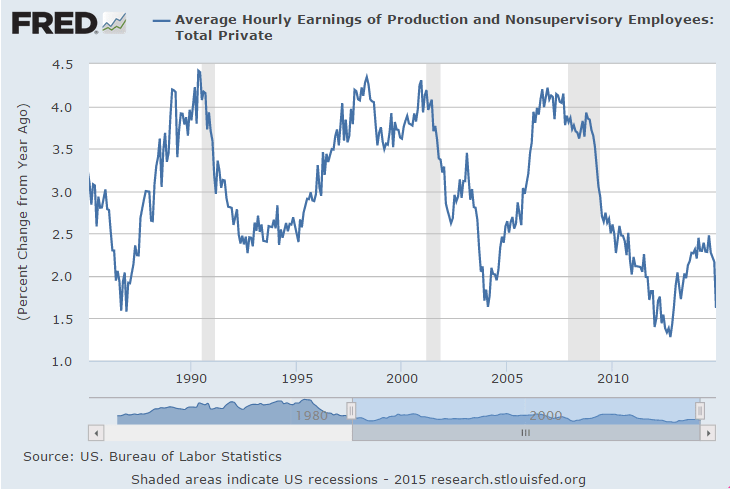
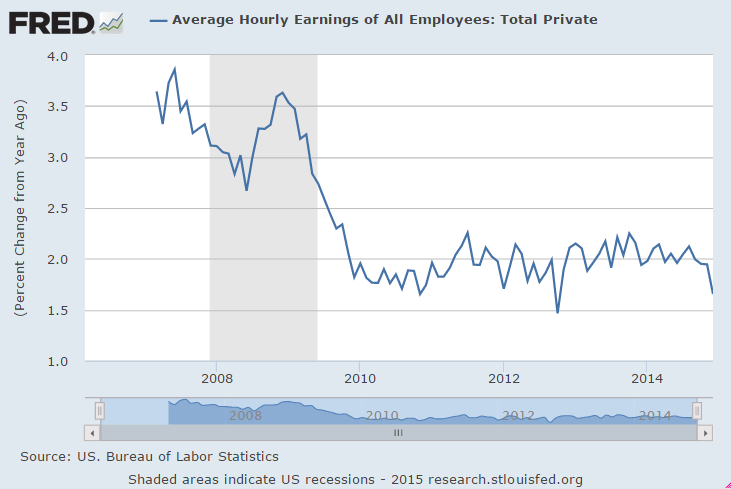
Not long ago the mainstream raised the alarm that average hourly earnings were ‘accelerating’ and when this happens it doesn’t stop for an average of 4 years, so the Fed better hike now to avoid a serious inflation problem. When I suggested it might roll over this time as it did in 2003, that notions was immediately dismissed:
earnings-dec-1
Maybe higher paying energy jobs being replaced with lower paying fast food, retail, education, and healthcare types of jobs?
earnings-dec-2

Wholesale Trade
trade-nov
Inventories look a bit heavy in the wholesale sector, up 0.8 percent in November vs a 0.3 percent decline in sales that lifts the stock-to-sales ratio to 1.21 from October’s 1.20 and compared to 1.19 in September. Weak sales made for unwanted inventory builds in metals, chemicals, lumber, machinery and farm products.

The nation’s inventories have been steady though today’s report does hint at slowing demand going into year end. Watch for the final data on November inventories in Wednesday’s business inventories report.

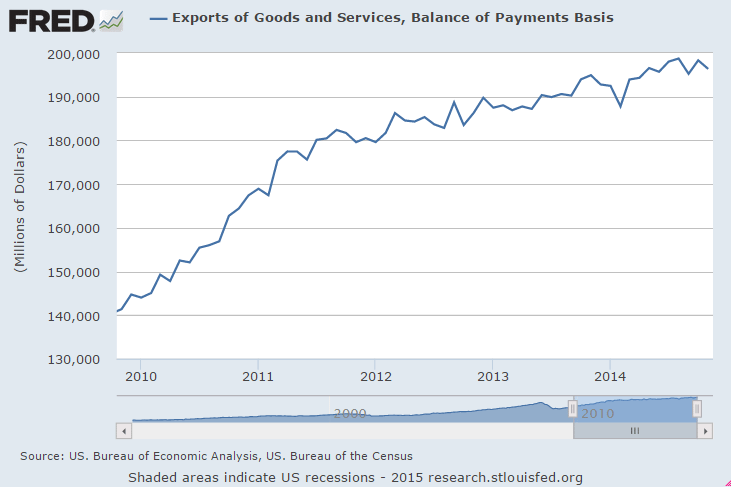
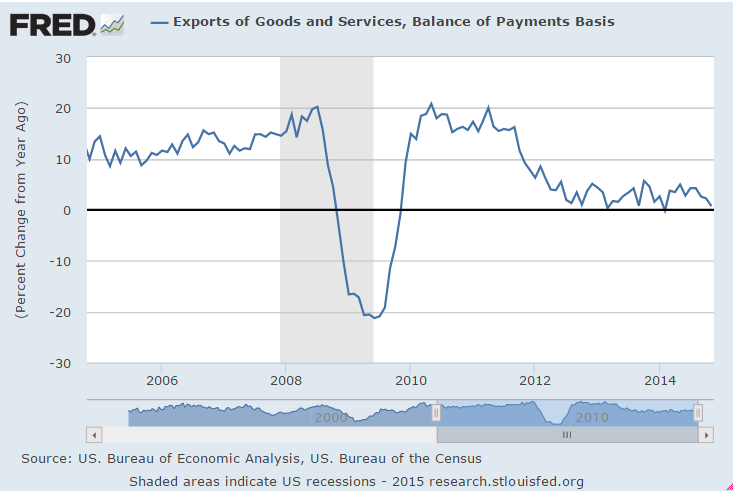
I’m suspecting US exports are in the process of declining due to the lower oil price and the weak global economy. Oil producers both have less to spend due to falling revenues and they will also reduce capital expenditures that are no longer profitable.

And while ‘global consumers’ will have more to spend due to falling fuel costs, seems to me that nations other than the US will benefit from that type of spending.

You can see how US exports have rolled over recently:
exports-nov-1

Year over year growth is now near 0:
exports-nov-2

To the point of ‘bad inflation’ in Japan:

Japanese People Feel Their Lives Are Worse Off

Jan 8 (WSJ) — A Bank of Japan survey of more than 2,000 people found that falling real incomes and rising prices have made people feel worse off than at any time in the past three years. About 51% said the comfort of their life has diminished over the past year, while just 4% felt life was getting better. The differential, about 47 percentage points, was the worst level since December 2011, the central bank said. Respondents to the survey also tended to be pessimistic about the year ahead. Nearly 38% said they thought the economy would get worse over the next year. In the previous poll, taken in September 2014, only about 32% thought that. And more than half of respondents said they believed growth in the future would be lower than it is now.