personal income, home prices, new home sales, Richmond Fed

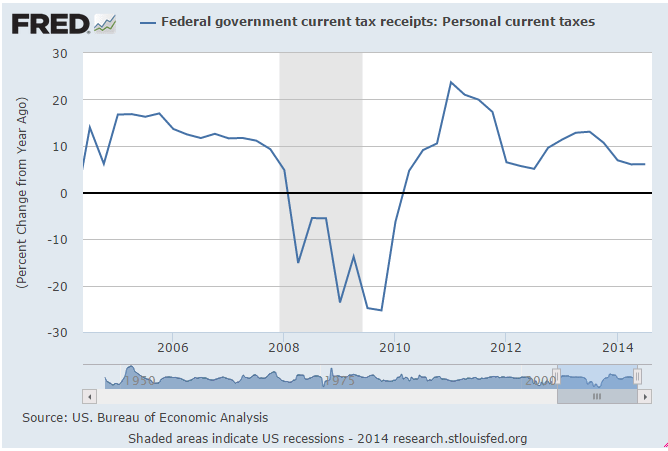
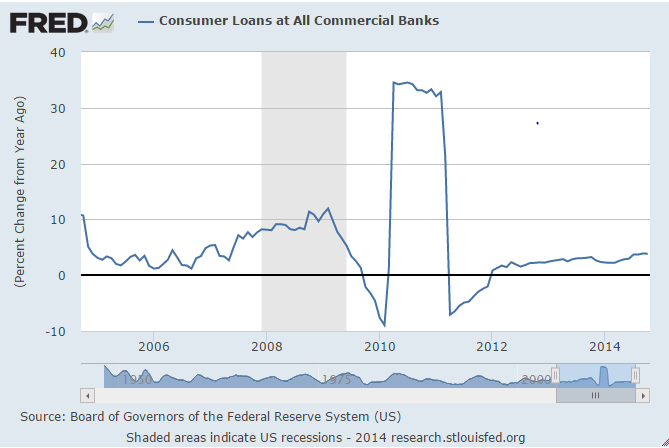
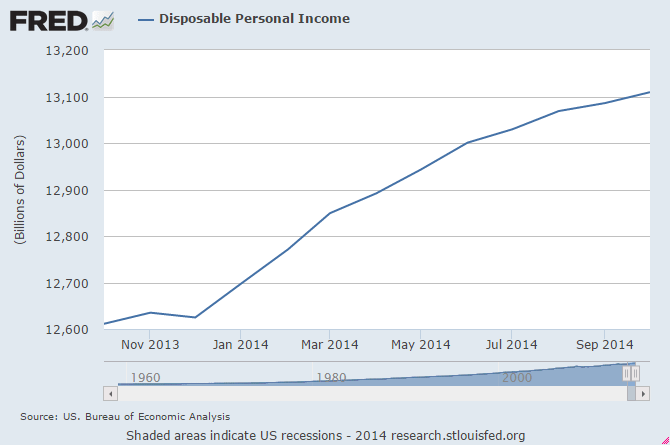
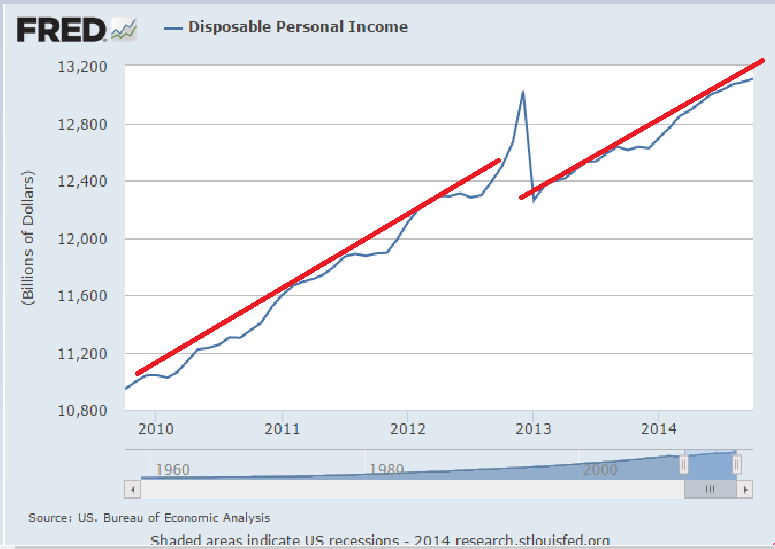
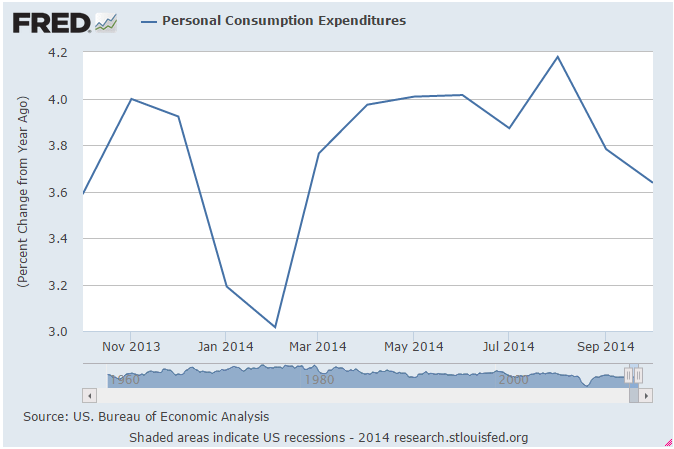
Personal Income growth remains anemic, particularly when the distribution of income gains is factored in. The gain in consumer spending was all durable goods, which has already reversed as per today’s earlier release.

Personal Income and Outlays
pers-income-nov
Highlights
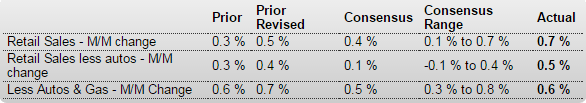
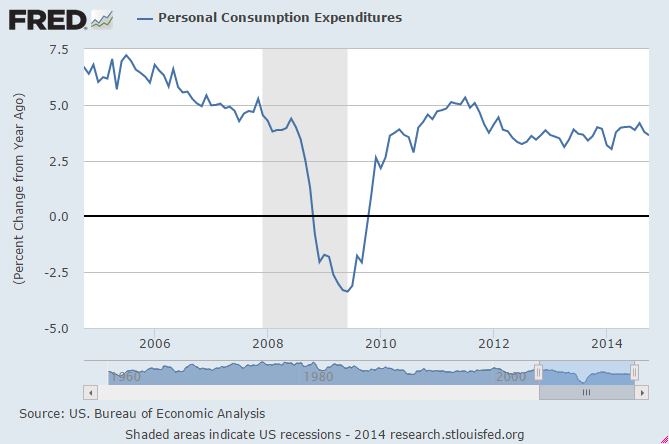
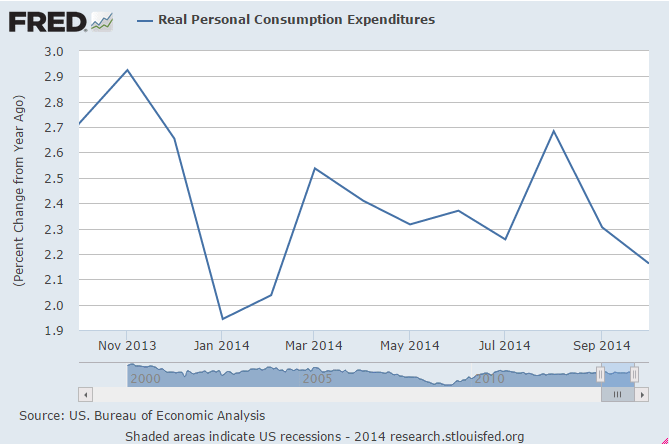
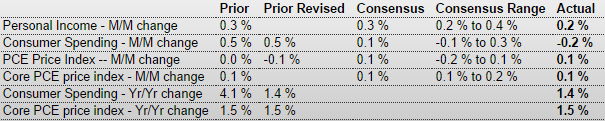
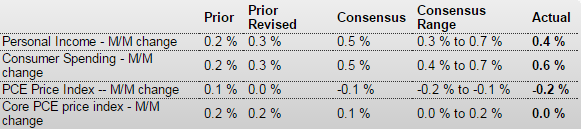
The consumer sector continues to improve with gains in income and spending but inflation remains weak. Personal income advanced 0.4 percent in November after growing 0.3 percent in October. The wages & salaries component increased 0.5 percent, following a gain of 0.3 percent the month before.

Personal spending grew 0.6 percent, following 0.3 percent in October.

Strength was in durables which jumped 1.6 percent, following a rise of 0.3 percent in October. Nondurables were unchanged in November after decreasing 0.3 percent the prior month. Services improved 0.6 percent after rising 0.4 percent in October.

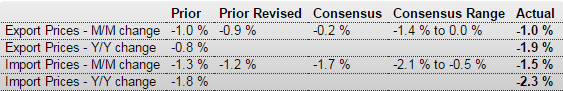
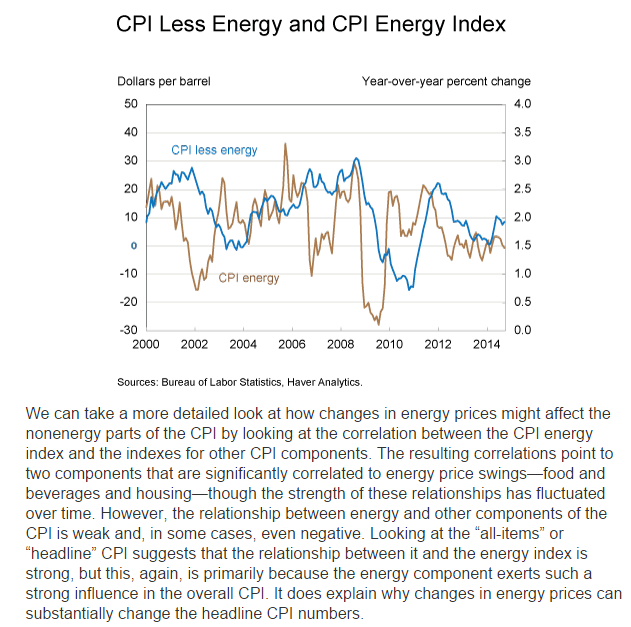
PCE inflation continues to be weak-largely due to lower energy costs. Headline inflation posted at a minus 0.2 percent on a monthly basis, following no change in October. Core PCE inflation was flat in November, following a 0.2 percent rise in October.

On a year-ago basis, headline PCE inflation eased to 1.2 percent in November from 1.4 percent the prior month. Year-ago core inflation came in at 1.4 percent in November compared to 1.5 percent in October. Both series remain below the Fed goal of 2 percent year-ago inflation.

Overall, the consumer sector is slowly improving even though inflation is below the Fed’s goal. In fact, lower gasoline prices are improving discretionary income and boosting spending elsewhere.

FHFA prices for home sales were up as the number of cheaper distressed sales declined.

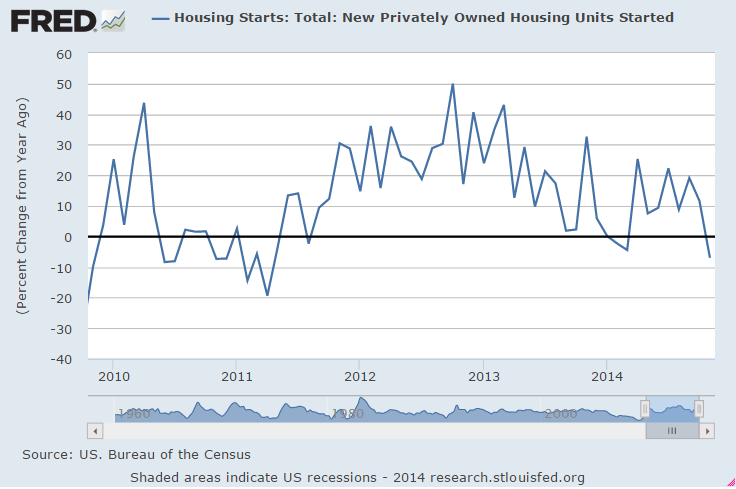
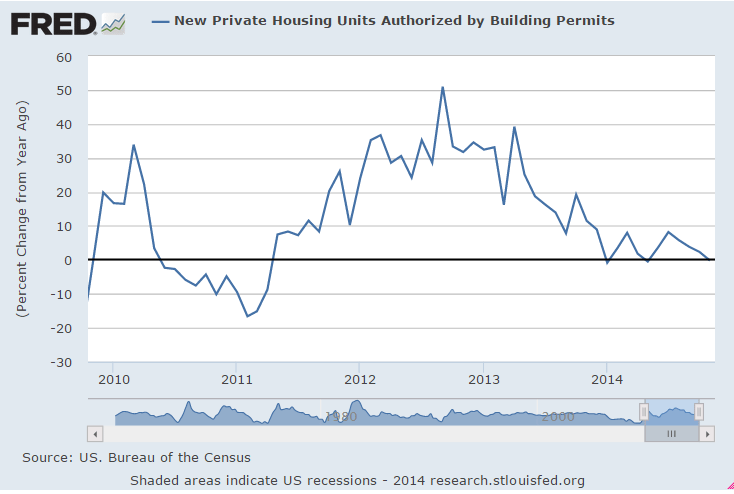
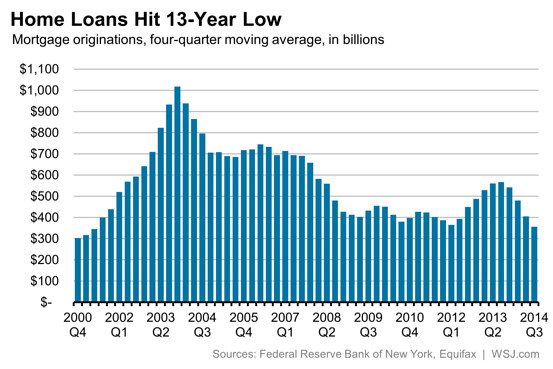
Still looking like the cycle has peaked.
fhfa
Yet another reversal from a blip up in Q3, and new home sales are a contributor to GDP, so this should cause more downward revisions to Q4 GDP

New Home Sales
new-home-sales-nov
Highlights
Like yesterday’s existing home sales report, today’s report on new home sales came in below low-end expectations, down 1.6 percent in November to an annual sales rate of 438,000 vs expectations for 460,000 and Econoday’s low-end estimate for 440,000.

Also like yesterday’s existing home sales report, price data show weakness with the median price down 3.2 percent in the month to $280,000. Year-on-year, the median price is up only 1.4 percent which, in what at least doesn’t point to an imbalance, is largely in line with year-on-year sales which are down 1.6 percent.

Supply data are stable with 213,000 new homes on the market vs 210,000 in October. Supply relative to sales is up slightly, to 5.8 months from 5.7 and 5.5 months in the prior two months. Regional sales data show declines in 3 of 4 regions including the South, which is larger than all other regions combined in this report, and a gain in the West.

Housing had been showing some life going into the fourth quarter but the readings on November have been a surprising disappointment and won’t be good reading for the nation’s builders.
new-home-sales-nov-graph

Richmond Fed Manufacturing Index
richmond-fed
Highlights
Activity has picked up this month in the Richmond’s Fed manufacturing district, to 7 from 4 in November. New orders show relative strength, at 4 vs November’s 1, but are still on the soft side. Order backlogs, however, show outright contraction for a second month, at minus 5 vs minus 2 in November.

Shipments show relative strength to November, at 5 vs 1, but, like new orders, are still on the soft side. A definitive sign of strength, however, comes from employment which is up 3 points to a very solid 13 in a reading that points to underlying confidence among the region’s manufacturers. Price data are soft in line with declining fuel costs.

Early readings on December’s manufacturing activity are mixed with today’s report and last week’s report from Kansas City pointing to slight acceleration for December but the reports from the New York and Philly Feds, along with the PMI national flash report, pointing to softness. Reports on November have also proven mixed with last week’s industrial production report showing outstanding strength in contrast to this.

Housing starts, Japan discussion, China, US pmi, store sales

Looks bad to me. Remember, for GDP to grow at last year’s rate, all the pieces on average have to contribute that much. And, as previously discussed, hard to see how starts and sales can grow with cash buyers and mtg purchase apps declining year over year.

The charts look like we are well past this cycle’s peak and headed into negative territory. Not to mention multifamily had been leading the way and those units tend to be smaller/cheaper, so if you were to look at the $ being invested vs prior cycles it would look even worse.

Housing Starts
housing-starts-nov
Highlights
Housing remains on a flat trajectory. Single-family starts and multifamily starts moved in opposite directions. Housing starts dipped 1.6 percent after rebounding 1.7 percent in October. Analysts projected a 1.038 million pace for November. The 1.028 million unit pace was down 7.0 percent on a year-ago basis.

November strength was in the volatile multifamily component. Multifamily starts rebounded 6.7 percent after declining 9.9 percent in October. In contrast, single-family starts fell 5.4 percent in November after gaining 8.0 percent in October.

Housing permits declined a monthly 5.2 percent, following a 5.9 percent jump in October. The 1.035 million unit pace was down 0.2 percent on a year-ago basis. Market expectations were for 1.060 million units annualized.

Overall, recent housing numbers have oscillated notably. October was relatively good but November was not. On average, housing growth appears to be flat to modestly positive.

hs-nov-1

hs-nov-2

hs-nov-3
And how about this headline? Make any sense to you?

hs-headline

Japan’s got issues, but ability to ‘service it’s yen debt’ isn’t one of them, as it’s just a matter of debiting securities accounts at the BOJ/by the BOJ and crediting member bank accounts also at the BOJ. But markets don’t seem to quite believe that:

jgb-cds

Meanwhile, Japan’s ‘depreciate your currency to prosperity’ policy combined with tax hikes on domestic consumers- about as ‘pro exporter at the expense of most everyone else’- is producing the outcomes previously discussed. They include falling real domestic incomes/real standards of living, increased exporter margins/sales/profits, etc. And more to come, seems, under the ‘no matter how much I cut off it’s still too short, said the carpenter’ mantra now practiced globally.

A few anecdotes:

The day after his ruling coalition secured more than two-thirds of the seats in parliament’s lower house, Mr. Abe acknowledged at a news conference that higher stock prices and corporate profits under his administration have yet to translate into worker gains.

“As I toured around the nation during the election, I heard the opinions of ordinary citizens who are suffering from price increases and small-business owners in difficulties due to price hikes in raw materials,” Mr. Abe said, adding that he will draft an economic stimulus package by the end of the year.

For the second year in a row, the conservative prime minister and his historically pro-business Liberal Democratic Party find themselves in the position of imploring corporations to cut into their profits and give workers more. Mr. Abe said he would summon executives and labor leaders to a meeting Tuesday to make his pitch ahead of next spring’s annual wage talks.

The reason: If wages don’t rise as quickly as prices, households could cut back on spending, endangering an economic recovery. There have only been four months since Mr. Abe took power in December 2012 when real wages—the value of paychecks after accounting for inflation—have risen. A weaker yen has made imported food and other goods more expensive, and a rise in the national sales tax to 8% in April from 5% hit consumers further.

While wages have gone up in nominal terms this year, rising prices — partly the result of a consumption tax hike in April — have negated those gains. Adjusted for inflation, total cash earnings fell 2.8% on the year in October, dropping for a 16th straight month. Unions hope that with this month’s lower house election shaping up to be partly a referendum on Abenomics, the prime minister’s plan for ending deflation, Japan will see a serious debate on wage growth.

The corporate sector is coming to terms with the need to raise pay to some degree next spring.

“What is important is escaping the deflation that has persisted for 15 years,” Sadayuki Sakakibara, chairman of the Keidanren business lobby, told reporters Wednesday.

“Companies that have succeeded in growing their profits ought to reflect that success in their wage increases,” he added.

For the second year in a row, Keidanren will explicitly encourage member companies to raise wages in its guidance for the spring’s “shunto” negotiations.


But even as big export-driven manufacturers cruise toward record profits, many smaller companies, particularly those dependent on domestic demand, are suffering the side effects of a weak yen and still waiting for consumer spending to recover from the tax hike.

China continues to go down the tubes and the western educated hot shots keep pushing the tight fiscal and what they think is ‘loose monetary’ policy that’s failed every time it’s been tried in the history of the galaxy:

Operating conditions deteriorate for the first time since May

(Markit) — Flash China Manufacturing PMI slipped to 49.5 in December from 50.0 in November. Manufacturing Output Index ticked up to 49.7 from 49.6. New Orders decreased while New Export Orders increased at a faster rate. “The HSBC China Manufacturing PMI dropped to a seven-month low of 49.5 in the flash reading for December, down from 50.0 in November. Domestic demand slowed considerably and fell below 50 for the first time since April 2014. Price indices also fell sharply. The manufacturing slowdown continues in December and points to a weak ending for 2014. The rising disinflationary pressures, which fundamentally reflect weak demand, warrant further monetary easing in the coming months.”

Not good here either:

PMI Manufacturing Index Flash
dec-pmi

And this came out. Note the year over year trend.

icsc-goldman-dec

claims, retail sales, prices, inventories

If sales are going to fall off it will be after the layoffs and capital expenditure cuts from the fall in crude prices take place:
c-rs-p-i-1

c-rs-p-i-2

Jobless Claims
c-rs-p-i-3

Highlights
Jobless claims data are low but still are still trending higher than a month ago in comparisons that do not point to further improvement for the monthly employment report. Initial claims did fall 3,000 in the December 6 week to 294,000 but the 4-week average, up slightly to 299,250, is still about 15,000 higher than in early November.

Continuing claims tell the same story, up a steep 142,000 to 2.514 million in lagging data for the November 29 week. This is the highest level since mid August. The 4-week average, up 28,000 to 2.386 million, is also up about 15,000 vs the month-ago comparison. The unemployment rate for insured workers ticked higher for the first time since late August, up 1 tenth to 1.9 percent.

Retail Sales
c-rs-p-i-4
Highlights
Retail sales in November came in strong despite lower gasoline prices. Retail sales in November posted a 0.7 percent boost after rebounding 0.5 percent in October Market expectations were for 0.4 percent rise for November. Autos jumped a notable 1.7 percent after gaining 0.8 percent in October. Excluding autos, sales increased 0.5 percent after rising 0.4 percent in October. Forecasts were for a 0.1 percent boost.

Gasoline station sales fell on lower prices. Sales declined 0.8 percent after a 1.3 percent drop in October. Excluding both autos and gasoline sales advanced 0.6 percent in November after a 0.7 percent rise the prior month. The median market forecast was for 0.5 percent.

Within the core strength was broad based, led by building materials & garden equipment (up 1.4 percent); clothing & accessories (up 1.2 percent); and nonstore retailers (up 1.0 percent).

Today’s retail sales report is favorable for fourth quarter GDP in the personal consumption component. Currently, the consumer sector is leading the recovery with confidence and spending up.
c-rs-p-i-5

Import and Export Prices
c-rs-p-i-6
Highlights
Cross-border price pressures are nowhere to be found in the import & export price report where import prices dropped 1.5 percent in November, the 5th straight drop and the steepest since June 2012, and export prices fell 1.0 percent for the 4th straight drop and matching the steepest drop since June 2012. The year-on-year rate for import prices is at minus 2.3, the steepest negative reading since April 2013, with export prices at minus 1.9, the steepest since October 2013.

And it’s not just oil-related prices that are falling. Excluding petroleum, import prices fell 0.3 percent in the month for a 4th straight drop and the steepest since April this year while export prices, excluding both food and fuels for this reading, fell 0.5 percent for a third straight drop. The year-on-year reading for ex-petroleum import prices is at only plus 0.1 percent with ex-food & ex-fuel export prices at minus 0.4 percent.

A look at finished goods shows extended declines for nearly all readings. Prices of imported motor vehicles are down 0.1 percent in the month for a 1.0 percent year-on-year decline while prices of exported consumer goods are down 0.3 percent for both the monthly and year-on-year comparisons.

The strong dollar is an important factor that is keeping import prices down, but it’s more than the dollar as evidenced by the export side of the data. Falling oil prices are having a spillover effect throughout the global price picture. Today’s data point to very soft readings for tomorrow’s producer price report and they won’t be lifting expectations for Wednesday’s consumer price report.

Business Inventories
c-rs-p-i-7
Highlights
Total business inventories rose slightly in October, up 0.2 percent, but show no significant change relative to business sales which slipped 0.1 percent. The stock-to-sales ratio is unchanged for a 3rd straight month at 1.30.

Saudi crude output, Crude price cuts and deflation

Saudis post prices for refiners, then let them buy all they want at those prices. The chart shows the ‘residual demand’ for crude oil has been reasonably steady, indicating that the price did not move due to any kind of a ‘supply glut’ but to Saudi pricing:

saudi-nov

To my point about crude price cuts triggering a general deflation, this is from the Cleveland Fed. Note that in 2008 the price of crude went to 35 but only briefly. My concern is that if crude were to stay low the deflationary effect would continue perhaps until prior relative value was restored:

Since the CPI is most directly influenced by oil price changes through its energy component, one question that remains is whether or not other components in the CPI are influenced by low oil prices. Generally, energy prices are rather volatile, and so energy components are often excluded when predicting inflation because of that volatility. Forecasters focus on “core” measures instead. The recent decline in oil prices is of less concern to many CPI forecasters, because it may not affect the “core” price level. It would be a bit more concerning, however, if low oil prices also affected other domestic prices as well. A quick look at the year-over-year percent changes in the energy CPI and the CPI excluding energy suggests changes in energy prices are often followed by similar changes in the rest of the CPI’s components.

core-cpi

November budget review-up slightly year over year for November

From the Congressional Budget Office:

The federal government’s budget deficit was $181 billion for the first two months of fiscal year 2015, $45 billion less than the shortfall recorded in October and November of last year, CBO estimates. That outcome was affected by shifts in the timing of certain payments. Without those shifts, the deficit would have declined by just $9 billion.

Estimated Deficit in November 2014: $59 Billion

CBO estimates that the government recorded a deficit of $59 billion in November 2014—$76 billion less than the deficit in November 2013. But shifts in the timing of certain payments (because the regular payment dates fell on weekends) boosted spending in November 2013 and reduced it in November 2014. Without those shifts, the November 2014 deficit would have been $3 billion more than the November 2013 deficit.

Individual income taxes and payroll taxes together increased by $5 billion (or 2 percent); a $4 billion increase in withheld taxes explains nearly all of that change.

This is quarterly data released a couple of weeks ago. You can see the growth had slowed to 6.1%, and now most recently is down to 2%, which is a red flag for negative GDP growth:

fed-def

Credit check and comment on rate policy

A bit of a move up this week, but still not much happening
cc-2-1

Still going nowhere:
cc-2-2

cc-2-3

So all the talk is about a rate hike next year. And not much talk about what that’s supposed to do. The mainstream presumes, for example, that a rate hike will somehow moderate ‘inflation’ through the lending channel. That is, higher rates will discourage borrowing and thereby moderate borrowing to spend. Setting aside the point about the effect of increased income to savers/investors, etc, and to their narrow point, exactly which ‘borrowing to spend’ needs ‘cooling off’?

Housing has near flat lined at historic lows, and even the growth rate of the one ‘bright spot’- cars- has been slowing. And from the above charts it doesn’t look to me like there’s any ‘excess credit growth’ problem they’d want to cool down via a rate hike anywhere in sight?

Not that they won’t do it anyway, just on general principles that the interest rate they set ‘should’ be higher than the ‘rate of inflation’, ‘or else’ something ‘bad’ will happen…

Comments on crude pricing, the economy, and the banking system

Crude pricing

The Saudis are the ‘supplier of last resort’/swing producer. Every day the world buys all the crude the other producers sell to the highest bidder and then go to the Saudis for the last 9-10 million barrels that are getting consumed. They either pay the Saudis price or shut the lights off, rendering the Saudis price setter/swing producer.

Specifically, the Saudis don’t sell at spot price in the market place, but instead simply post prices for their customers/refiners and let them buy all they want at those prices.

And most recently the prices they have posted have been fixed spreads from various benchmarks, like Brent.

Saudi spread pricing works like this:
Assume, for purposes of illustration, Saudi crude would sell at a discount of $1 vs Brent (due to higher refining costs etc.) if they let ‘the market’ decide the spread by selling a specific quantity at ‘market prices’/to the highest bidder. Instead, however, they announce they will sell at a $2 discount to Brent and let the refiners buy all they want.

So what happens?
The answer first- this sets a downward price spiral in motion. Refiners see the lower price available from the Saudis and lower the price they are willing to pay everyone else. And everyone else is a ‘price taker’ selling to the highest bidder, which is now $1 lower than ‘indifference levels’. When the other suppliers sell $1 lower than before the Saudi price cut/larger discount of $1, the Brent price drops by $1. Saudi crude is then available for $1 less than before, as the $2 discount remains in place. Etc. etc. with no end until either:
1) The Saudis change the discount/raise their price
2) Physical demand goes up beyond the Saudis capacity to increase production

And setting the spread north of ‘neutral’ causes prices to rise, etc.

Bottom line is the Saudis set price, and have engineered the latest decline. There was no shift in net global supply/demand as evidenced by Saudi output remaining relatively stable throughout.

The Global Economy

If all the crude had simply been sold to the highest bidder/market prices, in a non monetary relative value world the amount consumed would have been ‘supply limited’ based on the real marginal cost, etc. And if prices were falling do to an increased supply offered for sale, the relative price of crude would be falling as the supply purchased and consumed rose. This would represent an increase in real output and real consumption/real GDP(yes, real emissions, etc.)

However, that’s not the case with the Saudis as price setter. The world was not operating on a ‘quantity constrained’ basis as the Saudis were continuously willing to sell more than the world wanted to purchase from them at their price. If there was any increase in non Saudi supply, total crude sales/consumption remained as before, but with the Saudis selling that much less.

Therefore, with the drop in prices, at least in the near term, output/consumption/GDP doesn’t per se go up.

Nor, in theory, in a market economy/flexible prices, does the relative value of crude change. Instead, all other prices simply adjust downward in line with the drop in crude prices.

Let me elaborate.
In a market economy (not to say that we actually have one) only one price need be set and with all others gravitating towards ‘indifference levels’. In fact, one price must be set or it’s all a ‘non starter’. So which price is set today? Mainstream economists ponder over this, and, as they’ve overlooked the fact that the currency is a public monopoly, have concluded that the price level exists today for whatever ‘historic’ reasons, and the important question is not how it got here, but what might make it change from today’s level. That is, what might cause ‘inflation’. That’s where inflation expectations theory comes in. For lack of a better reason, the ‘residual’ is that it’s inflation expectations that cause changes in the price level. And not anything else, which are relative value stories. And they operate through two channels- workers demanding higher wages and people accelerating purchases. Hence the fixation on wages as the cause of inflation, and using ‘monetary policy’ to accelerate purchases, etc.

Regardless of the ‘internal merits’ of this conclusion, it’s all obviated by the fact that the currency itself is a simple public monopoly, rendering govt price setter. Note the introduction of monetary taxation, the basis of the currency, is coercive, and obviously not a ‘market expense’ for the taxpayer, and therefore the idea of ‘neutrality’ of the currency in entirely inapplicable. In fact, since the $ to pay taxes and buy govt secs, assuming no counterfeiting, ultimately come only from the govt of issue, (as they say in the Fed, you can’t have a reserve drain without a prior reserve add), the price level is entirely a function of prices paid by the govt when it spends and/or collateral demanded when it lends. Said another way, since we need the govt’s $ to pay taxes, the govt is, whether it knows it or not, setting ‘terms of exchange’ when it buys our goods and service.

Note too that monopolists set two prices, the value of their product/price level as just described above, and what’s called the ‘own rate’/how it exchanges for itself, which for the currency is the interest rate, which is set by a vote at the CB.

The govt/mainstream, of course, has no concept of all this, as inflation expectations theory remains ‘well anchored.’ ;)

In fact, when confronted, argues aggressively that I’m wrong (story of my life- remember, they laughed at the Yugo…)

What they have done is set up a reasonably deflationary purchasing program, of buying from the lowest bidder in competition, and managed to keep federal wages/compensation a bit ‘behind the curve’ as well, partially indexed to their consumer price index, etc.

And consequently, govt has defacto advocated pricing power to the active monopolist, the Saudis, which explains why changes in crude prices and ‘inflation’ track as closely as they do.

Therefore, the way I see it is the latest Saudi price cuts are revaluing the dollar (along with other currencies with similar policies, which is most all of them) higher. A dollar now buys more oil and, to the extend we have a market economy that reflects relative value, more of most everything else. That is, it’s a powerful ‘deflationary bias’ (consequently rewarding ‘savers’ at the expense of ‘borrowers’) without necessarily increasing real output.

In fact, real output could go lower due to an induced credit contraction, next up.

Banking

Deflation is highly problematic for banks. Here’s what happened at my bank to illustrate the principle:

We had a $6.5 million loan on the books with $11 million of collateral backing it. Then, in 2009 the properties were appraised at only $8 million. This caused the regulators to ‘classify’ the loan and give it only $4 million in value for purposes of calculating our assets and capital. So our stated capital was reduced by $2.5 million, even though the borrower was still paying and there was more than enough market value left to cover us.

So the point is, even with conservative loan to value ratios of the collateral, a drop in collateral values nonetheless reduces a banks reported capital. In theory, that means if the banking system needs an 8% capital ratio, and is comfortably ahead at 10%, with conservative loan to value ratios, a 10% across the board drop in assets prices introduces the next ‘financial crisis’. It’s only a crisis because the regulators make it one, of course, but that’s today’s reality.

Additionally, making new loans in a deflationary environment is highly problematic in general for similar reasons. And the reduction in ‘borrowing to spend’ on energy and related capital goods and services is also a strong contractionary bias.

UPDATE: Saudi Arabia cuts all oil prices to U.S., Asia – Bloomberg (OIL)

Dec 4 — Saudi Arabia cuts all oil prices to U.S. and Asia, according to Bloomberg headlines.

UPDATE: Reports have the message issued by Saudi Aramco — the state-owned oil and gas giant — now recalled.

personal income and consumption charts and comments, and a word on oil

This is after tax personal income not adjusted for inflation. Note that there was anticipation of an acceleration from the first quarter, but now it looks like the growth has slowed and rolled over:

11-28-1

Here you can see how it was growing steadily, then shifted down when my payroll tax holiday expired, sort of resumed growing at the same rate, and now may be falling off, even with what the mainstream call ‘solid’ payroll growth:

11-28-2
Likewise, there’s been a lid on the growth personal consumption expenditures where the growth rate dipped for the cold winter, recovered, and then fell off some:

11-28-3

11-28-4

Adjusted for inflation/cpi the pattern is the same:

11-28-5

Oil- Not all that much to it.

The Saudis remain price setter as a simple point of logic.

No telling what their price target may be at any time, but they simply set price for their refiners and let them buy all they want at that price. And no one else has the excess capacity to do that.

Possible motives?

Put high priced producers out of business with $trillions of losses to make sure that when the subsequently raise prices to 150(?) new investment in high priced crude will then be considered to risky for anyone to finance?

And/or it’s not illegal for insiders to have gotten short for their personal accounts prior to the price cuts and subsequently covering prior to increasing prices, functionally transferring a bit of wealth from the state to private accounts?

Ramifications for the US:

US consumers helped a bit- about $100 billion/year last I heard?

Capex gets hurt by at least that much?

Trillions in value lost from loans and investments going south?

Thousands of high paying jobs lost in North Dakota, etc. due to reduced capex?

(EU not so much as they don’t invest nearly as much in high priced energy exploration/production?)

Canada, Mexico, Venezuela, Australia etc. economies and related securities/investments toast?

etc.

euro update, q3 gdp update

Seems trade flows and ‘inflation’ continue make the euro fundamentally stronger even as portfolios shifting due to ECB rhetoric keep it under pressure. Should the shifting run its course, I would not be surprised dramatic appreciation.

q3-1

q3-2

New figures released by the Federal Reserve Bank of New York on Tuesday show that mortgage lending is running at its lowest level in 13 years, with 2014 on pace to be the weakest for new loans since 2000.

Q3 GDP revised up a bit, year over year still low and down a bit, profits low and down a bit, and there is growing evidence the suspect sources of growth- govt and exports and inventories- that added about 2% are reversing:

GDP
q3-3

q3-4
Corporate Profits
q3-5

q3-6

q3-7

q3-8

Consumer Confidence
q3-9

q3-10

Richmond Fed Manufacturing Index
q3-11

Personal Income and Outlays, Employment Cost Index, Chicago PMI

The stock market is happy on the false assumption that bad news means lower rates from the Fed which is good for profits, but that’s another story…

Income and spending weak, and prices soft as the Fed continues to fail on at least that part of its mandate:

Personal Income and Outlays
pi-pce
Highlights
Personal income continues a modest uptrend but spending slipped on volatile auto sales and lower gasoline prices. Personal income advanced 0.2 percent in September, following a 0.3 percent gain in August. Analysts projected a 0.3 percent gain for September. The wages & salaries component increased 0.2 percent, following a 0.5 percent boost the prior month. Averaging the wage gains leaves consumer basic income moderately healthy.

Analysts botched their forecast for spending for September-and for no apparent reason. Personal spending declined 0.2 percent after jumping 0.5 percent in August. The latest figure came in below market expectations for a 0.1 percent rise. Weakness was in the durables component which fell 2.0 percent after a 2.1 percent jump in August, reflecting swings in auto sales. Lower gasoline prices pulled down on nondurables. Nondurables spending declined 0.3 percent after falling 0.4 percent in August. Services firmed 0.2 percent, following a 0.5 percent spike in August.

PCE inflation remains soft. The September figure matched expectations for a 0.1 percent increase and followed a dip of 0.1 percent in August. Core PCE inflation rose 0.1 percent in September, following a gain of 0.1 percent in August and equaling expectations.

On a year-ago basis, headline PCE inflation held steady at 1.4 percent in September. Year-ago core inflation was 1.5 percent in both September and August. The Fed doves will not be in a rush to boost policy rates early next year.

rpce

Note how after tax cpi adjusted income- purchasing power- keeps ratcheting down:
rdi

And wonder why you don’t hear much about this?
pce-hc

Employment Cost Index
eci

Working its way higher, but still very low, particularly in light of productivity increases. And with profit margins at a new record high of 13%, almost double the norm, there’s
plenty of room for wages to increase before pressuring prices.
eci-graph

eci-total-comp

eci-private-construction

eci-public eci-manueci-service
Manufacturing chugging along:ism