mtg purchase apps, China comment

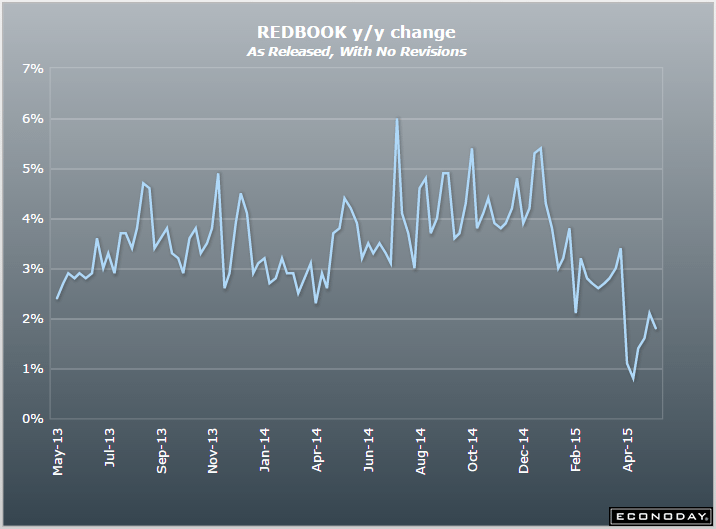
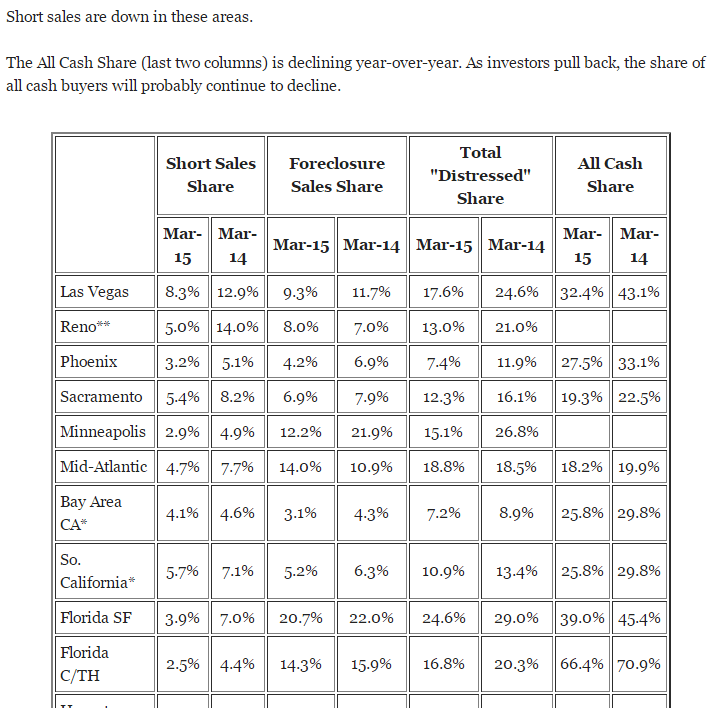
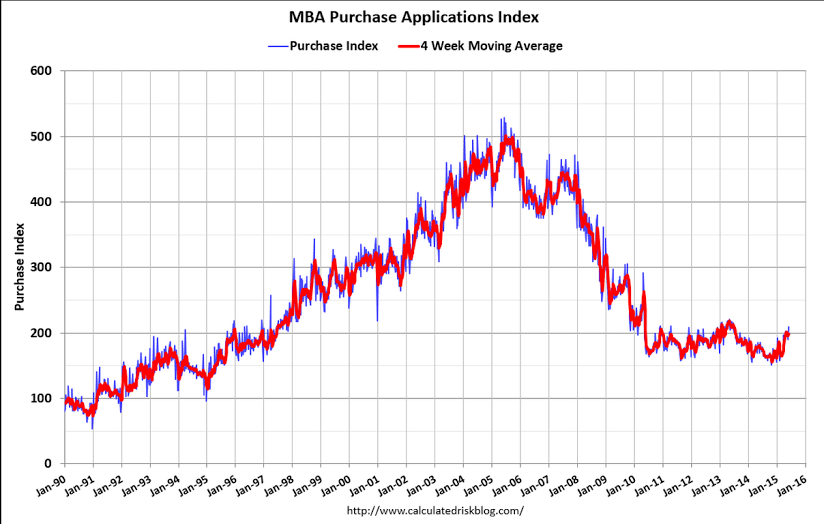
Mortgage purchase apps were up 10% for the week, leaving them about 15% higher than last year, which is where they’ve been for a while. However, cash sales are down sharply, so it seems that buyers have shifted from all cash to borrowing, leaving the total purchases about the same:

Weekly mortgage applications jump as rates surge

By Diana Olick

June 10 (CNBC) — Interest rates’ sharp jump to their highest level this year caused a sudden surge in mortgage applications. While that may seem counter-intuitive, there’s a reason: Fear that rates will move even higher.

Total mortgage application volume jumped 8.4 percent on a seasonally adjusted basis for the week ending June 5th from the previous week, according to the Mortgage Bankers Association (MBA). The previous week included an adjustment for the Memorial Day holiday.

“Mortgage application volume rebounded strongly…indicating that the holiday had a larger impact on business activity than originally assumed,” said Mike Fratantoni, MBA’s Chief Economist.

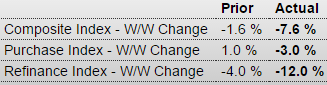
Refinance volume increased 7 percent week-to-week, and applications to purchase a home jumped 10 percent, both seasonally adjusted. Purchase volume is now 15 percent higher than the same week one year ago, but refinance volume is off nearly 5 percent. The weekly move higher in refinances was likely due to the holiday skewing the trend. Refinances are still lower than they were two weeks ago. This all comes as rates continue to climb.

The average contract interest rate for 30-year fixed-rate mortgages with conforming loan balances ($417,000 or less) increased to 4.17 percent, its highest level since November 2014, from 4.02 percent, with points increasing to 0.38 from 0.33 (including the origination fee) for 80 percent loan-to-value ratio loans, according to the MBA

While higher rates make home buying more expensive, sharp moves higher often have the immediate effect of getting potential buyers off the fence, before chilling the overall market in the longer term. That is especially true now, as the Federal Reserve is widely expected to increase interest rates in addition to what is happening in the U.S. bond market already.
er-6-10-1

China:

Confirms that their western educated economists’ believe ‘monetary policy’/rate cuts etc. work to increase output and employment, even though I think they are entirely wrong and backwards:

China’s economy to pick up in H2: Central bank economists

June 10 (CNBC) — Economists at China’s central bank have sharply lowered their 2015 inflation forecast even as they predicted that stabilising Chinese home prices and firmer foreign demand will drive a pick-up in the world’s second-biggest economy in the next six months.

In a report posted on the central bank’s website on Tuesday, economists at the People’s Bank of China (PBOC) said they had cut their 2015 inflation forecast for China to 1.4 percent, from an initial 2.2 percent.

The report, which said the estimates represented the view of the analysts and not that of the PBOC, contained other downward revisions to forecasts that underscored headwinds being faced by the slowing Chinese economy.

Yet, the economists were cautiously optimistic on the outlook.

The property market is “starting to stabilise” and the world economy should show further signs of a recovery in coming months, said the economists who were led by Ma Jun, the chief economist at the central bank.

Looser monetary policy conditions as a result of China cutting interest rates thrice since November were also expected to help shore up growth in coming months, the economists said.

“We estimate that our country’s gross domestic product growth in the second-half of the year will be higher than in the first-half,” they said, noting that it takes six to nine months for China’s economy to feel the effects of monetary policy easing.

The report showed the economists had shaved their forecast for China’s economic growth to 7.0 percent for 2015, from 7.1 percent previously.

The forecast for producer prices was also sharply revised to indicate deepening deflationary pressure. The producer price index is now expected to fall 4.2 percent for 2015, from an estimated decline of 0.4 percent previously.

mtg purch apps, ADP, Trade, ISM, Atlanta Fed

Another setback, still up some year over year but all cash purchases are down quite a bit as well:

MBA Mortgage Applications
er-6-3-6
Highlights
Application activity is sputtering with MBA’s composite index down a very steep 7.6 percent in the May 29 week for a 6th straight decline and the steepest decline since February. Purchase applications fell 3 percent in the week but are still up a respectable 14 percent year-on-year. Refinancing applications fell 12.0 percent in the week to their lowest level since May last year. Refinancing demand has been especially hurt by this year’s rise in interest rates though rates were down in the latest week, with the average 30-year mortgage for conforming loans ($417,000 or less) down 5 basis points to 4.02 percent.

Note the chart below, which doesn’t show much of a recovery from Q1:

ADP Employment Report
er-6-3-7
Highlights
ADP estimates that private payrolls rose a moderate 201,000 in May which is right at the Econoday consensus for 200,000. For comparison, the consensus for private payroll growth in Friday’s employment report is a bit higher, at 215,000 with the low estimate at 185,000. ADP sometimes does and sometimes does not correctly anticipate the employment report having last month signaled weakness in what turned out to be a respectable report for April.
er-6-3-8

The chart shows how non petroleum imports continued to rise sharply, and the May auto sales report which includes imports looks to continue to support that up trend. Petroleum imports show a lot of month to month volatility so they could very well be up substantially for the rest of the quarter, as prices were higher and US production is being forecast to decline due to the sharp drop off in drilling. So look for the US trade gap to widen, partly because of the dollar strength and partly because of fading exports and rising oil imports due to domestic production declines. The trade flows are now working against the dollar and in favor of the euro, which is being supported by a large and growing trade surplus.

International Trade
er-6-3-9
Highlights
Second-quarter GDP looks to be getting a lift by a decline in imports, at least it will in April when the trade gap eased to $40.9 billion. The gap is on the low side of Econoday expectations and compares with March’s outsized revised gap of $50.6 billion which was distorted by a spike in imports tied to the resolution of the first-quarter port strike. Imports fell 3.3 percent in April to $230.8 billion at the same time that exports, in another positive for GDP, showed some life, up 1.0 percent to $189.9 billion.

Consumer goods show the strongest improvement on the import side, down $4.9 billion in the month and reflecting a $1.3 billion decline in cell phones as well as declines for apparel and furniture. Imports of capital goods, industrial supplies, and autos also fell. Imports of petroleum products rose $0.2 million to $15.4 billion, more than offset by a $0.9 billion rise in petroleum exports to $8.6 billion.

Strength in exports also includes capital goods, up $2.1 billion with civilian aircraft representing nearly half the total. Exports of industrial supplies and autos were also higher.

Another plus in the report is another gain for the nation’s services where the trade surplus rose to $19.8 billion from $19.4 billion in March.

Country data show a sharp easing in the gap with China, to $26.5 billion vs March’s $31.2 billion, and improvement with Mexico, to a gap of $4.4 billion vs $5.5 billion in March. The gap with Europe widened slightly to $13.3 from $12.7 billion while the gap with Japan was unchanged at $7.1 billion.

The decline in imports was of course expected given the special circumstances in March, but the gain for exports is very positive suggesting an easing in dollar-related troubles and perhaps pointing to some life in foreign demand. Today’s report includes annual revisions which increased deficits for 2013 and 2014.
er-6-3-10
er-6-3-11

Again, the chart shows it’s not as strong as it was in q1, which means it’s contributing less growth in q2 than it did in q1, and it’s also no where near the strength of q2 2014:

ISM Non-Mfg Index
er-6-3-12

Highlights
The ISM non-manufacturing index for May, at 55.7, came in solid but at the low end of Econoday expectations to indicate the slowest rate of monthly growth since April last year. Key readings all slowed slightly but are still very constructive with new orders at 57.9 and business activity at 59.5. Employment also slowed, down 1.4 points to 55.3 which is still a respectable rate.

Other details include a jump in exports, up 6.5 points to 55.0 in a reading that underscores this morning’s big service-sector surplus in the April trade report. Supplier delivery times, which had been slowing all year, were unchanged in May suggesting, also like this morning’s trade report, that supply-chain distortions tied to the first-quarter port strike have unwound. Input prices, likely tied to higher fuel costs, show some pressure, up 5.8 points to a 55.9 reading that’s the highest since August last year.

A look at individual industries shows special strength for arts/entertainment/recreation and management & support services, the latter one of the strongest export industries for the nation. And in the latest hint of strength in the housing sector, both real estate and construction show strength. The only one of 18 industries to contract in the month was, once again, mining which is being hurt by low commodity prices.

The dip in employment won’t be boosting expectations for Friday’s employment report and the hawks at the Fed are certain to take note of the rise in prices. But in sum, this report is mostly positive and in line with the PMI services index released earlier this morning, both pointing to modest deceleration in what is otherwise the economy’s central strength – the service sector.
er-6-3-13

The Atlanta Fed GDP forecast for Q2 is up to 1.1% annualized, which would be a shockingly low follow up to Q1’s -.7. And, as above, there’s a good chance May’s trade number goes the other way, sending the GDP forecast back down:
er-6-3-14

IMF re France, truck tonnage, China PMI, Japan PMI

More of same pro cyclical pressure:

France slammed by IMF for record-high spending

By Holly Ellyatt

May 20 (CNBC) — The International Monetary Fund (IMF) has warned France that it must reduce government spending and debt levels, as well as tackling its sticky unemployment rate.

The IMF said in its latest economic outlook on France, published on Tuesday, that although it sees a “solid short-term recovery (in France), structural rigidities continue to weigh on medium-term prospects.”

“Continued efforts are needed to tackle France’s fundamental economic problems: high structural unemployment, low potential growth, and record-high public spending,” the group added.

Indeed, the IMF noted that high and rising government spending has been “at the heart” of France’s fiscal problems for decades.

Trucking Tonnage Index Slumps in April 2015. Lowest Level In One Year.

Econintersect: The American Trucking Associations’ (ATA) trucking index declined 3% following an downwardly revised improvement of 0.4% in March. From ATA Chief Economist Bob Costello:

Still headed south. Maybe just a few more rate cuts…

New export orders declined means exporters putting more pressure on the govt to buy its euro back…

:(

China : PMI Flash Mfg Index
er-5-21-1
Highlights
May’s flash manufacturing PMI remained mired in contraction with a reading of 49.1 which was an improvement over April’s reading of 48.9. The output index which was at the breakeven point between growth and contraction in April, skidded to a reading of 48.4. New orders decreased at a slower rate while new export orders declined after increasing in April. Five sub-indexes decreased but at a slower rate. These included employment, output and input prices, backlogs of work and stocks of purchases.

A bit of hope here as weak currency/lower relative wages drives a few export orders:

Japan : PMI Manufacturing Index Flash
er-5-22-2
Highlights
Japanese manufacturing returned to growth in May with its best performance since February. Japan’s flash May manufacturing PMI reading was 50.9, up a full point from the April final of 49.9. A reading above 50 signifies growth. The flash output index climbed to 51.7 from 49.3 in April. Along with these readings, new orders increased, changing direction. Both export orders and employment increased at a faster pace in May. However, backlogs decreased at a faster rate. Both the stocks of purchases and finished goods changed direction and decreased. The readings, if confirmed when the final PMI is released for May is a favorable sign that points to stabilization in the economy.

Atlanta Fed, LA port traffic, EU trade surplus, German ZEW, housing starts, redbook retail sales

No positive change here yet:
er-5-19-1

This was supposed to rebound:

LA area Port Traffic Decreased in April

By Bill McBride

May 18 (Calculated Risk) — Note: LA area ports were impacted by labor negotiations that were settled on February 21st. Port traffic surged in March as the waiting ships were unloaded (the trade deficit increased in March too), and port traffic declined in April.

Container traffic gives us an idea about the volume of goods being exported and imported – and usually some hints about the trade report since LA area ports handle about 40% of the nation’s container port traffic.

The following graphs are for inbound and outbound traffic at the ports of Los Angeles and Long Beach in TEUs (TEUs: 20-foot equivalent units or 20-foot-long cargo container).

To remove the strong seasonal component for inbound traffic, the first graph shows the rolling 12 month average.

On a rolling 12 month basis, inbound traffic was down 0.2% compared to the rolling 12 months ending in March. Outbound traffic was down 1.1% compared to 12 months ending in March.

Inbound traffic had been increasing, and outbound traffic had been moving down recently. The recent downturn in exports might be due to the strong dollar and weakness in China.

The 2nd graph is the monthly data (with a strong seasonal pattern for imports).

LA Area Port TrafficUsually imports peak in the July to October period as retailers import goods for the Christmas holiday, and then decline sharply and bottom in February or March (depending on the timing of the Chinese New Year).

Imports were down 2% year-over-year in April; exports were down 11% year-over-year.

The labor issues are now resolved – the ships have disappeared from the outer harbor – and the distortions from the labor issues are behind us. This data suggests a smaller trade deficit in April.
er-5-19-2
er-5-19-3

Strong number.

Currencies with trade surplus don’t ordinarily go down…
;)

European Union : Merchandise Trade
er-5-19-4

A bit on the weak side, to say the least, and even with negative rates and QE…
;)

Germany : ZEW Survey
er-5-19-5

Solid improvement here. First good number in quite a while.
The 5 month average is almost back to where it was in November…

United States : Housing Starts
er-5-19-6
Highlights
There were hardly any indications before today, but the spring housing surge is here. Today’s housing starts & permits report is one of the very strongest on record with starts soaring 20.2 percent in April to a much higher-than-expected annual rate of 1.135 million with permits up 10.1 percent to a much higher-than-expected 1.143 million. Both readings easily top the Econoday high-end forecast of 1.120 million for each. The gain for starts is the best in 7-1/2 years with the gain in permits the best in 7 years. Today’s report is an eye-opener and will re-establish expectations for building strength in housing, a sector held down badly in the first quarter by severe weather.
er-5-19-7
er-5-19-8
er-5-19-9

Half way through May and this one isn’t bouncing back:

United States : Redbook
er-5-19-10
er-5-19-11

China, Bunds, and Fed’s labor market index

As if rate cuts will help:

China cuts interest rates for third time since Nov as economy sputters

May 10 (Reuters) — China’s central bank cut its benchmark lending rate by 25 basis points to 5.1 percent on Sunday, its third reduction since November, as economic growth cools to levels not seen since the global financial crisis.

The People’s Bank of China (PBOC) also reduced one-year benchmark deposit rates by 25 basis points to 2.25 percent, it said in a statement on its website, adding that the reductions would be effective on May 11.

This is a ‘blow up’? All the way up to half a percent for a 10 year bund…

Markets blew up the bunds and helped Greece

er-5-11-1

No one still quite knows what this is:

United States : Labor Market Conditions Index
er-5-11-2
Highlights
The labor market is very soft based on the Fed’s labor market conditions index which is in negative ground for a second straight month, at minus 1.9 in April vs a downward revised minus 1.8 in March. These are the first negative readings in 3 years and follow last week’s April employment report which was no better than mixed. Based on this report, which takes a broad view of the labor market, the Fed will be in no hurry to raise rates. But two reports later this week have definitely been signaling strength in the labor market: JOLTS on Tuesday and jobless claims on Thursday.

china pmi, ADP, productivity

Still slipping in Q2

China : PMI Composite
er-5-6-1

Highlights
HSBC China Composite PMI, which covers both manufacturing and services, indicated an expansion of Chinese business activity in April but at a weaker pace. Activity growth slowed to a three month low with a reading of 51.3, down from 51.8 in March. The slower expansion of total business activity was largely driven by a stagnation of manufacturing output in April, following three months of growth.

Another weak forecast for Friday’s employment report:

ADP Employment Report
er-5-6-2

Highlights
ADP correctly signaled a weak employment report for March and it’s signaling another weak report for April, at only 169,000 for its private payroll gauge which is far under the Econoday concensus for 205,000 and just under the low estimate for 170,000. ADP’s estimate for March is now revised 14,000 lower to 175,000. For comparison, the Econoday consensus for private payroll growth in Friday’s employment report is 223,000 with the low estimate at 170,000. ADP doesn’t always move the markets but it may today, raising talk of another soft employment report on Friday

This tells me business has more employees than it needs and most likely will adjust accordingly:

Productivity and Costs
er-5-6-3

Lumber prices, UK pmi, West Coast Port Traffic, trade, PMI and ISM services index

From Calculated Risk:
Right now Random Lengths prices are down about 11% from a year ago, and CME futures are down around 25% year-over-year.
er-5-5-1

Stll positive but more recent numbers coming in worse than expected:

Great Britain : PMI Construction
er-5-5-2
Highlights
Business activity in UK construction slowed unexpectedly quickly last month. At 54.2 the sector PMI was 3.6 points short of its March outturn and at its weakest level since June 2013. However, the April print was still well above the 50 growth mark and its decline was probably at least in part due to supply shortages.
er-5-5-3
Note: West Coast port traffic increased sharply in March following the resolution of the labor issue in February. The workers were catching up with all the ships anchored in the harbor (now gone).

Both imports and exports rebounded in March, but imports rebounded more – and were up 36% year-over-year – whereas exports were down 20% year-over-year.

This suggests more imports from Asia in March, and also suggests the trade deficit was significantly higher in March than in February.

Well below expectations, hearing Q1 being revised down .5%, as Americans spend their gas savings on other imports from China and Japan. ;) And the growing US trade deficit/EU current account surplus fundamentally supports the euro vs the dollar.

United States : International Trade
er-5-5-4
Highlights
First-quarter GDP, barely above zero at plus 0.2 percent, may move into the negative column on revision following a much higher-than-expected March trade deficit of $51.4 billion, the largest since October 2008. The unwinding of the port strike on the West Coast, which was resolved mid-month March, played a major role in the data especially evident in imports which surged $17.1 billion in the month as backlogs at the ports were cleared. Imports of consumer goods, especially cell phones, were especially heavy. Exports, led by aircraft, also rose but only $1.6 billion. The total goods gap in the month was $70.6 billion which is the highest since August 2008.

The gap in petroleum trade, at $7.7 billion vs February’s $8.2 billion, wasn’t a major factor in the March data as the drop in prices was offset by a rise in volumes. By country, the gap with China widened to $31.2 vs $22.5 billion in February and to $7.1 billion vs $4.2 billion for Japan. The OPEC gap widened slightly to $1.2 billion vs $0.7 billion.
er-5-5-5
Still blaming the Easter Bunny for this:
er-5-5-6

United States : PMI Services Index
er-5-5-7

Uptick here so still showing growth, first glimmer of hope for a positive Q2:

United States : ISM Non-Mfg Index
er-5-5-8
er-5-5-9

Atlanta Fed, Japan and China, rail car traffic, Saudi output

Currently a .9 forecast for Q2, well below other estimates again:
er-5-1-1
More global deceleration:

Japan : Household Spending
er-5-1-2
Highlights
Household spending declined for a twelfth straight month in March. On the year, spending was down 10.6 percent after sliding 2.9 percent in January. Consumption has been weak since last April when Japan raised its consumption tax by 3 percentage points to 8 percent. Spending in the most of the subcategories declined. The biggest drops were in furniture & household utensils (down 39.6 percent) and transportation (down 16.1 percent). Only education advanced, this time by 3.1 percent on the year.

Japan : PMI Manufacturing Index
er-5-1-3
Highlights
April final manufacturing PMI slipped the below the breakeven 50 level with a reading of 49.9. The data indicated worsening operating conditions in the Japanese manufacturing sector. Manufacturing production contracted for the first time since July 2014 in April. This was underpinned by a further decline in new orders, with the rate of decline the fastest since when the higher sales tax increase was implemented in April last year. Panelists reported a fall in demand from both domestic and international clients and challenging economic conditions as the main factors behind the decline in new work.

Production contracted for the first time since July 2014, underpinned by a further decline in new orders. Meanwhile, growth in new export orders slowed to the weakest in the current 10-month sequence of expansion. On the price front, input price inflation eased to the slowest in over two years.

At 49.9 in April, the headline PMI signaled a fractional deterioration in operating conditions in the Japanese manufacturing sector for the first time in almost a year. Furthermore, the headline PMI has only posted below the 50.0 no-change mark three times in the past two years.

China : CFLP Manufacturing PMI
er-5-1-4
Highlights
April CFLP manufacturing PMI inched up to a reading of 50.1 — barely over the 50-point level that separates growth from contraction. The result was better than expectations, with economists predicting that the reading would be a breakeven 50. The March reading was also 50.1.

Four of ten sectors recorded readings over the 50 breakeven level. They were production (52.6), new orders (50.2), supplier delivery times (50.4) and business expectations (59.5). However, new export orders, finished goods inventories, imports, input prices, raw materials inventories and employment continued to contract.

China’s economy, which has enjoyed some of the fastest growth rates in the world in the past two decades, is now slowing and policymakers recently said it will target economic growth of “around 7 percent” this year, the slowest expansion in a quarter century.

Rail Week Ending 25 April 2015: Another Bad Data Week

Econintersect: Week 16 of 2015 shows same week total rail traffic (from same week one year ago) declined according to the Association of American Railroads (AAR) traffic data. Intermodal traffic improved, which accounts for half of movements – but weekly railcar counts remain in contraction.

Saudi output remained reasonably steady indicating little change in net demand at their posted prices:
sg2015050134525

PMI’s, Housing sales data, Yellon on oil

A few more PMI’s showing weakness:

Japan : PMI Manufacturing Index Flash
jn-apr-pmi

Highlights
Manufacturing weakened for a third consecutive month. The flash April manufacturing PMI reading was 49.7, down from 50.3 in March. A reading below 50 indicates contraction. The output index also slipped below 50 to a reading of 49.7, down from 52 the month before. New orders decreased at a faster rate as did the quantity of purchases. New export orders increased, but at a slower pace as did input prices. Employment changed direction and increased. Output prices increased.

China : PMI Flash Mfg Index
ch-apr-pmi
Highlights
April’s flash manufacturing index reading was a twelve month low of 49.2, down from the March final of 49.6. The output index remained above the 50 breakeven point with a reading of 50.4, down from 51.3 in March.

European Union : PMI Composite FLASH
eu-apr-pmi

This article shows the drops in ‘all cash’ purchases’ which must be replaced with mortgages for sales to be sustained. That means it takes an increase in the mortgage funding just to sustain current levels of sales.

It also shows the decline in short sales and foreclosure sales that tend to be the lowest priced sales, depressing the average and median prices reported. That means that even if the sales prices of the remaining homes sold stay the same the median and average prices reported will increase:
cash-buyers

This is a Dec 17 video of the Fed Chairman expressing the Fed’s view that the fall in oil prices is expected to be a net positive for the economy. Note that there is no mention whatsoever of the ‘identity’ of income, meaning that for every ‘consumer’ saving $1 another ‘consumer’ has lost that $ of income. This conspicuously absent income loss is in addition to the capex reductions she discusses, and includes income lost by the foreign sector due to the lower price of oil which can translate into reduced US exports. So it still looks to me like the oil price cut was an unambiguous negative for the US economy, as now evidenced by most all of the subsequent economic releases, with the capex reductions both domestically and globally more than offsetting any gains due to the US being a net importer of oil.

“From the standpoint of the U.S. and U.S. outlook, the decline we’ve seen in oil prices is likely to be, on net, a positive,” said Yellen at a press conference on Wednesday. “It’s good for families, for households. It’s putting more money in their pockets,” she said. Thanks to the oil price decline, drivers in at least 13 states around the country can now find gas forcheaper than $2 a gallon. Cheaper energy also translates to lower expenses for many U.S. businesses, especially ones in the transportation industry like airlines.

No mention whatsoever of those seeing an equal reduction of income.

Yellen acknowledged that the plunge in oil prices may cause cutbacks in the drilling industry, which is likely to slow capital spending for wells that aren’t profitable in the current environment. However, the Fed chief noted that despite the shale boom, the U.S. is still a net importer of oil. That means cheaper prices are good for the overall economy.

Only if that net savings exceeds the cutbacks in capex and the reduction of US exports, which the subsequent data says it has not.

Housing starts, Italy Merchandise Trade, UK opinion chart, ECB euro policy musings

Moving up some but still relatively low, but as previously discussed,
this is about people losing jobs, not new hires:

Jobless Claims
er-4-16-1
er-4-16-2

And yet another lower than expected release:

Housing Starts
er-4-16-3
er-4-16-4
sg2015041635556

Just anecdotal evidence of what happens as the euro is pushed down by CB portfolio selling to ‘equate supply and demand’ etc.

Italy : Merchandise Trade
er-4-16-5
Highlights
The seasonally adjusted merchandise trade balance was in a sizeable E4.6 billion surplus in February, up from an unrevised E3.9 billion excess in January.

The headline gain was attributable to a tidy bounce in exports which, up 2.5 percent on the month, essentially reversed their January decline. Capital goods saw a 7.6 percent rise while consumer goods were up 0.2 percent and energy 2.7 percent. Intermediates fell 0.5 percent. Overall exports were 3.7 percent higher than in February 2014, a marked acceleration versus their minus 4.2 percent January rate.

Low odds of the UK going for fiscal expansion:
er-4-16-6
Not to forget every Fed member recognizes their role in ‘managing expectations’ as they all believe that the economic performance has a large psychological component. That is, if people were led to believe things were getting worse that would cause a downturn.

Beige Book: U.S. Economy Powers Through Headwinds

By Jefferey Sparshott

April 15 (WSJ) — The U.S. economy continued to expand across most of the country in February and March, though a strong dollar, falling oil prices and harsh winter weather slowed activity in some sectors, according to the Federal Reserve’s latest survey of regional economic conditions. The Fed found modest or moderate growth in eight of its 12 districts. Elsewhere, the pace of economic activity was described as steady, slight or continuing to expand. Minutes of the March meeting showed “several” officials thought June would be the right time, though others said it would be better to wait.

Possible narrative?:
China told Draghi that if the ECB not to go to negative rates and QE or they would retaliate by selling their euro reserves. So Draghi did exactly that to induce a ‘devaluation’ to support EU net exports. The ploy worked, for as long as it lasts. When the CB reserve liquidation fades, the euro will appreciate until the current account surplus turns to a deficit, reversing prior gains in output and employment, and dashing any hoped of growth and employment:

ECB’s Mario Draghi Says Stimulus Is Working

By Brian Blackstone and Todd Buell

April 15 (WSJ) — ECB President Mario Draghi said there is “clear evidence the monetary policy measures we put in place have been effective.” Mr. Draghi said, “The euro area economy has gained further momentum since the end of 2014. We expect the economic recovery to broaden and strengthen substantially.”

German GDP forecasts hiked on weak euro