existing home sales, Greece and China comments

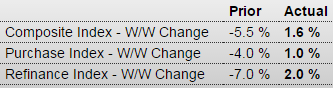
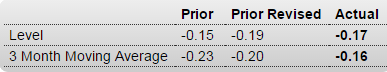
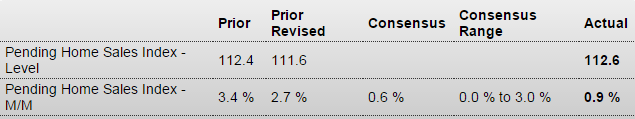
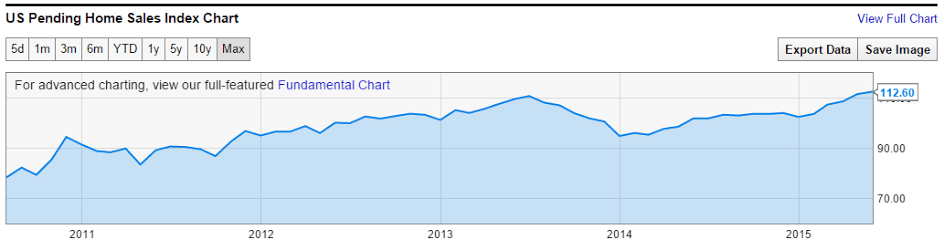
So after cheering the big jump last month to 112.4, it gets revised down to only 111.6, so the lower than expected print of 112.6 vs 113 expected is now hailed as a larger than expected increase from last month, as the shameless cheer leading continues:

United States : Pending Home Sales Index
er-6-29-1
Highlights
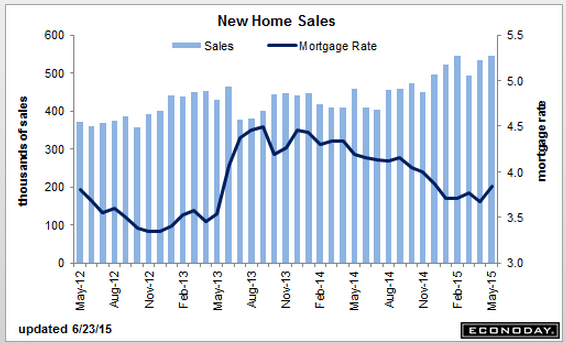
Solid momentum is building inside the housing market based on the ongoing run of very strong data including today’s pending home sales index which is up a better-than-expected 0.9 percent in the May report which tops Econoday expectations for a 0.6 percent gain. The index level, at 112.6, is as high as it’s been since the bubble days of 2006.

Sales have been very strong in the West where pending sales rose 2.2 percent in May for a 13.0 percent year-on-year gain. Pending sales in the South, up 10.6 percent year-on-year, have also been strong though the region did dip 0.8 percent in the latest month. Sales also dipped in the Midwest, down 0.6 percent for a year-on-year plus 7.8 percent, but they rose sharply in the Northeast where housing after a heavy winter is bouncing back strongly, up 6.3 percent in this report for a year-on-year again of 10.6 percent.

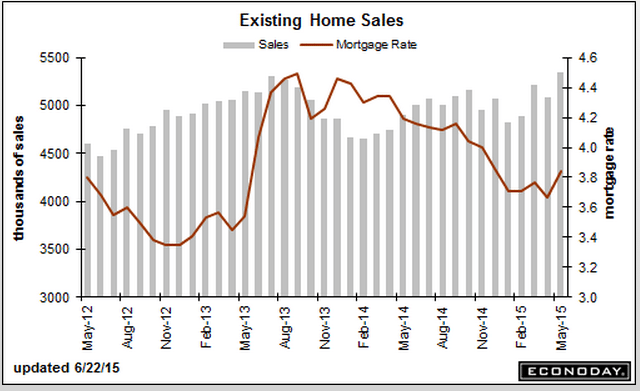
Today’s report points to further strength for the existing home sales report which surged in data posted last week. Housing is getting a boost from the strong jobs market together perhaps with the prospect of rising mortgage rates which may be pushing buyers into the market. Watch for Case-Shiller home price data on tomorrow’s calendar.

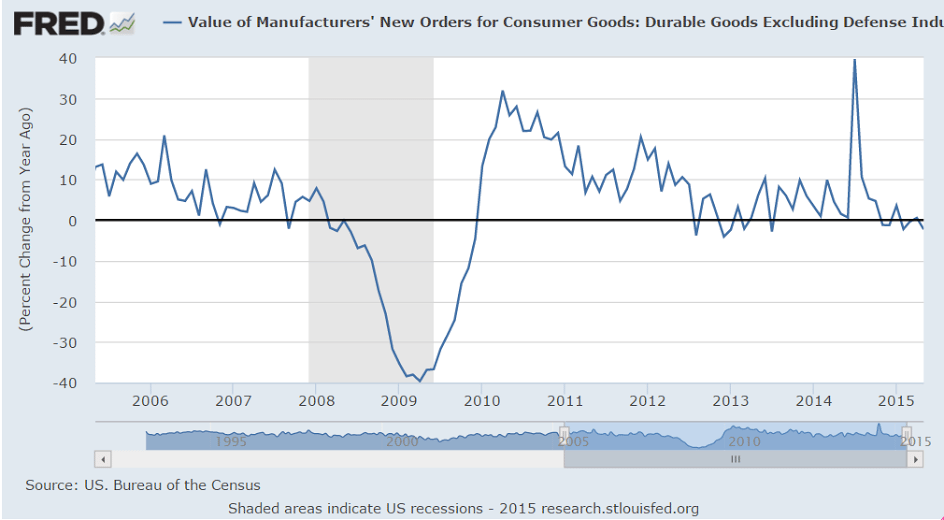
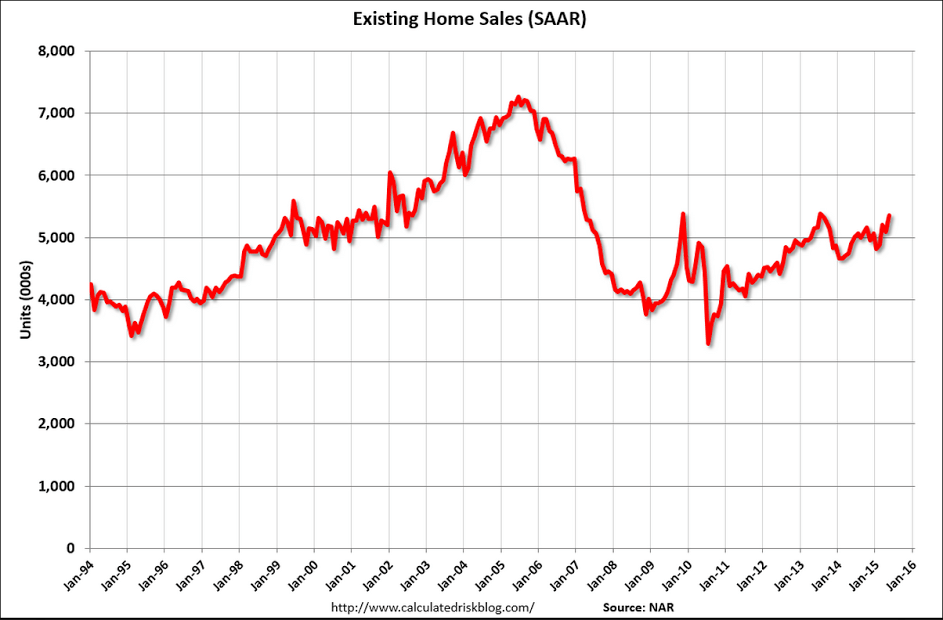
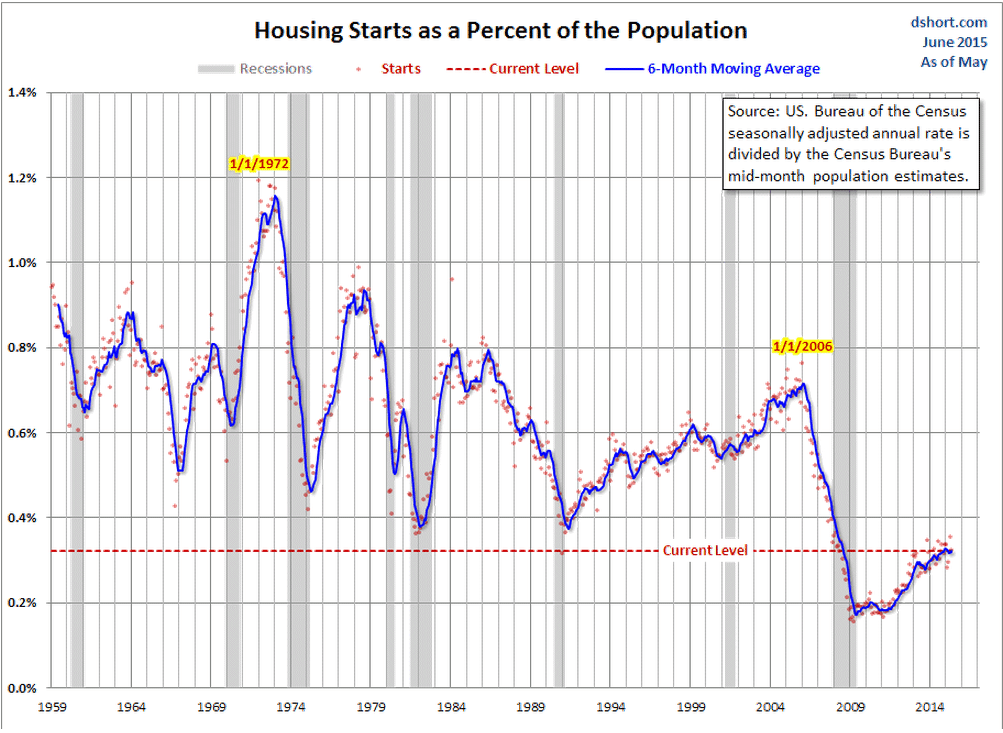
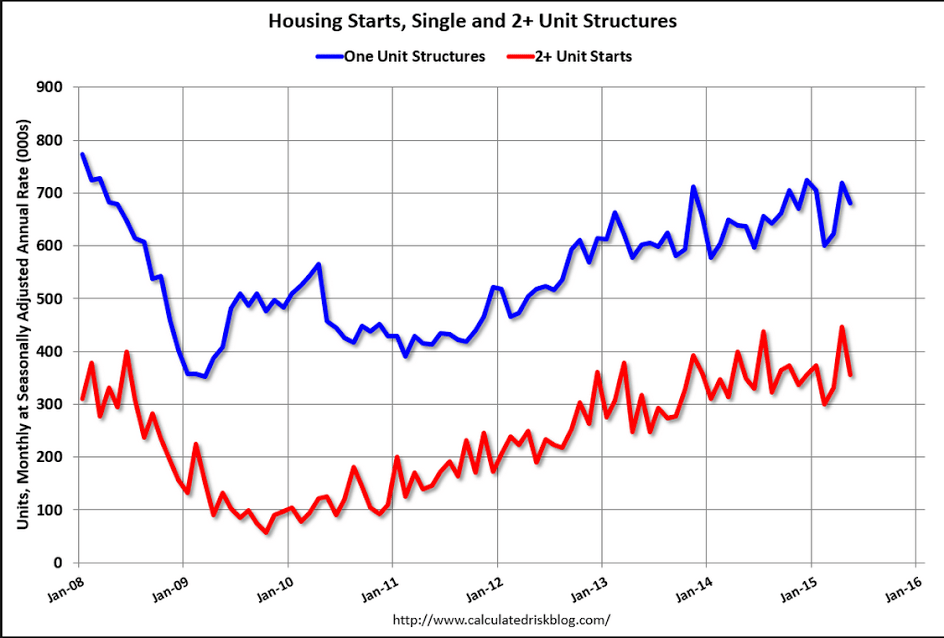
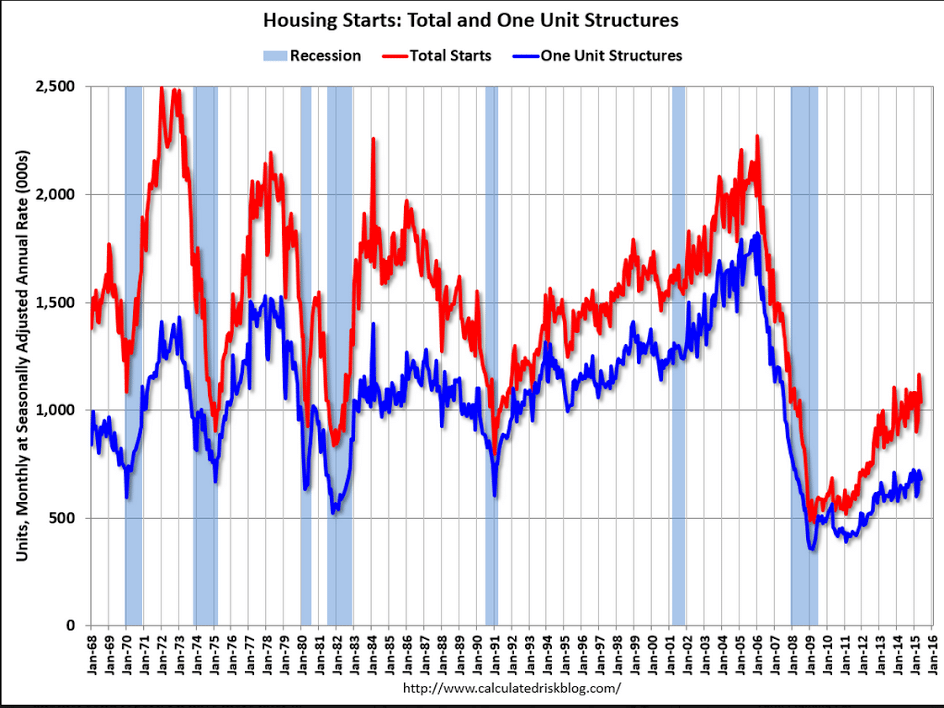
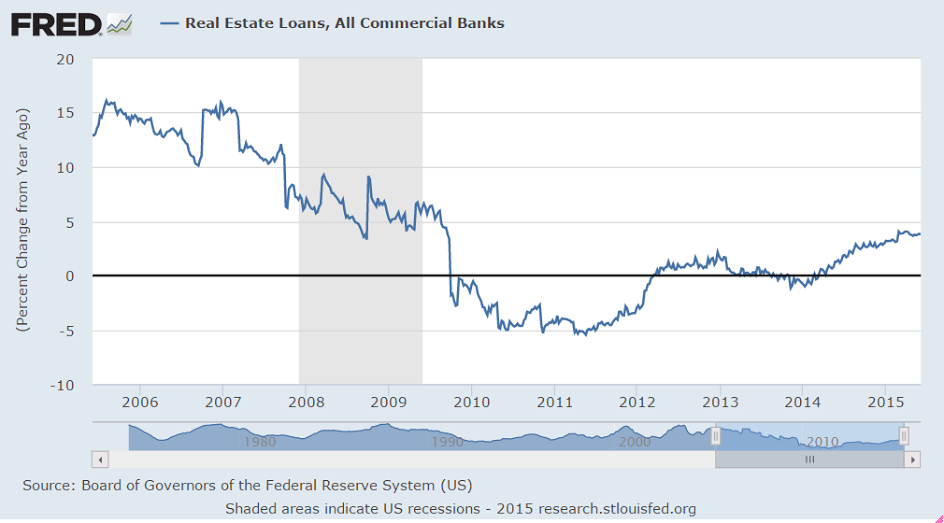
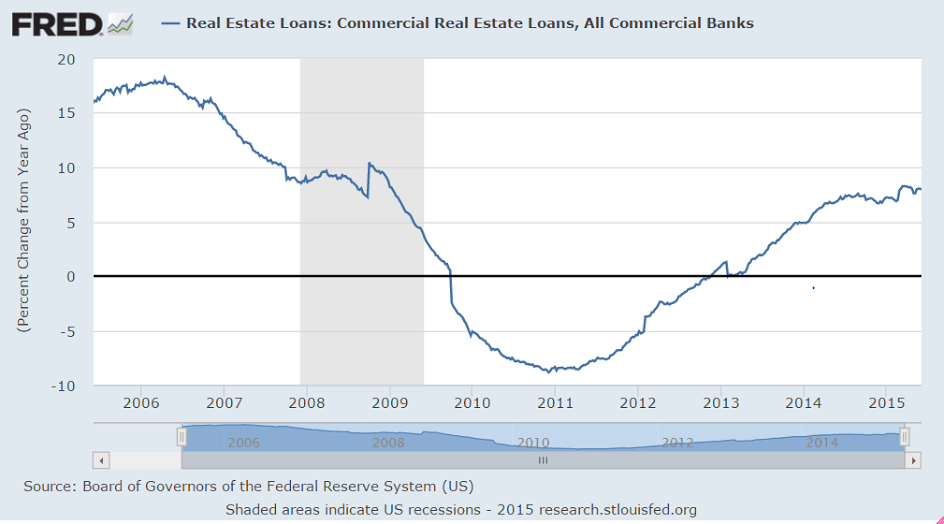
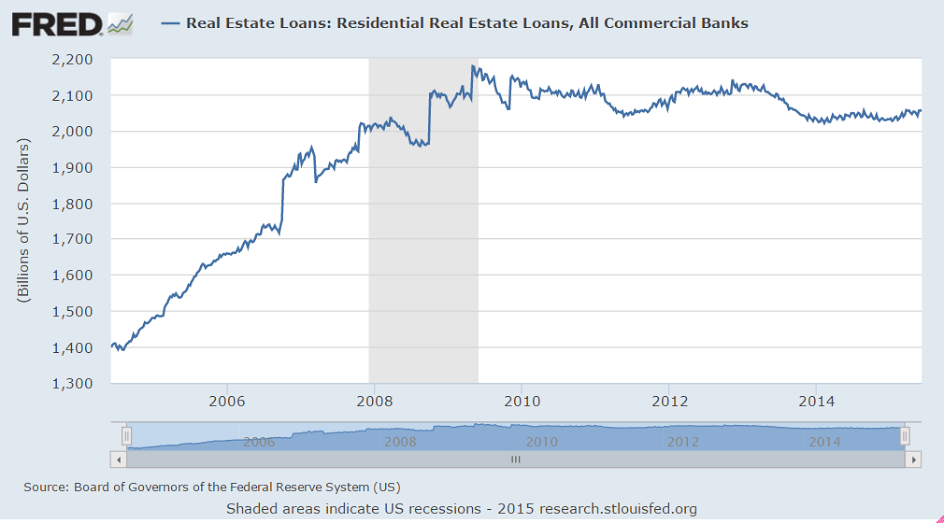
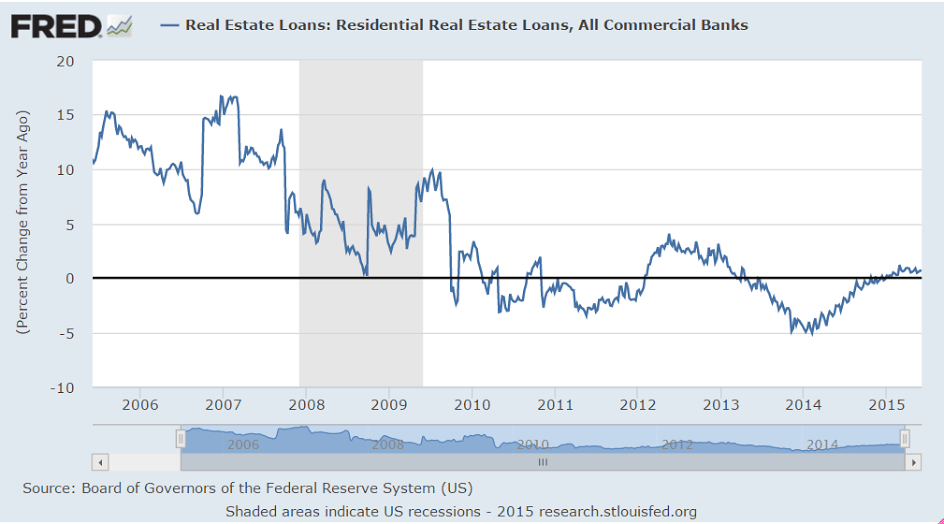
Year over year % change, as the absolute number remains depressed:
er-6-29-2
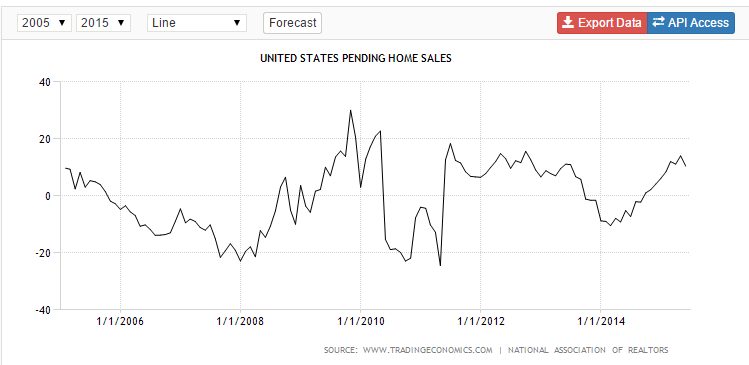
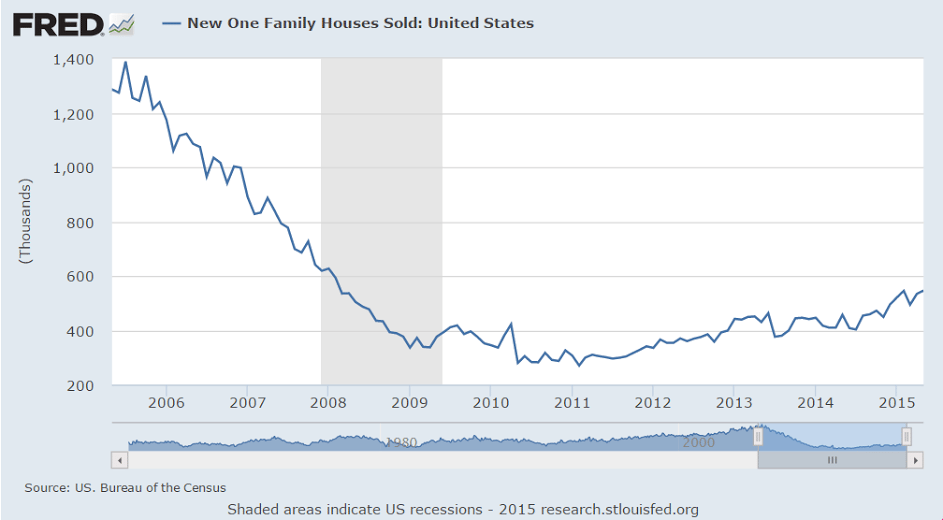
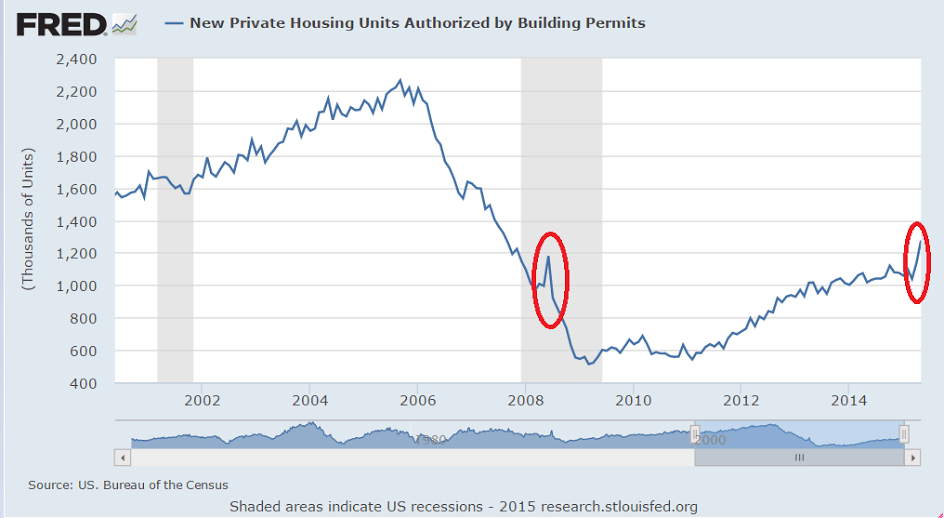
Pending home sales index- only back to previous highs of what was also a depressed market:
er-6-29-3

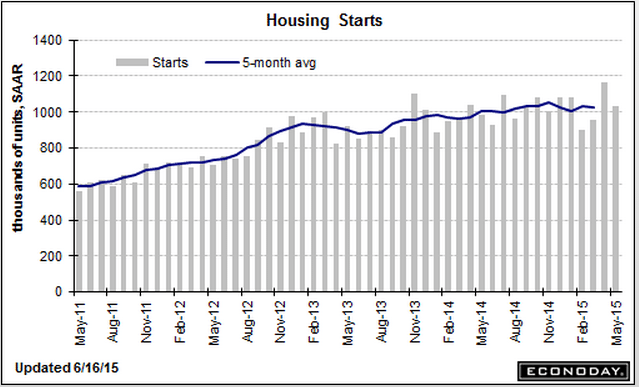
NAR: Pending Home Sales Index increased 0.9% in May, up 10% year-over-year

By Bill McBride

So after reading this and a few other articles it seems they think a ‘run on the banks’ somehow removes euro that could otherwise be used to pay creditors. This implies either some kind of plan to tax bank deposits to pay creditors or just the continued evidence of gross ignorance of their own monetary system. In any case seems the most likely outcome is a yes vote for the troika plan which gives the leadership the desired political cover to go ahead and sign it and move on and remain the European citizens in good standing they’ve always been…

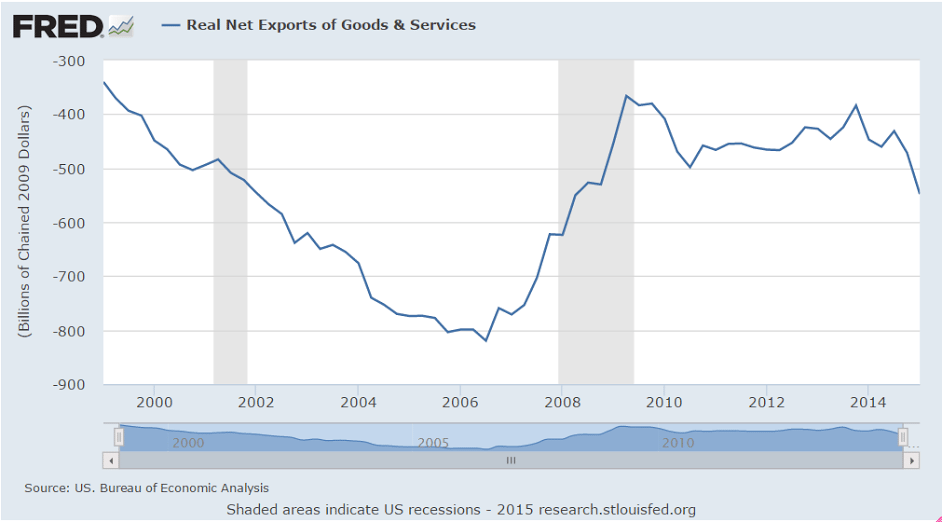
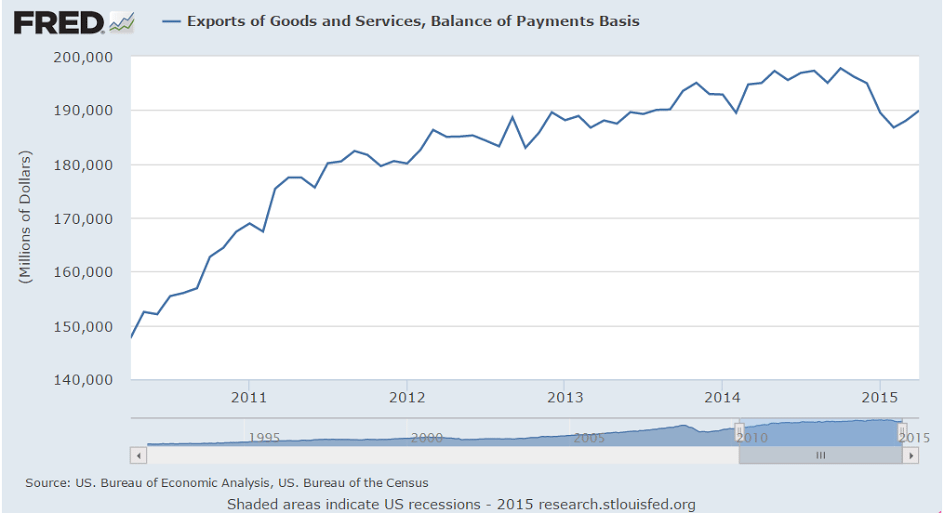
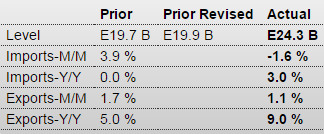
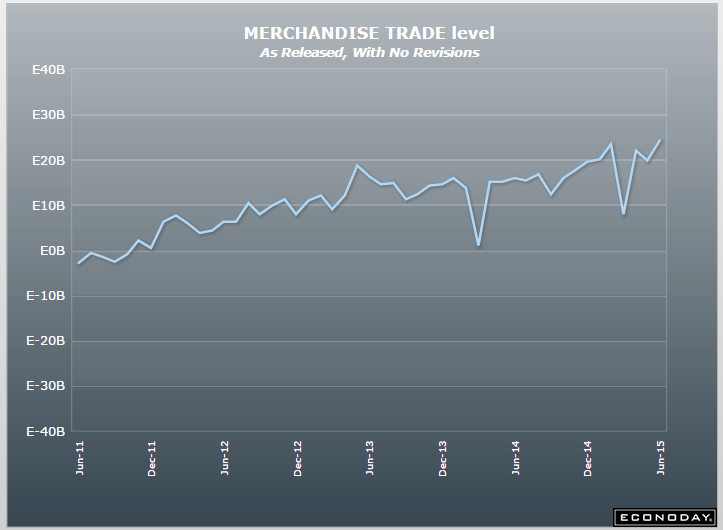
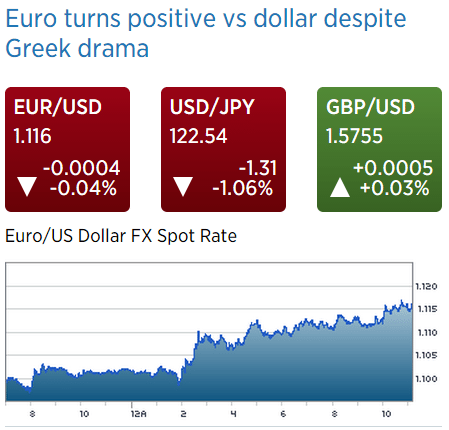
And this would also be yet another victory for the ongoing deflationary policies, this time being spun as explicit support from the people, proving once again that populations dislike inflation even more than they dislike unemployment. This means the focused pursuit of a trade surplus is intact, and I’ve yet to see a currency with a persistent trade surplus and a weak currency:
er-6-29-4

Greece Bailout: Eurozone Ministers to Explore ‘Plan B’ (WSJ) The first step in what has commonly been referred to as “Plan B” among Greece’s creditors would likely be the introduction of capital controls to avoid a run on the country’s banks. But in comparison to Cyprus, which implemented capital controls as part of a €10 billion bailout package from the eurozone and the International Monetary Fund, the financial situation of the Greek government is much more precarious. The eurozone portion of Greece’s €245 billion rescue package runs out on Tuesday, the same day the government has to pay €1.55 billion to the IMF.

Doing the same thing over and over again and expecting different results…

China cuts reserve ratio, interest rates to bolster growth (Xinhua) The central bank cut the RRR for commercial banks serving rural areas, agriculture and small businesses by 50 basis points (bps). The RRR for finance companies, or non-bank financial institutions, will be lowered by 300 bps, the PBOC announced. Benchmark interest rates have also been cut. Interest rates for one-year lending and deposits are cut by 25 bps to 4.85 percent and 2 percent respectively. Lending of other terms and kinds will also be lowered by the same margin, the announcement said. It is the third RRR reduction in nearly five months, while the fourth round of interest cuts in nearly seven months.

China cuts rates, Atlanta Fed, car sale comment, Greek PM comments

As the carpenter said about his piece of wood, ‘no matter how much I cut off it’s still too short’:

China’s central bank cut its benchmark lending rates by 25 basis points to 4.85 percent on Saturday, the fourth reduction since November, as it gears up to lower borrowing costs and support a slowing economy.

The People’s Bank of China (PBOC) also reduced one-year benchmark deposit rates by 25 basis points to 2 percent, it said in a statement on its website, adding that the reductions would take effect on Sunday.

atl-nowcast-6-29
Yes, car sales are up a bit, but seems import content is growing so it’s working against US GDP and employment?

Number of ‘American-made’ autos drops to new low

By Phil LeBeau

So why would the Prime Minister do this?

The Greek banks are ECB members, regulated and supervised by the ECB, with liquidity provided by the ECB. Should liquidity end, the ECB via the Bank of Greece simply stops making payments on that bank’s behalf. And why close the banks and prevent them from performing ongoing bank services that don’t require ECB liquidity, should it not be available as needed? Just more evidence that the Greek leaders aren’t playing with a full deck, so to speak…

Greek PM calls for bank closures, capital controls

By Phillip Tutt

June 29 (CNBC) —Despite a tweet from Greek Finance Minister Yanis Varoufakis that his government “opposed the very concept” of any controls, Greek Prime Minister Alexis Tsipras said later Sunday that he had forced the country’s central bank to recommend a bank holiday and capital controls.

credit check response to comment

Yes, and the rate of growth is lower than the last cycle, and steady to lower, not ‘accelerating’, and in any case note that it jumped up going into the last recession.
cc-6-29-1
cc-6-29-2
And commercial paper isn’t growing as was the case in the last cycle, so that element of total credit remains flat and depressed.

I see no evidence yet of ‘lift off’ from Q1 to Q2, only a very modest bounce of a few indicators and a strong possibility of Q2 being 0 should inventory/sales continue to revert and net imports be larger than expected as the last report looked like a zig that’s always followed by a zag:
cc-6-29-3
cc-6-29-4
cc-6-29-5
cc-6-29-6
cc-6-29-7
Port strike and price influence:
cc-6-29-8
cc-6-29-9
zigs up followed by zags down:
cc-6-29-10
Net exports decreasing again, and now oil is a bit higher and US production growth has slowed and likely turned negative in June, with oil consumption up a bit, adding to oil imports. And non oil imports have been rising with the strong dollar, which has also dampened US export growth. Furthermore, the global drop in capex due to lower oil prices looks to have reduced US exports as well.
cc-6-29-11
cc-6-29-12

Consumer spending, rail traffic

Personal Income and Outlays
er-6-26-1
Highlights
The consumer came to life in May, boosted by a 0.5 percent rise in personal income and helping to support a 0.9 percent surge in personal outlays that reflects heavy spending on autos and retail goods. And gains are not inflationary, at least yet, based on the very closely watched core PCE price index which edged only 0.1 tenth higher in May and is at a very benign 1.2 percent year-on-year rate which is actually down a tenth from an upward revised April.

Components on the income side are very solid with wages & salaries up 0.5 percent in the month. Both proprietors’ income and rental income show especially strong gains. Spending components show special strength for durables, again tied especially to autos, and also strong gains for non-durables, here tied to higher pump prices. Spending on services once again shows an incremental gain.

Turning back to PCE prices, the overall price index looks a little hot in May at plus 0.3 percent but the year-on-year rate is unchanged at only 0.1 percent. That’s right, that’s the year-on-year rate at only the most incremental level of inflation. And the 1.2 percent year-on-year core appears to be moving in reverse, down 1 tenth in each of the last two reports and further away from the Fed’s 2 percent target.

Consumers, in an expression of their confidence, dipped into their savings to spend, with the savings rate down 3 tenths to 5.1 percent. This is a good report for the bulls, showing a strong non-inflationary bounce for the second quarter. This report won’t be keeping the doves up at night and does not move forward the Fed’s coming rate hike.

First, note the last wiggle up all the cheer leading is about, up from the previous flat one on the 5 year chart:
er-6-26-2
And the year over year growth rate for the last 10 years, and how the last time it got over 3% it didn’t stay there long:
er-6-26-3
New vehicle sales may have been up for the month, but the year over year industry growth rate is generally slowing:
er-6-26-4
er-6-26-5
And retail was reported higher, but hasn’t yet even recovered from the prior dip:
er-6-26-6
er-6-26-7
And, turns out, here’s where the growth is also coming from lately- health care premiums, which aren’t tracking with the lower growth of actual health care prices:
er-6-26-8
er-6-26-9
Construction appears to be growing at historical rates since the crisis dip:
er-6-26-10

The growth in health care employment has picked up to more historic levels after a large decline, so perhaps the larger increases we’ve seen are just a case of ‘catch up’, nor does there seem to be any unusual wage growth associated with the additional employment:
er-6-26-11
er-6-26-12
Nothing good happening here:
er-6-26-13

Durables charts, new home sales,FHFA House Price Index, Japan PMI, GDP, Atlanta Fed, Mtg. purch apps, oil comment

Longer term year over year view not looking so good:
er-6-24-1

er-6-24-2

er-6-24-3

er-6-24-4

er-6-24-5
The cheer leading continues, and sales in the Northeast up 87% looks a bit unsustainable?

New Home Sales
er-6-24-6
Highlights
The lift off for housing is appearing more and more like it’s straight up. New home sales rose 2.2 percent in May to an annual rate of 546,000 which is 6,000 above the high end Econoday forecast. Add to this is a 27,000 upward revision to the two prior months with April now standing at 534,000 for a big 8.1 percent monthly gain.

The surge in sales is making for a strong seller’s market with supply relative to sales down to a very thin 4.5 months vs 4.6 months in April. Total new homes on the market stand unchanged at 206,000. The lack of supply risks becoming acute and will doubtlessly speed up construction activity led by permits which, in data posted last week, have been jumping.

Lack of supply will prove to be a positive for sales prices, which however, are down in the latest report, 2.9 percent lower to a median $282,800. Year-on-year, the median price is down 1.0 percent vs the year-on-year sales gain of 19.5 percent in a mismatch that points to price acceleration ahead.

Regional sales data show a strong 13.1 percent rise in the West where year-on-year sales are up 25.5 percent. The South, which is larger than all the other regions combined in this report, has the strongest year-on-year rate at 33.3 percent though monthly sales in May dipped 4.3 percent. Sales have been soft in both the Northeast and Midwest where year-on-year rates are in the negative column though the Northeast is showing monthly strength in this report.

Yesterday’s existing home sales report was very positive as is today’s report, both of which add to other data that put housing at the top economy right now for a sector that can offset stubborn weakness in the manufacturing economy.
er-6-24-7

Seems like a stretch to call this ‘lift off’???
er-6-24-8
And price gains have at least moderated?
er-6-24-9
Another PMI goes negative. And note that exports are up, in contrast to the US:

Japan : PMI Manufacturing Index Flash
er-6-24-10
Highlights
The flash manufacturing PMI for June indicated a slight deterioration in operating conditions at Japanese manufacturers. Production growth slowed to a fractional pace, while new orders contracted for the third time this year so far. Subsequently, employment growth was subdued, while buying activity declined. The flash manufacturing reading was 49.9, down from the May final of 50.9. Output increased, though at a slower rate. Employment increased but at a slower rate. Both output and input prices increased at a faster rate.

While new orders changed direction and decreased, export orders increased at a faster rate. Reports of a favorable exchange rate and an increase in foreign demand led to a further rise in new export orders in June. Moreover, the latest expansion was the second-fastest since January and quicker than the series average.

As expected, still negative, still only a minor weather bounce to Q2 so far:

GDP
er-6-24-11
Highlights
The second revision to first-quarter GDP came in as expected, at minus 0.2 percent. Exports were near the top of the negative side, reflecting the strong dollar’s negative effect on foreign demand. A rise in imports was the quarter’s biggest negative.

The heavy weather of the quarter contributed to an outright contraction in business spending (nonresidential fixed investment) and an abrupt slowing in consumer spending (personal consumption expenditures).

Despite PCE slowing, spending on services, that included an upward revision for restaurants, was the strongest component in the first quarter. Also adding to GDP was an inventory build, one however that was largely unwanted and tied to the quarter’s severe weather and port slowdown. Residential investment was also a positive. The GDP price index was unchanged in the quarter.

First-quarter 2015 wasn’t as badly hit as first-quarter 2014 when GDP sank 2.1 percent, a dip that was then reversed by a 4.6 percent bounce back in second-quarter 2014. Estimates for this second quarter’s GDP growth are settling into the 2 to 3 percent range. We’ll get yet another look at the first quarter with annual revisions on July 30.

I’m sure the Fed sees this:
er-6-24-12

Marginally better:
er-6-24-13

Now 18% over last year. Better, but bank credit numbers don’t show an increase and all cash purchases are down as a % of purchases:

MBA Mortgage Applications
er-6-24-14

Highlights
After swinging up-and-down the past few weeks, mortgage applications inched higher in the June 19 week. Purchase applications rose 1.0 percent with refinancing applications up 2.0 percent. Year-on-year, purchase applications are up a very strong 18.0 percent. Mortgage rates dipped in the week with the average for conforming loan balances ($417,000 or less) down 3 basis points to 4.19 percent.

More signs that US production has peaked and maybe starting to decline, which will mean increased petroleum imports and a higher trade deficit:
er-6-24-15

Existing home sales, Chicago Fed, Greece

Up some but still at depressed levels, and not enough to indicate a general bounce in spending. Personally I sold come small condos in Chicago I’d owned since working there in the early 1980’s. I got tired of fooling with them, net rental income was low, and prices weren’t going anywhere, And I still have 2 nice houses for sale, one in Jupiter Farms, another outside of Orlando, that haven’t sold yet and are priced well below 2007 levels. They are reconditioned foreclosures from the portfolio of the bank I sold 2 years ago.

So activity is up some, prices are up but not to replacement cost and also because to some extent the bid hitting from distressed selling has subsided. And there also could have been a few sales in front of the anticipated rise in rates, as often happens.

And watch for all the cheer leading on this report, as below:

Existing Home Sales
er-6-22-1
Highlights
The housing sector is lifting off, as existing home sales jumped 5.1 percent in May to a 5.35 million annual rate that hits the top end of the Econoday consensus. The year-on-year rate tells the story, at plus 9.2 percent which, outside of March’ s 11.9 percent, is the strongest rate in nearly two years. And prices are rising, up 7.9 percent year-on-year at a median $228,700.

In a special sign of strength, sales are strongest for single-family homes, up 5.6 percent in the month to 4.73 million. Year-on-year, single-family sales are up 9.7 percent. Condo sales have been flat in recent reports, up 1.6 percent in May to a 620,000 rate for a year-on-year gain of 5.1 percent. And in yet another special strength, first-time buyers are back in the market, making up 32 percent of all sales vs 27 percent this time last year.

Gains sweep the regional data with the Midwest up 4.1 percent and the West and South up 4.3 percent each. Year-on-year, the biggest gain is in the Midwest at 12.4 percent with the West at 9.0 percent and the South up 6.9 percent.

Holding down sales has been a lack of supply which, relative to sales, is at 5.1 month vs 5.2 in April. In another sign of tightness, the median sales time held steady at 40 days. But the rising sales rate together with the rise in prices are certain to bring new homes to the market. And homes are coming onto the market, to 2.29 million vs 2.20 and 2.01 in the prior two readings.
er-6-22-2
er-6-22-3

No bounce here:

Chicago Fed National Activity Index
er-6-22-4
Highlights
There was net improvement in May’s run of economic data but not much at least based on the national activity index which comes in at minus 0.17 vs a downward revised minus 0.19 in April. The 3-month average is telling the same story of weakness, at minus 0.16 vs a revised minus 0.20 in April.

Much stronger payroll growth, at 280,000, was May’s highlight but the gain was offset by a 1 tenth tick higher in the unemployment rate to 5.5 percent which leaves the month’s total employment contribution to the index unchanged at plus 0.10. Other readings were also little changed and all soft: production-related indicators at minus 0.17 vs April’s minus 0.19, sales/orders/inventories at zero vs minus 0.1, and personal consumption & housing at minus 0.09.

The big bounce, according to today’s report, that was expected following the transitory factors of a very soft first quarter has yet to appear.

Remember the cheer leading last year when the high prints were recorded, just before oil prices fell? And then how the drop in oil price would be fueling/accelerating GDP with forecasts in the 4% neighborhood?
er-6-22-5
It now looks like the Greek leaders have thrown in the towel and offered something likely to be accepted, all as previously discussed (though it was never even close to a ‘sure thing’), showing that deep down the leadership are ‘Europeans’ first who see nationalism as the greater risk, and will work for progressive change within the context of the EU, however slim their odds of success.

And not to say it’s a ‘done deal’ or that rough spots won’t continue. This is politics, with all the associated risks.

DB: Greece: Finally some positive news, much more to go

The details of the new Greek proposal have not been published, but press reports so far suggest they represent a material change in stance for the Greek government. Details reported include the following:

– A broad based increase in VAT rates, inclusive of some foodstuffs and restaurants by 10%;

– An elimination of early retirement benefits from 2016 to be phased in over three years;

– Most importantly, a broad-based increase in pension contributions, reported to be 2% for wage-earners and 2% for corporations;

– An increase in a special “healthcare” charge on pensions equivalent to an across the board cut of 1% in main and 5% cut in supplementary pensions;

– Cuts in defense spending;

– Increases in corporate tax rates to those firms earning more than 500mio EUR profits;

– Increases in income tax rates to those earning above 30k EUR.

Our assessment of the reported changes above is that they represent meaningful concessions from the Greek side, if they are to be confirmed, bringing them closer to the creditor proposals.

Greece at the cross roads

On Fri, Jun 19, 2015 at 6:47 AM, wrote:
Hi Warren!

Do you know this proposal by Rob Parentau and Trod Andresen of introducing a parallel currency in the form of Tax Anticipation Notes?

A program proposal for creating a complementary currency in Greece

From rumours seem it could be introduced in Greece.

What do you think?

Yes, it’s been around for a while- a take off on Mosler bonds and my California proposal years ago when they had problems.

The Greeks have known about these things all along but didn’t want to go in that direction. If they come to any kind of agreement, they get full conventional funding. If they don’t, they are afraid of what might happen to the banking system and the economy if the EU retaliates, whether or not they get alternative funding. And that could mean political turnover and the rise of Golden Dawn, etc.

So it hasn’t been about funding- it’s been about coming to terms that allow Greece to stay in the EU. As we discussed, leaving is looked at as a move to the right, and a victory for the right and nationalism.

It’s the right that has said the the EU was a mistake from the beginning for reasons of governance more than economics. The current Greek leftist government considers themselves as ‘progressive Europeans’ who look to the European Union and the common currency as the progressive future, moving away from the nationalism that caused the previous centuries of warfare, etc. So their first choice is to remain Europeans and work within the EU for a progressive economic agenda.

If they do break from the EU and move towards alternative finance to support their progressive economic agenda, which could very well happen, they will see it as a catastrophic failure of their diplomatic efforts to achieve their personal ideals.

Greek bank liquidity, credit check

So people transferred their deposits to other banks, and those other banks wouldn’t redeposit/lend those euro back to the Greek banks via the interbank market, at any rate of interest.

So instead the lost deposits were replaced by what functionally are deposits from the ECB via what’s called the ELA. What’s wrong with that? Why have an interbank market at all? Why not simply let banks have debits/deposits from the ECB as needed as long as they are deemed adequately capitalized and in good standing by that same ECB? And no other entity has the access and authority to fully regulate and supervise, qualifying it regarding the decision of providing ‘liquidity’.

The way I say it is ‘the liability side of banking is not the place for market discipline.” Hopefully they know this and don’t decide to punish privately owned ECB member banks for sins of their govt.

On Monday, ECB President Mario Draghi told European lawmakers that, so far, the bank had helped out Greek lenders to the tune of 118 billion euros ($133 billion) – about 66 percent of Greece’s overall economy. At the end of 2014, that sum was only half the current level.

Still no bounce:
cc-21-1
cc-21-2
cc-21-3
cc-21-4
cc-21-5

Atlanta Fed, Italy trade, mtg purchase apps, oil prices

Up some then back down some, still at a very low rate off of a negative Q1:
er-6-17-1
Down a bit but still positive, as is most all of the euro zone now with the euro at current levels:

Italy : Merchandise Trade

er-6-17-2
Highlights
The seasonally adjusted trade balance was in a E3.5 billion surplus in April, short of a marginally downwardly revised E3.8 billion in March and the smallest excess since September 2014.

The modest deterioration reflected a 0.8 percent monthly fall in exports, their first decline since December, as imports were flat after three successive months of growth. Compared with April 2014 exports rose 9.0 percent, little different from their end of quarter rate (9.1 percent) while imports increased 9.3 percent, also much in line with the previous month’s rate (9.7 percent).

The monthly change in exports was hit by falls in capital goods (3.9 percent) and intermediates (0.4 percent) but boosted by consumer goods (1.3 percent) and, in particular, energy (9.9 percent). Excluding energy exports fell a sharper 1.1 percent. Imports saw broad-based declines amongst the major categories and would have dropped versus March but for an 8.8 percent bounce in energy.

The latest data leave the trade gap at the start of the second quarter some 13.1 percent below its average in the first quarter. In part this will reflect higher oil costs but it also increases the risk of another negative contribution from net exports to real GDP growth.

Back down, not good, but now looking like it was a modest blip up in front of a feared increase in mtg rates that accelerated a few purchases. Still about 15% over last year which just about makes up for the loss of all cash purchases, indicating similar sales but with a shift towards more financing:

United States : MBA Mortgage Applications

er-6-17-3
Highlights
Volatility in interest rates is making for volatility in mortgage applications which fell sharply in the June 12 week, down 4.0 percent for the purchase index and down 7.0 percent for the refinancing index. Mortgage rates moved sharply higher in the week, up 5 basis points for the average 30-year conforming loan ($417,000 or less) to 4.22 percent. But rates have since been coming down this week, following the 10-year Treasury note which, after spiking near 2.50 percent last week, is back near 2.30 percent.

From the MBA:Mortgage Applications Decrease in Latest MBA Weekly Survey

Mortgage applications decreased 5.5 percent from one week earlier, according to data from the Mortgage Bankers Association’s (MBA) Weekly Mortgage Applications Survey for the week ending June 12, 2015. …

The Refinance Index decreased 7 percent from the previous week. The seasonally adjusted Purchase Index decreased 4 percent from one week earlier. The unadjusted Purchase Index decreased 6 percent compared with the previous week and was 15 percent higher than the same week one year ago.

And here’s a chart of housing starts on a per capita basis. It’s not yet up to prior recession lows:

er-6-17-4
The Saudis continue to hold the price in $ constant, however the spread between West Texas and Brent has narrowed, indicating US production may have peaked and be in at least relative decline. This follows the narrative that the collapse in operating drilling rigs leads to production declines as existing wells see their output decline over time.

er-6-17-5

Housing Starts, Redbook retail sales, EU merchandise trade, Russia comment, California real estate licensees

The good news here is that last month was up more than expected, and permits were up as well. Lots of cheer leading on this one, and the upward revision of last month’s report ups Q2 GDP estimates a tad, but a quick look at the charts tells me that so far it was a blip up last month from a prior dip, and now back to where it’s been, and longer term it’s still extremely depressed and no longer the large % of GDP it used to be, and growing only very slowly at best. Also, the latest move up in mortgage rates was caused by market anticipation of Fed hikes, and was not demand driven, so if anything it’s likely to slow sales once the pre hike mini surge in borrowing abates, as the credit numbers show has already happened.

Housing Starts
er-6-16-1
Highlights
Don’t let the headline fool you, the housing starts & permits report points to solid strength for the housing sector. Starts came in at a 1.036 million rate in May which is down 11.1 percent from the April rate but the April rate, which was already one for the record books, is now revised higher to 1.165 million for, and this is no misprint, a 22.1 percent gain from March. Sealing matters is another gigantic surge in permits, up 11.8 percent to 1.275 million following a 9.8 percent gain in April. Forecasters will be revising their second-quarter GDP estimates higher following today’s report, not to mention their estimates for Thursday’s index of leading economic indicators where permits are one of the components.

Permits are the leading indicator in the report and the latest rate is the best since way back in August 2007. The gain is centered in the Northeast followed by the Midwest. Turning to starts, the monthly step back is split between all regions with the Northeast, in contrast to permits, showing the largest percentage decrease.

The housing sector is moving to the top of the economy, just as many suspected following a first quarter that was depressed by heavy weather. Watch tomorrow for descriptions of the housing sector in the FOMC statement and also Janet Yellen’s comments at her press conference.

er-6-16-2
er-6-16-3
er-6-16-4
er-6-16-5
er-6-16-6
er-6-16-7
er-6-16-8

Permits spiked up, but spikes like this have always been followed by spikes down, and sometimes worse:
er-6-16-9
Still stone cold dead for all practical purposes:
er-6-16-10

This is very strong euro stuff that will put upward pressure on the euro until this surplus goes away as it weakens the economy and brings on the next major euro crisis:

European Union : Merchandise Trade
er-6-16-12
Highlights
The seasonally adjusted trade balance returned a record E24.3 billion surplus in April following a marginally larger revised E19.9 billion excess in March. Unadjusted the surplus was E24.9 billion, up some E10.0 billion from a year ago.

The monthly jump in the adjusted black ink reflected a combination of stronger exports and weaker imports. The former posted a 1.1 percent monthly rise, their third consecutive increase, to stand 9.0 percent above their level a year ago. Imports on the other hand were down 1.6 percent versus March and reversed much of that period’s advance. Even so, annual import growth accelerated to 3.0 percent.

The April data put the trade surplus more than 13 percent above its first quarter mean when total net exports subtracted 0.2 percentage points from the quarterly change in total output. Although volatile energy prices mask underlying volume trends the omens are good for a positive contribution from the external sector this quarter.
er-6-16-13

Russia: President Vladimir Putin said his country would be bulking up its nuclear arsenal in the coming year. Speaking at a military and arms fair, Putin announced that, “More than 40 new intercontinental ballistic missiles able to overcome even the most technically advanced anti-missile defense systems will be added to the make-up of the nuclear arsenal this year.”

The announcement comes a day after Russia denounced a U.S. plan to move tanks and heavy weapons to the Russian border in support of its NATO allies. “The feeling is that our colleagues from NATO countries are pushing us into an arms race,” Anatoly Antonov, Russia’s deputy defense minister, reportedly told RIA news agency.

er-6-16-14