Pending Home Sales, Atlanta Fed, MTG Purch. Apps

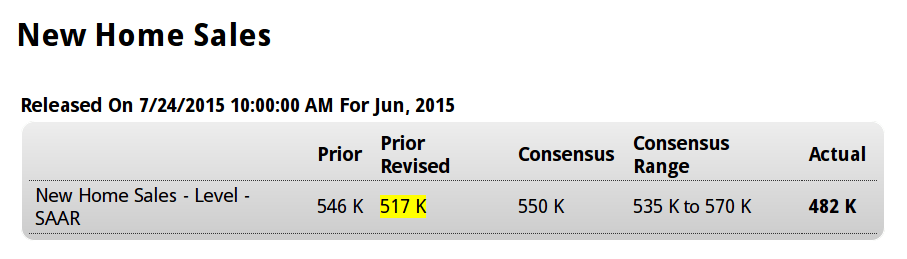
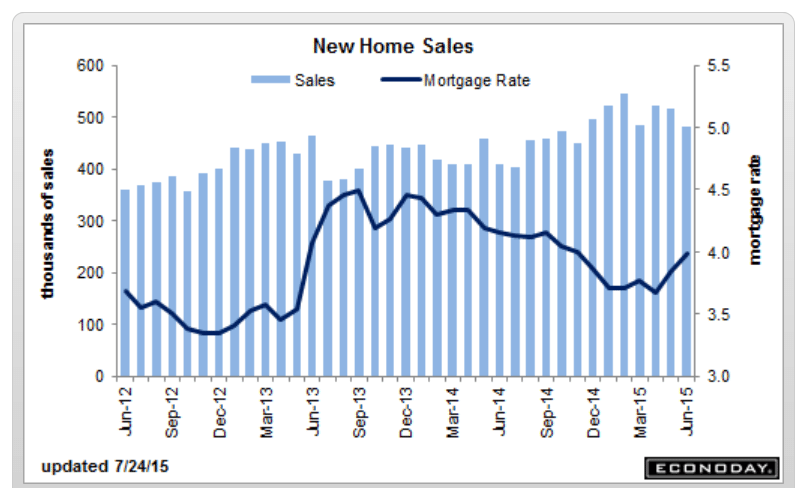
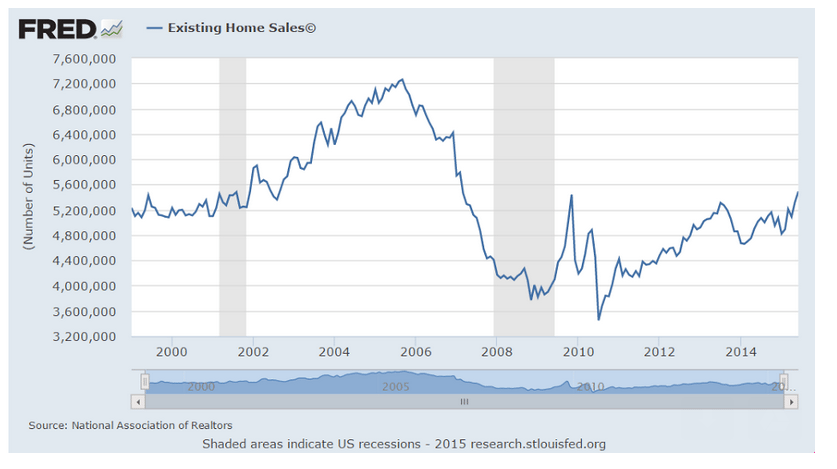
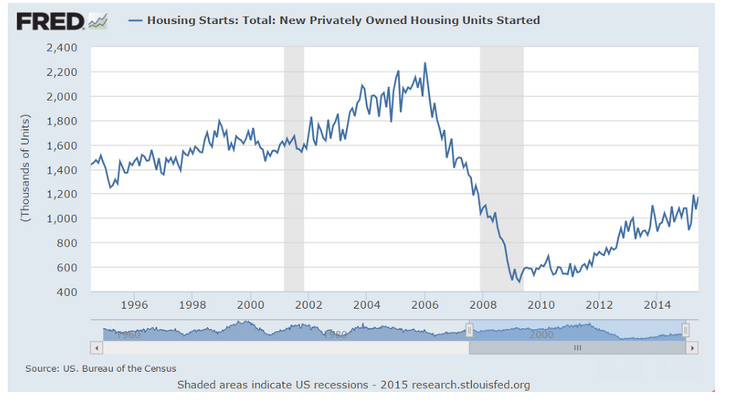
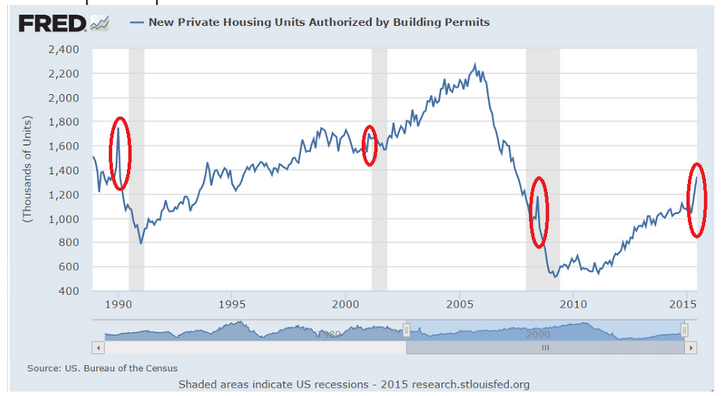
Confirms other indicators of housing a bit volatile but still depressed and going nowhere:

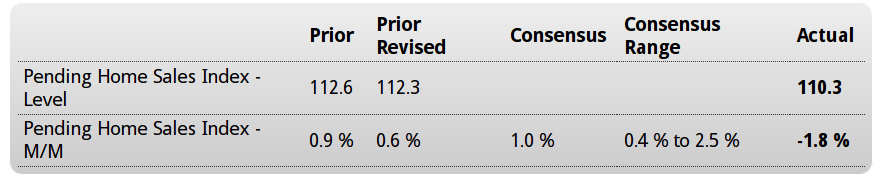
Pending Home Sales Index
er-7-29-1

Highlights
In a negative for the summer home-sale outlook, pending sales of existing homes fell a sharp 1.8 percent in June. The low-end Econoday forecast was for a gain of 0.4 percent. The year-on-year rate slowed from the low double digits to plus 8.2 percent, which is very respectable but slightly lower than the trend for final sales of existing homes.

Weakness was centered in the South and the Midwest where year-on-year pending sales are on the soft side, at plus 7.8 percent and 5.0 percent respectively. Both the West and Northeast posted small monthly gains in June with year-on-year sales rates at plus 10.4 percent and with the Northeast, the smallest region for home sales, in the top spot at 12.0 percent.

This report is the latest to take the edge off the housing outlook which had been rising sharply following weakness early in the year. Strength in housing may contribute less than expected to the second-half economy.

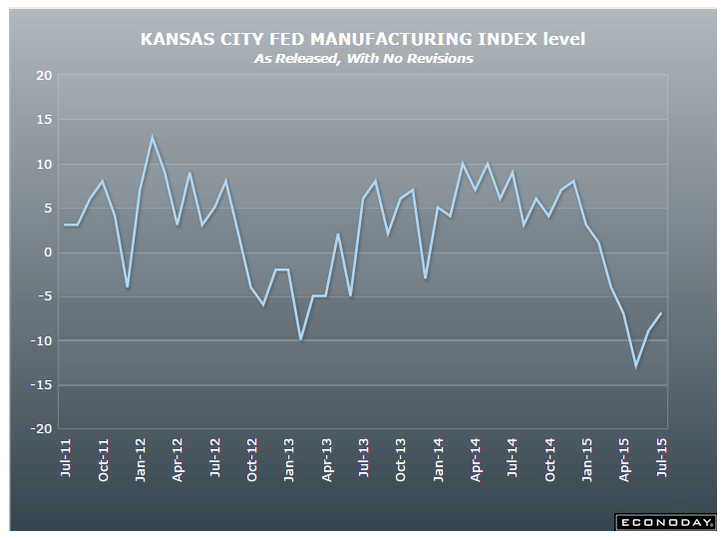
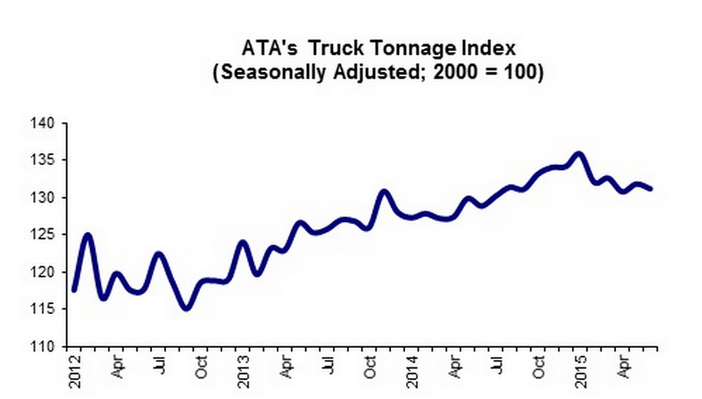
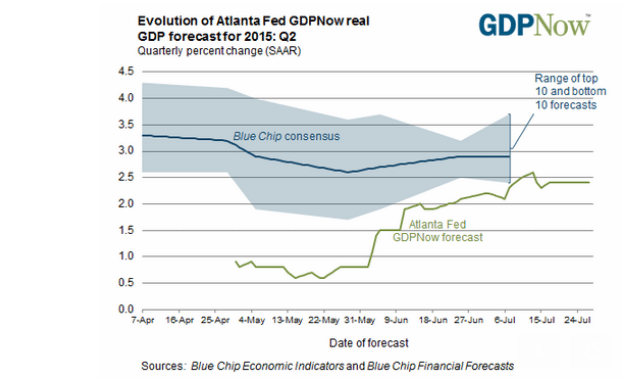
At 2.4%, the Atlanta Fed’s model is below most all mainstream forecasters of tomorrows initial govt. estimate for Q2 GDP. A weak number wouldn’t surprise me, but in any case I expect downward revisions as June trade and inventory numbers are released, and as past releases are revised lower as well. The problem is nothing has stepped up to replace the lost oil capex, both domestically which is a direct loss to US sales and output, and internationally which is cutting into US exports.

Latest forecast — July 27, 2015

July 27 (GDPNow)

er-7-29-2


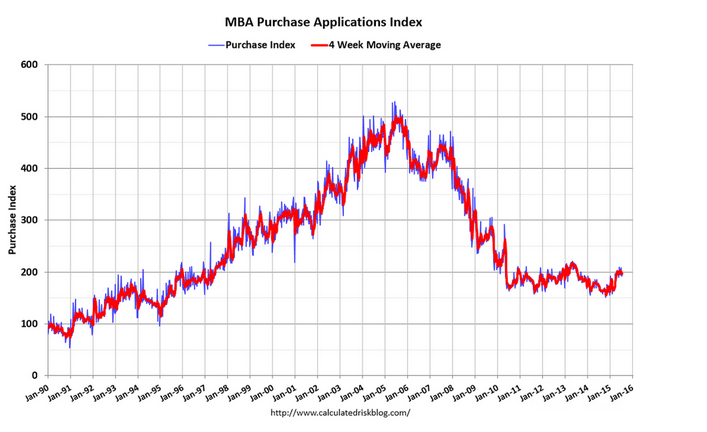
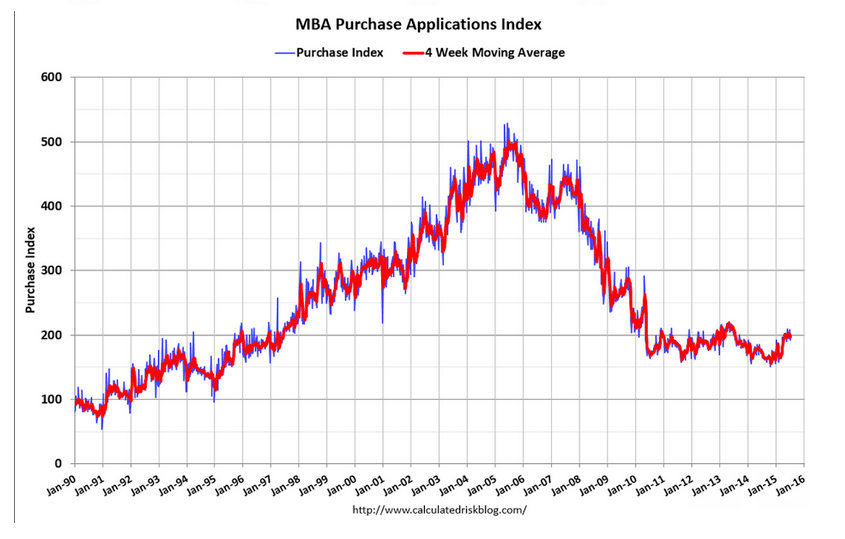
Mortgage purchase apps have held relative steady and at historically depressed levels after a brief dip earlier this year. They are higher than last year, but there are also fewer all cash purchases and therefore more mortgage financed purchases for an given number of sales.

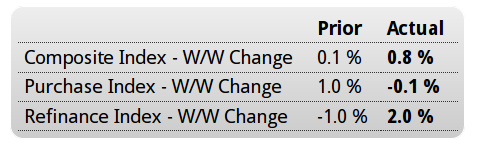
MBA Mortgage Applications
er-7-29-3

Highlights
The purchase index was little changed in the latest week, up 0.1 percent, but continues to trend much higher than a year ago, up 18 percent. The refinance index rose 2.0 percent in the week. Rates moved lower with the average 30-year mortgage for conforming loans ($417,000 or less) down 6 basis points to 4.17 percent.

er-7-29-4

Redbook Retail Sales, Case-Shiller House Prices, PMI Services, Consumer Confidence, Richmond Fed, Oil Capex, Truck Tonnage

Still bad:

source: Econoday.com
er-7-28-1

Softening:

source: Econoday.com
er-7-28-2

I don’t put much weight on Markit surveys, but the optimism comment is interesting:


source: Econoday.com
er-7-28-3

Highlights

Service sector growth is strengthening slightly this month based on Markit’s July flash index which is up 4 tenths to a very solid 55.2. New orders are at a 3-month high and are getting a boost from both consumer spending and from business customers, the latter a welcome signal of strength for business investment. Backlogs are up and so is hiring. But optimism in the 12-month outlook, perhaps shaken by the outlook for the global economy, is the softest it’s been in three years. Input prices continue to rise but final prices are flat. This report is mostly upbeat and, despite the easing in the outlook, points to solid contribution from the service sector.

This kind of drop is concerning, and I’ve been watching for employment, a lagging indicator, to take a dive:

source: Econoday.com
er-7-28-4

Highlights

Consumer confidence has weakened substantially this month, to 90.9 which is more than 6 points below Econoday’s low estimate. Weakness is centered in the expectations component which is down nearly 13 points to 79.9 and reflects sudden pessimism in the jobs outlook where an unusually large percentage, at 20 percent even, see fewer jobs opening up six months from now.

Less severe is weakness in the present situation component which is down nearly 3 points to 107.4. Here, slightly more, at 26.7 percent, say jobs are hard to get but this is still low for this reading.

A striking negative in the report is a drop in buying plans for autos which confirms weakness elsewhere in the report. Inflation expectations are steady at 5.1 percent which is soft for this reading.

This report is citing problems in Greece and China as possible factors for the decline in expectations, but US consumers are typically insulated from international events. The decline in expectations, mirrored earlier this morning by a similar decline in the service-sector outlook, may be sending early hints of second-half slowing, slowing that could push back of course the Fed’s expected rate hike.

A bit better, but another reference to softening employment. And note the volatility of this series, with moves up often followed quickly with moves down:

source: Econoday.com
er-7-28-5

Highlights

The Richmond Fed is reporting the best strength of any manufacturing region this month, at 13 which is above the Econoday top-end estimate. New orders are especially strong, up 7 points to 17, with backlog orders also rising, up 7 points to 10. Shipments are strong, capacity utilization is up and inventories, because of the activity, are being drawn down. Hiring, however, is slowing. Price data show slight pressure for inputs but no pressure for finished goods.

This report contrasts with much slower rates of growth in the New York and Philadelphia Fed regions and sharply contrasts with recent data from the Dallas and Kansas City Feds where manufacturing, due to the energy sector, is in deep contraction. But today’s result is a welcome positive, suggesting that manufacturing may yet pick up this year and a reminder of strength in yesterday’s durable goods report.

er-7-28-6


This had been estimated at $100 billion:

source: Financial Times
er-7-28-7

Truck Tonnage, New Car Sales Preview

ATA Trucking Index decreased 0.5% in June

by Bill McBride on 7/27/2015 01:55:00 PM

er-7-27-9

Here is an indicator that I follow on trucking, from the ATA: ATA Truck Tonnage Index Fell 0.5% in June

American Trucking Associations’ advanced seasonally adjusted For-Hire Truck Tonnage Index decreased 0.5% in June, following a revised gain of 0.8% during May. In June, the index equaled 131.1 (2000=100). The all-time high of 135.8 was reached in January 2015.

Compared with June 2014, the SA index increased 1.8%, which was above the 1.5% gain in May. Year-to-date through June, compared with the same period last year, tonnage was up 3.4%. …

With flat factory output and falling retail sales, I’m not surprised tonnage was soft in June,” said ATA Chief Economist Bob Costello. “I also remain concerned over the elevated inventory-to-sales ratio for retailers, wholesalers, and manufacturers, which suggests soft tonnage in the months ahead until the ratio falls.

Read more at Calculated Risk Blog

The rate of growth of new car sales continues to slow, with most of the growth coming from imports:

From Kelley Blue Book: New-Car Sales To Increase Nearly 3 Percent In July 2015, According To Kelley Blue Book

New-vehicle sales are expected to increase 2.6 percent year-over-year to a total of 1.47 million units in July 2015, resulting in an estimated 17.1 million seasonally adjusted annual rate (SAAR), according to Kelley Blue Book www.kbb.com …

“As the industry settles into the summer selling season, new-car sales are expected to remain consistent with last month’s numbers, representing modest and slowing growth versus last year,” said Alec Gutierrez, senior analyst for Kelley Blue Book. “Sales in the first half of the year totaled 8.5 million units, a year-over-year improvement of 4.4 percent and the highest first-half volume since 2005. Total sales in 2015 are projected to hit 17.1 million units overall, a 3.6 percent year-over-year increase and the highest industry total since 2001.”

Read more at Calculated Risk Blog

Durable Goods Orders, Dallas Fed

Note how they blame the dollar for the drop in exports rather than the oil price drop
which removed $ income from foreign producers, thereby reducing their ability to buy US goods and services.
And notice the year over year chart remains negative.

source: Econoday.com

er-7-27-1

Highlights

June was a strong month for durable goods orders which rose a slightly higher-than-expected 3.4 percent. Excluding transportation, which is where aircraft orders are tracked, new orders rose 0.8 percent which is near top-end expectations. Core capital goods orders, which also exclude aircraft, rose a very solid 0.9 percent. These readings are some of the highest of the last year and offer welcome evidence of a long awaited pop higher for what is, however, a still depressed factory sector.

Turning briefly to civilian aircraft, orders surged 103 percent after falling 46 percent in May. Swings in aircraft are common in this report and reflect monthly swings in Boeing orders. Other industries include a small gain for motor vehicles and for computers & electronics as well as large gains for machinery and fabricated metals. In a hint of strength for the construction sector, electrical equipment jumped an especially sharp 2.8 percent in the month.

Turning back to totals, shipments inched 0.1 percent higher with shipments of core capital goods edging 0.1 percent lower and including downward revisions to both May and April. The shipment readings for capital goods will not be lifting second-quarter GDP estimates for business investment. Unfilled orders ended two months of contraction with a 0.1 percent gain while inventories rose 0.4 percent, a modest build that keeps the stock-to-sales ratio unchanged at 1.68.

This is only the third monthly gain for durable goods orders going all the way back to July, which was before of course the drop in oil prices and rise in the value of the dollar, the former having torpedoed the energy sector and the second having flattened the nation’s exports. Today’s report will confirm for many expectations that the negative effects of the strong dollar on exports are beginning to ease.

er-7-27-2

The longer term chart shows how this type of decline is most often associated with recessions:

source: FRED

er-7-27-3

You can also see the last run up was caused by the last burst of oil exploration chasing $100 oil, and now we are back in the soup:

source: FRED

er-7-27-4

er-7-27-5

er-7-27-6

Actual shipments of consumer goods negative year over year:

source: FRED

er-7-27-7

Nothing good here, and note the attempt at cheer leading:

source: Econoday.com

er-7-27-8

Highlights

Contraction in the Texas manufacturing sector continues to ease, to minus 4.6 in July vs minus 7.0 in June and minus 20.8 May. For the first time this year, new orders actually rose in the month but only slightly, up 0.7. Unfilled orders, however, remain in contraction for an eighth straight month at minus 6.5. Lack of unfilled orders is not good for employment which is in the negative column for a third straight month at minus 3.3.

Among other readings, production, at minus 1.9, is in contraction for a fifth straight month while shipments, at minus 4.3, are in contraction for a sixth straight month. Inventories are up and price readings are mute. In a positive, the company outlook, at plus 1.2, is in the positive column for the first time this year.

Nowhere has the crunch in the energy sector been more evident than in this report. Hopefully, however, the negative effects from the prior plunge in oil prices are, as the Federal Reserve expects, beginning to ease.

PMI Manufacturing Index, New Home Sales, Redfin Real Estate Report, Rail Traffic

source: Econoday.com
er-7-24-1

Highlights

The manufacturing PMI is holding steady, coming in at a composite 53.8 in the July flash and right in line with the 54.0 final reading for June and June’s 53.4 flash. Though respectable, these are soft rates of growth for this report which runs hot relative to other manufacturing data and where the long-run average is 54.3.

New orders and production are both accelerating this month though hiring is holding down the composite. The report cites reduced capital spending in the energy sector as a negative for the sample, and it says some firms are focusing their efforts on domestic markets given weakness in export markets.

Other details include a fall-off in input buying due in part to excess inventories. Price readings remain subdued.

This report is pointing to little change for the manufacturing sector this month, a sector that has been struggling this year and looks to continue to struggle through the second half.

Not good. This is what happens in a recession. And in a slowdown greater supply indicates excess inventory:

er-7-24-2

Highlights

Volatility is common for new home sales and there’s plenty of it the June report where the headline plunged 6.8 percent to a far lower-than-expected annual rate of 482,000 and where revisions erased 40,000 from the prior two months.

But there is some good news in the report and that’s a surge in supply of new homes on the market, up 3.4 percent in the month to 215,000. Greater supply points to greater sales ahead. On a sales basis, supply is at 5.4 months vs 4.8 and 4.7 in June and May.

Prices look soft in the report, at a median $281,800 which is up 0.5 percent in the month but down 1.8 percent year-on-year. The latter reading points to deep discounting compared to the year-on-year sales gain of 18.1 percent.

Regional data show big drops in the West and the Midwest in the month and a smaller drop in the South. But the Northeast is showing life with a second straight solid gain. Year-on-year, the South and Northeast lead with respective sales gains of 23.7 and 23.1 percent with the West and Midwest lagging at 10.9 and 5.7 percent.

The sales data in today’s report, with the June rate the lowest of the year, are likely to shave second-quarter GDP slightly and take some of the shine off the housing outlook.

er-7-24-3

From Redfin:

source: CNBC.com

Sales of existing U.S. homes rose to the highest level in eight years, according to the National Association of Realtors, but that may be the peak for the year. One real estate brokerage claims consumer demand for housing took a sharp turn for the worse in June, as potential buyers balked at higher home prices.

“People look at houses and don’t pull the trigger,” said Glenn Kelman, CEO of brokerage Redfin, which released a new demand index on Thursday. “We know that the number of people writing offers has been declining for 4½ weeks, and based on that data we make a forecast.”

The new demand index tracks millions of visits to Redfin’s listing pages, as well as customer requests for home tours, customer offer requests on homes and various pricing data; in June it showed demand up 13 percent from a year ago but down 7 percent from May. That was the largest monthly decline since December of 2014.

source: Econointersect.com

Rail Week Ending 18 July 2015: Rail Data Continues to be Soft
Econintersect: Week 28 of 2015 shows same week total rail traffic (from same week one year ago) contracted according to the Association of American Railroads (AAR) traffic data. Intermodal traffic expanded year-over-year, which accounts for approximately half of movements – but weekly railcar counts continued in contraction.

Chicago Fed, KC Fed, Japan Exports

Note the details and the conclusion:

source: Econoday

er-7-23-1

Highlights

June proved to be a slightly stronger month for the economy than expected, based on the national activity index which came in at plus 0.08 vs Econoday expectations for a 0.05 dip. The 3-month average is still in the negative column though just barely at minus 0.01.

Production indicators showed the most improvement in June, at minus 0.01 vs minus 0.08 in May. The gain here reflects strength in the utilities and mining components of the industrial production report where, however, manufacturing remained flat. Employment also improved, to plus 0.12 from May’s plus 0.06, here reflecting the 2 tenth downtick in the unemployment rate to 5.3 percent. This dip, however, was tied to a decrease in those looking for work which is not a sign of job strength. Personal consumption & housing, at minus 0.07, was little changed as was the sales/orders/inventories component at plus 0.03.

This report is a bit of a head fake, not reflecting the weakness in manufacturing and the special factor behind the decline in the unemployment rate. In sum, growth in the economy is no better than the historical average which is a disappointment, showing little bounce from the weak first quarter.

Unambiguously negative, again:


source: Econoday
er-7-23-2

Highlights

Deep continuing contraction is the score for the Kansas City manufacturing report where the headline index is little changed at minus 7. Order readings point to more trouble ahead with new orders at minus 6 and backlog orders at minus 14. Weakness in export orders, at minus 10, is a central negative for the report, as is hiring, at minus 19 and the workweek at minus 18. Price readings are steady and mute. This region’s manufacturing sector, hurt by both exports and the energy sector, is badly depressed as is the Dallas manufacturing sector. Regional July reports from Dallas and Richmond will be posted early next week to round out the view for what looks to be another weak month for manufacturing.

er-7-23-3

More signs the US trade deficit will be larger for Q2.
From Japan:

Exports to Asia were up 10.1 percent on the year while those to China were 5.9 percent higher. Exports to the European Union added 10.8 percent. It was the seventh consecutive increase. Exports to the U.S. climbed for the tenth straight month, this time by 17.6 percent.

Truck Tonnage, MTG Purchase Apps, Gas Prices Not Helping, Existing Home Sales, Architectural Index

er-7-22-1

er-7-22-2

er-7-22-3

Who would’ve thought…

er-7-22-4

Up some but still depressed and not part of GDP in any case:

er-7-22-5

Up a bit but note the details:

“The June numbers are likely showing some catch-up from slow growth earlier this year. This is the first month in 2015 that all regions are reporting positive business conditions and aside from the multi-family housing sector, all design project categories appear to be in good shape,” said AIA Chief Economist Kermit Baker, Hon. AIA, PhD. “The demand for new apartments and condominiums may have crested with index scores going down each month this year and reaching the lowest point since 2011.”

Sector index breakdown: institutional (59.1), mixed practice (54.7), commercial / industrial (51.6) multi-family residential (47.0)
emphasis added

Read more at Calculated Risk Blog

Redbook Retail Sales, NY Housing Spike

More of same- looking very weak

er-7-21-1

Highlights

Redbook’s sample has been reporting depressed sales rates since all the way back in March, including the latest week when same-store year-on-year sales rose only 1.2 percent. The report blames a seasonal lull for the latest disappointment, citing lack of shopper interest ahead of the back-to-school season.

From Nomura:
Looks like an expiring property tax break in NY State caused the burst of activity. Excluding the northeast, looks like starts in Q2 were about the same as Q1:


er-7-21-2

er-7-21-3