2008-04-18 JN Highlights

doesn’t look too bad?

Highlights:

Consumer Sentiment Improves For 1st Time In 6 Months
Industrial Production Index Rose To Record 110.2 In February
March Department Store Sales Fall 1.2% On Year
Supply Of Tokyo Office Space To Drop 40%: Survey
BOJ Cuts Assessment On 8 Of 9 Regional Economies
Shirakawa Keeps Weak Economic Outlook, No Hint On Rate Action
Govt Holds Economic Assessment, Says Japan’s Recovery ‘Pausing’
BOJ Rate Cut Speculation Losing Momentum In Money Market
Labor Shortage Pushed Workers 65 Or Older Above 2mn In ’07
Japan On 11% Economic Growth Pace For ’08 In Dollar Terms
Forex: Dollar Firm At Mid-102 Yen Level On Eased U.S. Financial Turmoil
Stocks: Weaker Yen Lifts Nikkei For 4th Straight Day

Changing Tides

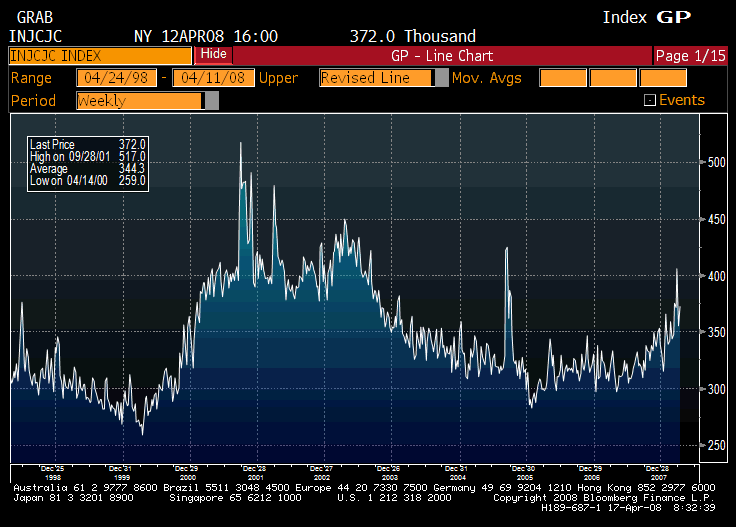
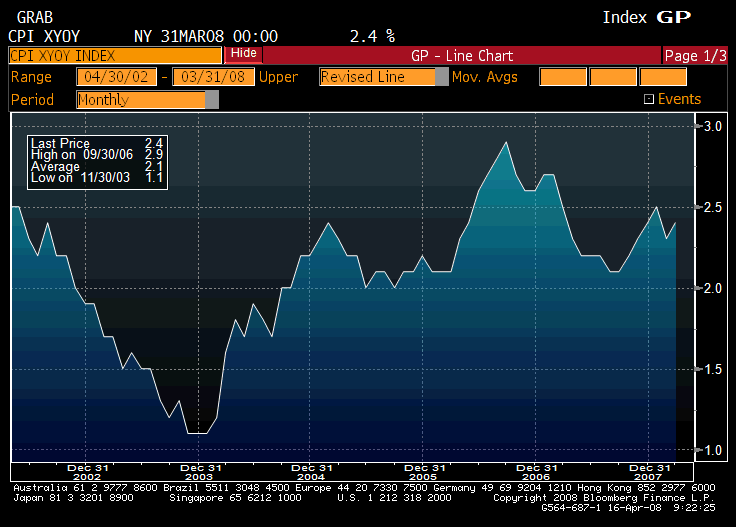
I’ve been thinking that when the Fed turns its attention to inflation it will find itself way behind that curve, which it is by any mainstream standard, and that the curve then gets negative from a year or two out as markets anticipate rate hikes followed by falling inflation and rate cuts.

Didn’t know exactly how it would get from here to there, how long it would take or exactly when it would happen.

I never thought the Fed would let it go this far. Especially Governor Kohn, who has been through this before in the 1970s with Burns, Miller, and Volcker. This FOMCs inflation tolerance lasted a lot longer than I expected, even with a weak economy and perceived systemic risk.

Won’t be long before the mainstream comes down hard on this FOMC for letting the inflation cat out of the bag with a high risk, untested, counter theory strategy of aggressively cutting into a triple negative supply shock. The mainstream will see it as a ‘hail Mary’ move. If it works, fine, if not it was a foolish error with a major price to pay to fix it.

Maybe they just got what will turn out to be overconfident in their inflation fighting ability. Kind of a ‘we know how to do that and can do it anytime’ attitude.

Wrong. They will soon find out it is not so easy.

Maybe they got confused and saw the tail risk as that of the gold standard era when there were real supply side constraints to money to deal with.

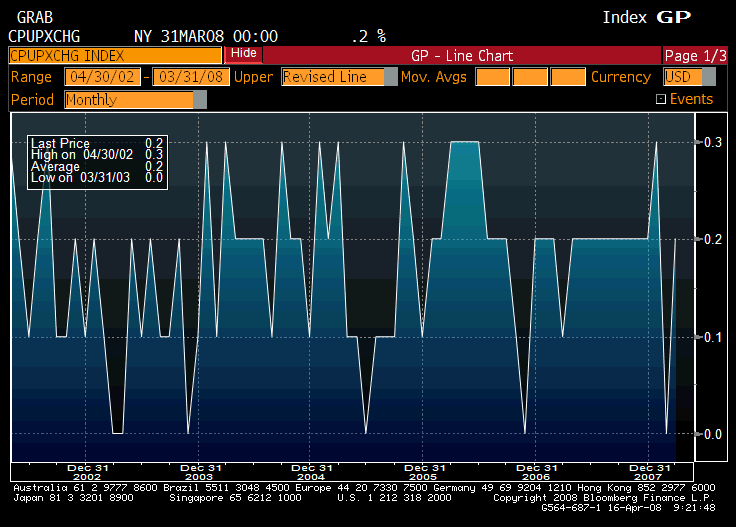
Also, they probably blamed the whole 1970’s thing on labor unions; so, maybe they got blind sided this time because they thought without unions wages would be ‘well contained’ and therefore there would be no inflation.

Wrong on that score as well. It was about oil before, and it is about oil now.

And the fact is, they have no tools for fighting inflation. They think they do (hiking rates), but higher rates just make it worse by raising costs and jacking up rentier incomes. (Incomes of savers who do not work or produce = more demand and no supply)

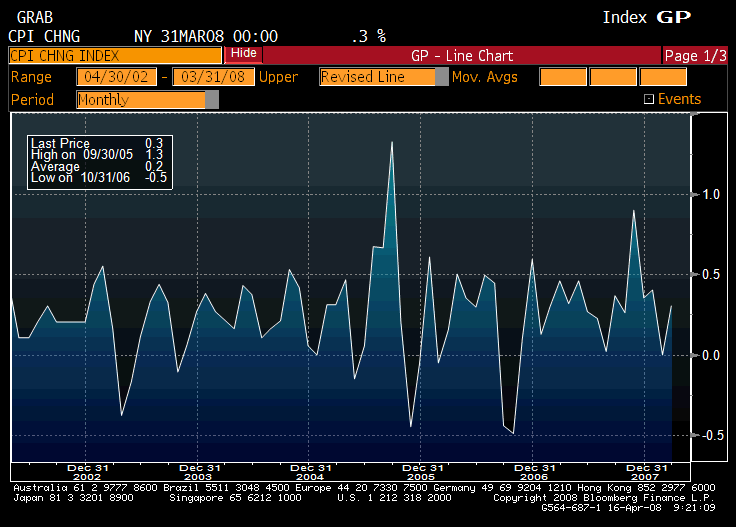
The inflation broke in the early 80’s only because of a supply response of about 15 million barrels of crude per day that buried OPEC and caused prices to collapse for almost 20 years. (And even during the 20 years of low oil prices and falling imported prices inflation still averaged around 3%.)

That kind of supply response is not going to happen in the near future. I expect the Saudis to keep hiking and inflation to keep getting worse no matter what the Fed does. It is payback time for them from being humiliated in the 1980s, and they are also at ideological war with us whether we know it or not.

Markets might have a false start or two with the interest rate response and flattening curve, just to not make it too easy.

Also, as before, there could be an equity pullback when it is sensed the Fed is going to seriously fight inflation with hikes designed to keep a sufficient output gap to bring inflation increases down.

And along the way everything goes up, including housing prices, during a major cost push inflation. Even with low demand. Just look at all the weak emerging market nations that have had major inflations with weak demand, high rates, etc. etc.

2008-04-17 US Economic Releases

  • Initial Jobless Claims
  • Continuing Claims
  • Leading Indicators
  • Philadelphia Fed.

2008-04-17 Initial Jobless Claims

Initial Jobless Claims (Apr 12)

Survey 375K
Actual 372K
Prior 357K
Revised 355K

Not impossible that this spike to over 400,000 might be ending, much like in 2005, this time with help from a fiscal package and and government spending moved forward from 2007 to 2008.


2008-04-17 Continuing Claims

Continuing Claims (Apr 5)

Survey 2950K
Actual 2984K
Prior 2940K
Revised 2958K

This lags the claims a bit, and could go further, but still not looking like recession type levels


2008-04-17 Leading Indicators

Leading Indicators (Mar)

Survey 0.1%
Actual 0.1%
Prior -0.3%
Revised n/a

The future is starting to look a touch better, and the Fed uses ‘forward looking’ models.


2008-04-17 Philadelphia Fed.

Philadelphia Fed. (Apr)

Survey -15.0
Actual -24.9
Prior -17.4
Revised n/a

2008-04-17 Philadelphia Fed. TABLE

Philadelphia Fed. TABLE

The Phili area is still in a ‘soft spot’ with only prices paid showing real strength.

Twin themes remain from Q2 06: weakness and higher prices.

Yellen the Dove on inflation

“Inflation is a problem,” she said. Yet the problem isn’t excessive demand, rising wages, or a tight labor market, but “negative supply shocks.” Once the shocks wear off, the inflation rate can’t be sustained in the long run without a pick-up in wage growth, she said.

“There’s no textbook answer to what monetary policy should be doing at this time,” Yellen added.

Yes, there is – the mainstream says quite clearly ‘don’t add to demand during a negative supply shock. Or a triple negative supply shock. That will monetize the price increases and turn a relative value story into an inflation story.’

The FF rate is now below the year over year headline and core CPI; so, it’s easy for the Fed to now make the case the ‘real rate’ is negative and cutting it any could adversely alter long term employment and growth given the balance of risks between market functioning, inflation, and the output gap.

They also think they know that if markets are expecting a 25 basis point cut they need to do less than that to get a positive inflation response.

And, as before, they need to set a rate for the TAF and accept any bank legal collateral to be able to more effectively target LIBOR as desired.

2008-04-16 US Economic Releases

  • MBA Mortgage Applications
  • Bloomberg Global Confidence
  • Consumer Price Index
  • Housing Starts
  • Building Permits
  • Industrial Production
  • Capacity Utilization

2008-04-16 MBAVPRCH Index

MBAVPRCH Index (Apr 11)

Survey n/a
Actual 381.6
Prior 384.7
Revised n/a

Holding in its new, lower range.


2008-04-16 MBAVREFI Index

MBAVREFI Index (Apr 11)

Survey n/a
Actual 2866.0
Prior 2724.7
Revised n/a

Doing ok in this prime time for resets, which are peaking and then falling off.


2008-04-16 Bloomberg Global Confidence

Bloomberg Global Confidence (Apr)

Survey n/a
Actual 14.54
Prior 13.08
Revised n/a

Still down, but signs of a bottom.


In my humble opinion, inflation is ripping, and the Fed’s in a very bad place. April’s food and energy price hikes, along with hosts of others, and the weaker USD all are pointing to an upward surge for prices on a forward looking basis.The Fed’s forecasting models should be showing higher inflation as well.And futures markets continue to be an unreliable forecasting tool for the Fed.

2008-04-16 Consumer Price Index MoM

Consumer Price Index MoM (Mar)

Survey 0.3%
Actual 0.3%
Prior 0.0%
Revised n/a

2008-04-16 CPI Ex Food & Energy MoM

CPI Ex Food & Energy MoM (Mar)

Survey 0.2%
Actual 0.2%
Prior 0.0%
Revised n/a

2008-04-16 Consumer Price Index YoY

Consumer Price Index YoY (Mar)

Survey 4.0%
Actual 4.0%
Prior 4.0%
Revised n/a

2008-04-16 CPI Ex Food & Energy YoY

CPI Ex Food & Energy YoY (Mar)

Survey 2.4%
Actual 2.4%
Prior 2.3%
Revised n/a

From Karim:

Headline/Core divergence->limited passthrough

  • Headline 0.343% and stays at 4% y/y

  • Core rises 0.152% (after 0.04% last month), showing limited pass-through from headline and even more limited pass-through from wholesale level (PPI from yday).

  • Core rises from 2.3% to 2.4%, equates to about 1.9-2.0% on core PCE basis due to measurement differences

  • Food up 0.2% and gas up 1.3%

  • OER up 0.2%, apparel down 1.3%, vehicles down 0.1%

  • Lodging away from home down 0.6% and medical up only 0.1%, a bit below trend

Housing starts not looking good. The glimmer of hope is that prior months have been revised up for the last two reports, so there’s a chance this number could be revised substantially as well.

2008-04-16 Housing Starts

Housing Starts (Mar)

Survey 1010K
Actual 947K
Prior 1065K
Revised 1075K

2008-04-16 Building Permits

Building Permits (Mar)

Survey 970K
Actual 927K
Prior 978K
Revised 984K

From Karim:

Housing data shows drag continuing with at least the same intensity

  • Starts down 11.9%, boding poorly for current GDP

  • Permits down 5.8%, boding poorly for future GDP

  • Best news is not adding to inventories

2008-04-16 Industrial Production

Industrial Production (Mar)

Survey -0.1%
Actual 0.3%
Prior -0.5%
Revised -0.7%

May be due to exports, which are keeping GDP and employment muddling through


2008-04-16 Capacity Utilization

Capacity Utilization (Mar)

Survey 80.3%
Actual 80.5%
Prior 80.9%
Revised 80.3%

Staying too high for the typical recession.

NYT: Let them eat corn

Says it all about politics:

Fuel Choices, Food Crises and Finger-Pointing

by Andrew Martin

Senator Charles E. Grassley, Republican of Iowa, called the recent criticism of ethanol by foreign officials “a big joke.” He questioned why they were not also blaming a drought in Australia that reduced the wheat crop and the growing demand for meat in China and India.

“You make ethanol out of corn,” he said. “I bet if I set a bushel of corn in front of any of those delegates, not one of them would eat it.”

2008-04-15 US Economic Releases

  • Producer Price Index
  • Empire Manufacturing
  • NAHB Housing Market Index
  • ABC Consumer Confidence

2008-04-15 Producer Price Index MoM

Producer Price Index MoM (Mar)

Survey 0.6%
Actual 1.1%
Prior 0.3%
Revised n/a

2008-04-15 PPI Ex Food & Energy MoM

PPI Ex Food & Energy MoM (Mar)

Survey 0.2%
Actual 0.2%
Prior 0.5%
Revised n/a

2008-04-15 Producer Price Index YoY

Producer Price Index YoY (Mar)

Survey 6.2%
Actual 6.9%
Prior 6.4%
Revised n/a

2008-04-15 PPI Ex Food & Energy YoY

PPI Ex Food & Energy YoY (Mar)

Survey 2.8%
Actual 2.7%
Prior 2.4%
Revised n/a

2008-04-15 Producer Price Index TABLE

Producer Price Index TABLE

Inflation ripping.

From Karim:

Headline/Core divergence continues

  • Headline up 1.1% m/m and 6.9% y/y

  • Core up 0.2% m/m and 2.7% y/y

  • Food (+1.2%) and gas (+1.3%) lead the way up, computers (-3.2%) and passenger cars (-0.2%) lead the way down.

  • Intermediate and crude pressures remain intense, rising 2.3% and 8.0% respectively for the month

  • Further margin squeeze likely to put further downward pressure on capex, especially in light of weak economy and credit conditions (see below)

Empire jumps from -22.2 to 0.6. Index quite volatile and 10-20 point moves per month the norm as of late.

6mth expectations deteriorate from 25.8 to 19.6.

  • Shipments show largest jump from -5 to +17 (for current conditions)

  • Employment and average workweek both extremely weak

  • Capex intentions fall from 18 to 11.5

2008-04-15 Empire Manufacturing

Empire Manufacturing (Apr)

Survey -17.0
Actual 0.6
Prior -22.2
Revised n/a

Survey is colored by subjective recessions fears bouncing back some.


2008-04-15 NAHB Housing Market Index

NAHB Housing Market Index (Apr)

Survey 20
Actual 20
Prior 20
Revised n/a

Still looks to me like a bottom.


2008-04-15 ABC Consumer Confidence

ABC Consumer Confidence (Apr 13)

Survey n/a
Actual -39
Prior -34
Revised n/a

Still looking weak. Much like an export economy

2008-04-15 EU Highlights

As a point of logic seems their best move is to try to pressure the Fed to stop cutting.

Highlights:

ECB’s Stark, Ordonez Say 4% Key Rate May Not Contain Inflation
French Government Will Lift Minimum Wage by 2.3% on May 1
French annual inflation jumps to 17-year high
Italian inflation jumps to highest level since 1996
German Investor Confidence Unexpectedly Fell in April

Answer to the USD question

Ed says:

Warren,

Isn’t it also true that the US export boom is less a result of the weaker dollar, so much as it is the cause? Foreigners using the trade surplus dollars they were previously content to save, are now spending them, and the shopping list is sizable. In this sense, all the dollars we have been exporting for years are coming home to roost, and that explains a good chunk of the inflation we are seeing.

Ed

I agree the cause is foreigners switching as a sector from wanting to accumulate USD to not wanting to accumulate them, and therefore spending them.

However, I see the market forces working as follows:

The first desire is ‘not to save’ which drives the USD down either until the $ is somehow low enough where they want to save it again, which doesn’t make sense to me, or until the USD is low enough for them to spend them here, which makes a bit more sense to me.

And the other force is the decreased desire to export to us which is evidenced by higher import prices.

Last, this is all inflationary, and inflation is the other channel for getting rid of a trade gap.

For an extreme example, if there is sufficient inflation for the minimum wage to go to $60 billion per hour, the real trade gap is suddenly down to only an hour of labor, though still nominally at 60 billion.

The combination of rising net exports, falling imports, and inflation are all working together right now to digest the sudden shift from CBs and monetary authorities away from buying USD financial assets.

Fiscal adjustment checks start going out in a couple of weeks.

Rest of govt. spending going up as well.

GDP should muddle through and inflation continue to accelerate.

It may dawn on the Fed that the weak dollar is hurting the financial sector as the consumer is being squeezed by food/energy prices and therefore having trouble making loan payments. That’s the price of sticky wages, at least this time around.

Foreign CBs have no option regarding world currency stability but to try to put pressure on the Fed to stop cutting.

FT: US credit rating under threat

Seems no end to the stupidity that continues to spew out from all kinds of places.

You’d think the ratings agencies would have learned their lesson with Japan – downgraded below Botswana and still funded JGB’s at under 1% for years until the BOJ raised rates.

And last I saw ten year US credit default was around ten basis points?

I had a discussion with S&P years ago. Seem to remember a name ‘David’?

He seemed to sort of grasp that operationally governments with their own (non convertible) currencies and floating fx policies aren’t revenue constrained, but obviously didn’t quite get it when they downgraded Japan.

The eurozone is another issue, where they have downgraded national governments and that does mean something regarding risk, just like the US States, but with no legal safety net by the Federal authorities like the US. Fortunately the eurozone banking system hasn’t been tested, yet.

Simple trade: sell US credit default, buy Germany, for example.

US credit rating under threat

by Aline van Duyn

The US government’s need to provide financial backing to the state-sponsored mortgage financiers that dominate the US housing market could pose a risk to the country’s triple-A credit rating, Standard & Poor’s, the credit rating agency, said on Monday.

In the event of a deep and prolonged US recession, S&P said the potential costs of propping up government-sponsored enterprises (GSEs) like Fannie Mae and Freddie Mac, which have implicit government backing, could cost the US government up to 10 per cent of GDP.

The costs of supporting broker-dealers like Bear Stearns in a dire economic situation would be much lower, at below 3 per cent of GDP, S&P said.

“The size of GSEs, coupled with their current level of common equity, could create a material fiscal burden to the government that would lead to downward pressure on its rating,” the S&P report said.

The S&P comments come amid increased pressure for better regulation of the mortgage financiers, especially as their role in the US housing market is likely to increase as they are used to provide support for struggling homeowners.

Policymakers are pushing for Fannie Mae, Freddie Mac and the lesser-known Federal Home Loan Banks to pump liquidity into the US mortgage market and this has prompted regulators to call for stronger oversight of such institutions.

Fannie Mae, Freddie Mac and the Federal Home Loan Banks have become the backbone of the troubled US mortgage market as purely private sources of finance have all but dried up or are offered only at punitive terms.

In the second half of 2007, about 90 per cent of new mortgage funding was provided by GSEs. They have about $6,300bn of public debt and mortgage securities outstanding, more than the $5,100bn of outstanding US government debt.

Fannie Mae and Freddie Mac have no formal state guarantees but investors believe the US government would step in if the system got into trouble. This allows the agencies to raise funds at very low rates against a triple-A credit rating, in spite of high levels of leverage.

The capital surplus ratio for GSEs was recently reduced to 20 per cent from 30 per cent, allowing them to operate on a more leveraged basis.

In January, Moody’s Investors Service, another credit rating agency, said the US could risk its triple-A rating within a decade unless soaring healthcare costs and social security spending was curbed.