CPI, Empire, and Bernanke’s managing of expectations

Right, core is giving Bernanke ‘cover’ to not do any more QE.

I think he now realizes QE doesn’t actually do anything positive for the economy, as all his staff studies show. Yes, it can lower term rates a tad, but it also removes interest income as he himself seemed to have recognized in his own 2004 research paper.

But he also recognizes that it does scare the living daylight out of the likes of China and other portfolio managers who don’t understand monetary operations.

So he’s in a bit of a bind, as his tone of voice showed while responding to live questions.

If he says QE doesn’t do anything, he destroys what he now considers the useful fiction that the Fed has more tools in its toolbox, as markets would realize they are now flying without a net vs the belief in a ‘Bernanke put.’

And so he assures China there will be no more QE, while explaining to Congress that higher core inflation makes QE inappropriate at this time. And while this could be called intellectually dishonest, it’s also required under ‘expectations theory’ that says managing expectations is critical to price stability and optimal output.

As previously discussed, they all believe in the Confidence Fairy, and that economic performance is in no small way a function of expectations.

Also, while outlooks were positive, below, they were less positive than before.

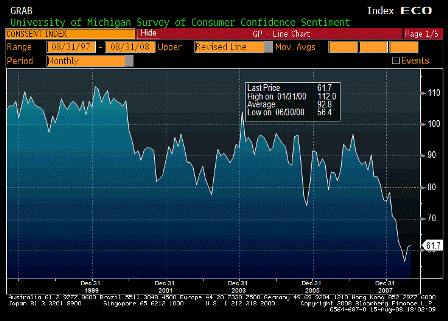
And Michigan just came in lower than expected as well. The jury is still out on when the economic soft spot might end.

And Aug 3 looks to remove US and therefore world aggregate demand, one way or another.


Karim writes:
CPI

  • Headline declines as expected on energy (-0.2%); core much stronger than expected (0.3%)
  • Supports key message BB has been delivering that bar is high for QE3 due to core inflation high and rising now, vs low and falling a year ago
  • A year ago, Core CPI was 0.9%, with the 3mth and 6mth rate annualized rates of change near Zero
  • Now, Core CPI is 1.6% (highest since late 2009) and the 3mth and 6mth annualized rates of change are 2.9% and 2.5%.
  • What is interesting in looking at the attached chart is that the change from the lows is the highest in about 5yrs, and much higher than when oil went to $150 back in the summer of 2008
  • The key is OER (1/3 of core) is now trending at 0.1-0.2% m/m; combined with the other ‘sticky’ components of core (i.e., medical, education), its hard to see core falling back below 1.5%

Empire Survey: Modest gains in current conditions and strong gains in 6mth Outlook


Current July June
Business Conditions -3.76 -7.79
Prices Paid 43.33 56.12
New Orders -5.45 -3.61
Shipments 2.22 -8.02
Delivery Times 1.11 -3.06
Inventories -5.56 1.02
Employees 1.11 10.20
Workweek -15.56 -2.04


6MTH Outlook July June
Business Conditions 32.22 22.45
Prices Paid 51.11 55.10
Prices Received 30.00 19.39
New Orders 25.56 15.31
Shipments 30.00 17.35
Delivery Times 6.67 2.04
Inventories 1.11 -9.18
Unfilled Orders 5.56 -9.18
Employees 17.78 6.12
Workweek 2.22 -2.04
Capital Expenditures 22.22 26.53
Technology Spending 12.22 14.29

2008-08-15 US Economic Releases


[Skip to the end]


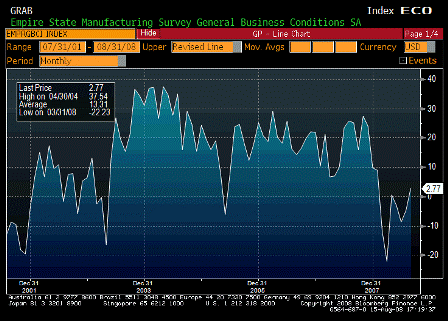
Empire Manufacturing (Aug)

Survey -4.0
Actual 2.8
Prior -4.9
Revised n/a

Yet another series that could be making a comeback, albeit from very low levels.

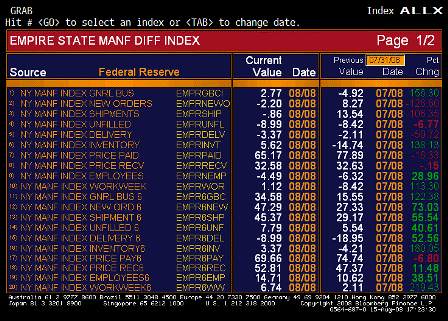
Even the work week went up.

Prices paid still way high, and prices received high and moved higher.

[top][end]

Empire Manufacturing ALLX (Aug)

[top][end]


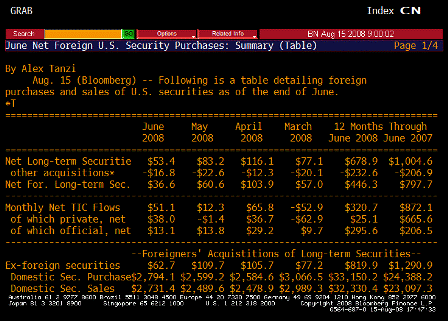
Net Long-term TIC Flows (Jun)

[top][end]

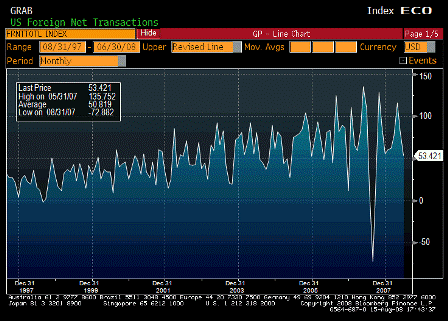
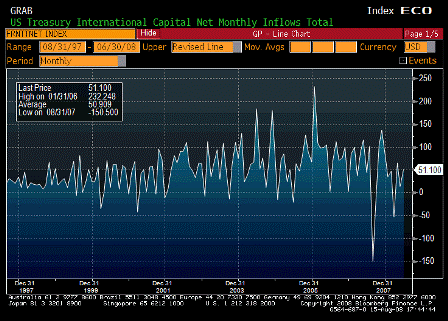
Total Net TIC Flows (Jun)

Survey n/a
Actual $51.1B
Prior -$2.5B
Revised $12.3B

Should be slowing with trade flows reversing.

[top][end]

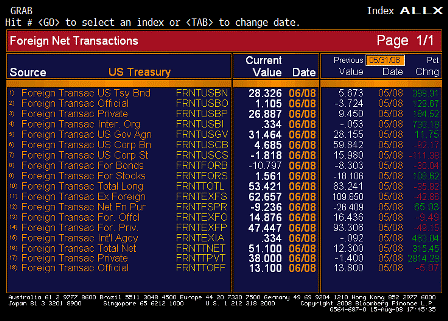
TIC ALLX (Jun)

[top][end]

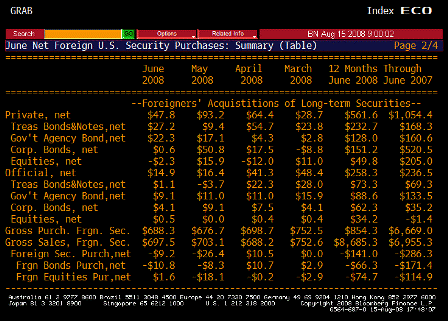
TIC TABLE 1 (Jun)

[top][end]

TIC TABLE 2 (Jun)

[top][end]

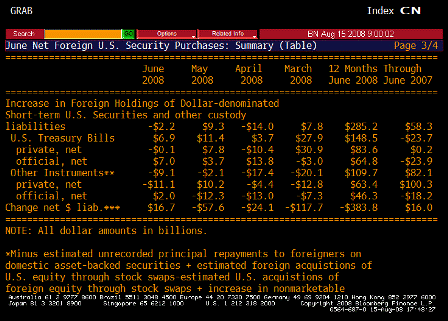
TIC TABLE 3 (Jun)

[top][end]


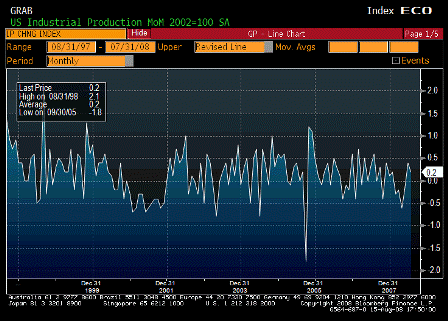
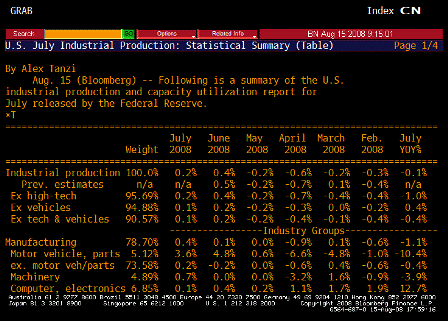
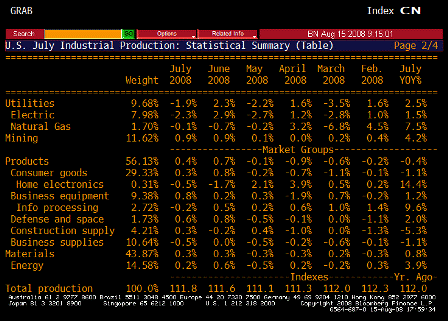
Industrial Production MoM (Jul)

Survey 0.0%
Actual 0.2%
Prior 0.5%
Revised 0.4%

A little better than expected.

[top][end]

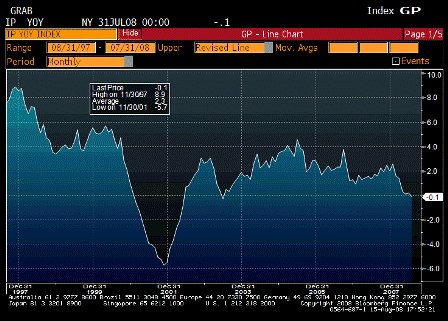
Industrial Production YoY (Jul)

Survey n/a
Actual -0.1%
Prior 0.2%
Revised n/a

Certainly not a collapse.

Being helped by the relatively weak USD.

[top][end]


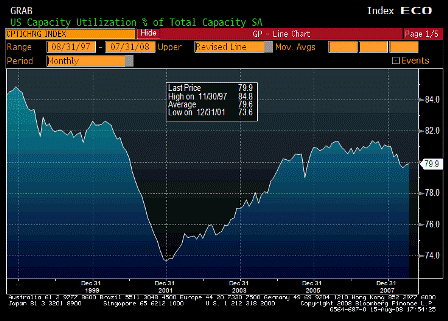
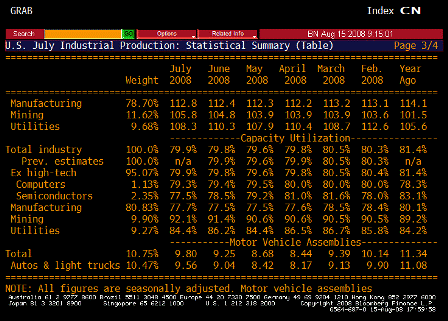
Capacity Utilization (Jul)

Survey 79.8%
Actual 79.9%
Prior 79.9%
Revised 79.8%

No collapse here either.

The Fed’s counting on slack to bring prices down.

[top][end]

[top][end]

Capacity Utilization TABLE 2 (Jul)

[top][end]

Capacity Utilization TABLE 3 (Jul)

[top][end]


U of Michigan Confidence (Aug P)

Survey 62.0
Actual 61.7
Prior 61.2
Revised n/a

This too looks like it has bottomed from very low levels.

‘Inflation’ still hurting confidence.


[top]

2008-07-15 US Economic Releases


[Skip to the end]


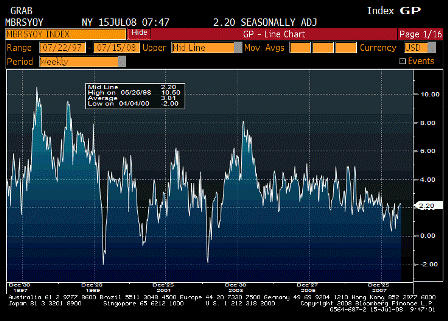
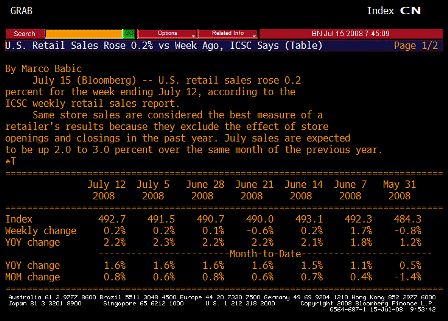
ICSC-UBS Store Sales YoY (Jun)

Survey n/a
Actual 2.2%
Prior 2.3%
Revised n/a

Fiscal spending seems to have stemmed the decline.

[top][end]

ICSC-UBS Store Sales TABLE (Jun)

Same.

[top][end]


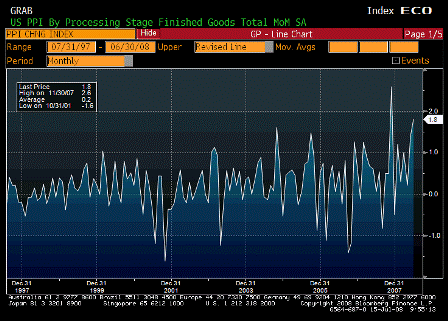
Producer Price Index MoM (Jun)

Survey 1.4%
Actual 1.8%
Prior 1.4%
Revised n/a

Looks like a banana republic with a weak currency.

[top][end]

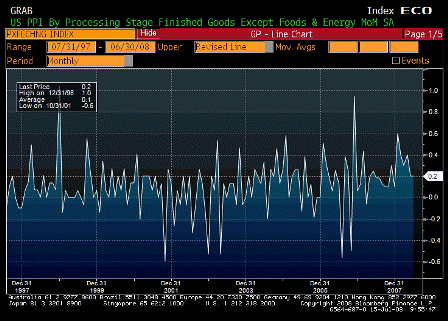
PPI Ex Food & Energy MoM (Jun)

Survey 0.3%
Actual 0.2%
Prior 0.2%
Revised n/a

Also looks to be working its way higher.

[top][end]

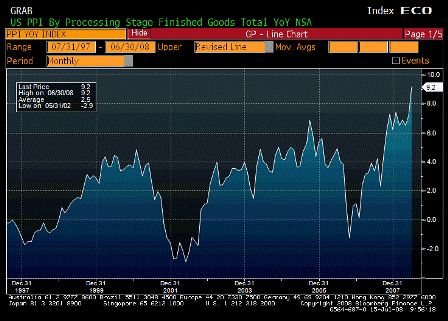
Producer Price Index YoY (Jun)

Survey 8.7%
Actual 9.2%
Prior 7.2%
Revised n/a

Inflation pouring in through the front door – import prices.

[top][end]

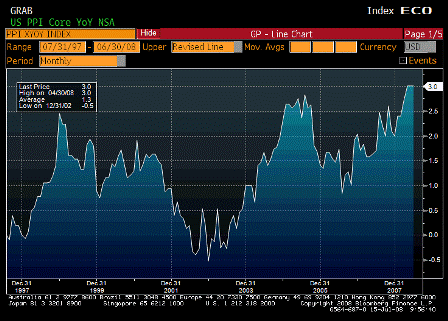
PPI Ex Food & Energy YoY (Jun)

Survey 3.2%
Actual 3.0%
Prior 3.0%
Revised n/a

Looking like its on the way up, as it’s recovered and surpassed the level of Aug 06 when Goldman changed their commodity index and triggered massive selling of gasoline.

The Fed is watching for headline to leak into core, which they’ve said is already happening.

When only food/crude/import prices go up, it’s a relative value story, as funds to buy that stuff mean less to buy other things, and they lag in price.

But in this case core measures are not going down to offset headline numbers.

True, they haven’t gone up that much yet, but they have gone up rather than down.

That means that yes, demand is ‘weak’ and unemployment creeping up,

But demand is still strong enough to support both higher headline CPI and rising core measures as well,

Supported by government spending which is not revenue constrained nor liquidity constrained,

And supported by booming exports as non residents trip over each other trying to spend their now unwanted multi $trillion hoard of US financial assets.

Current levels of demand are more than sufficient to support much higher levels of housing starts (though still low levels), relatively flat employment, and rising core inflation measures.

And US real terms of trade continue to deteriorate along with the standard of living as a foreign oil monopolist exacts ever higher relative prices.

[top][end]


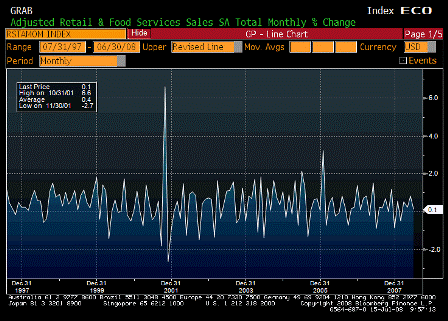
Advance Retail Sales MoM (Jun)

Survey 0.4%
Actual 0.1%
Prior 1.0%
Revised 0.8%

Lower than expected, due to weaker than expected auto sales, due to the wrong vehicles on the showroom floors, which will take a while to correct.

[top][end]

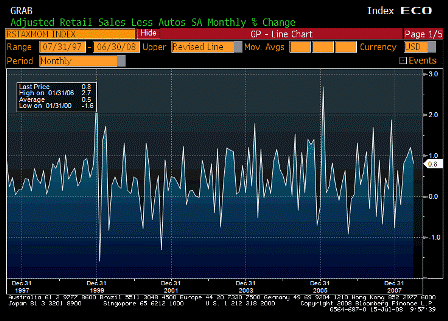
Retail Sales Less Autos MoM (Jun)

Survey 1.0%
Actual 0.8%
Prior 1.2%
Revised n/a

A little weaker than expected but pretty good from a strong previous month.

[top][end]

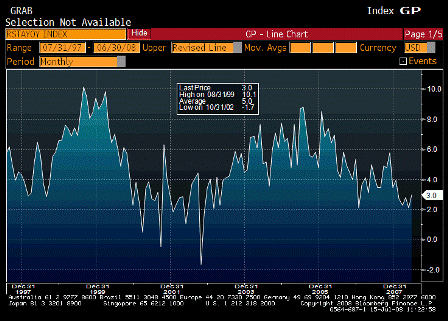
Advance Retail Sales YoY (Jun)

Survey n/a
Actual 3.0%
Prior 2.1%
Revised n/a

Once again fiscal policy, not monetary policy, stops the slide.

[top][end]


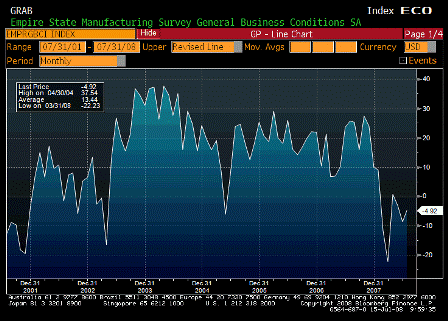
Empire Manufacturing (Jul)

Survey -8.0%
Actual -4.9%
Prior -8.7%
Revised n/a

May be on the mend from the lows.

Karim writes:

  • Retail sales a bit softer than expected..up 0.1% headline, up 0.8% ex-autos, and -0.5% ex-gas
  • Control (ex-autos, gas and building materials) up 0.3% and minor downward revisions to prior two months
  • PPI up 1.8% headline and 0.2% core; y/y 9.2% and 3.0% respectively
  • Pipeline pressures remain intense with intermediate up 2.1% m/m and crude 3.7%
  • Medical goods and services component decline (large component of PCE deflator; so June core PCE may come in 0.0% or 0.1%).
  • Empire survey shows modest improvement but stays in negative territory: -8.68 to -4.92
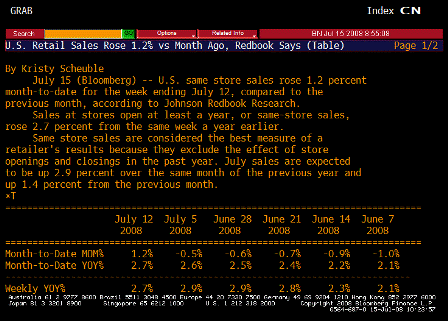
  • Right, Redbook sales show same moderate growth in non-auto sales. The wrong vehicles are on the showroom floors right now and it will take a while for the right ones to take their place.

    I have no idea what’s driving lower medical costs and whether further declines are to be expected, but seems highly unlikely.

    The dollar’s down again today.

    ‘Inflation’ is flowing in through that channel like water through a screen door on a submarine.

    [top][end]


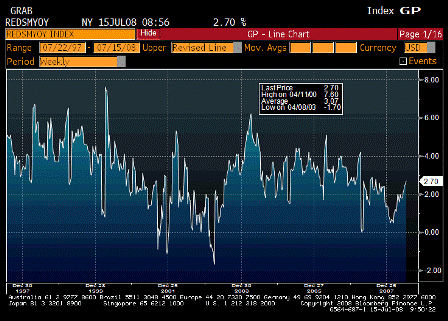
    Redbook Store Sales (Jul 8)

    Survey n/a
    Actual 2.7%
    Prior 2.6%
    Revised n/a

    Moving up as fiscal policy kicks in.

    [top][end]

    Redbook Store Sales TABLE (Jul 8)

    [top][end]


    IBD/TIPP Economics Optimism (Jul)

    Survey 36.8
    Actual 37.4
    Prior 37.4
    Revised n/a

    A little better than expected.

    [top][end]


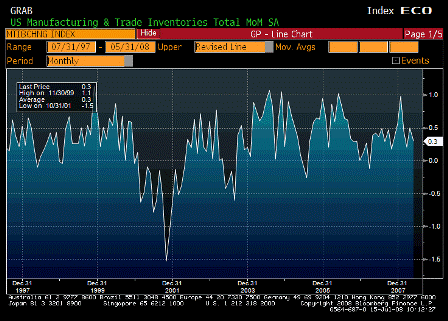
    Business Inventories (May)

    Survey 0.5%
    Actual 0.3%
    Prior 0.5%
    Revised n/a

    Possible that sales may be exceeding estimates and lowering inventories.

    [top][end]


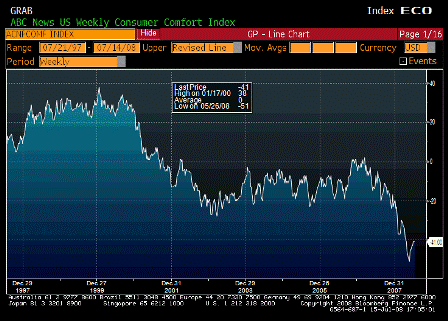
    ABC Consumer Confidence (Jul 13)

    Survey -41
    Actual -41
    Prior -41
    Revised n/a

    Seems to have bottomed, but remains at low levels, probably due to inflation.


    [top]

2008-06-16 US Economic Releases


[Skip to the end]


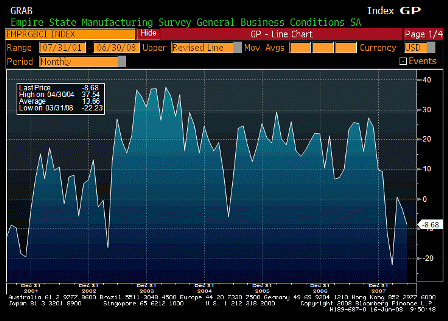
Empire Manufacturing (Jun)

Survey -2.0
Actual -8.7
Prior -3.2
Revised n/a

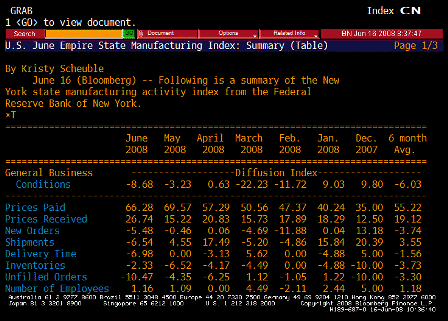
Empire Manufacturing TABLE (Jun)

Looks like the worst is over, but the economy remains on the weak side.

Prices paid still way high.

Looks like number of employees up as well.

[top][end]


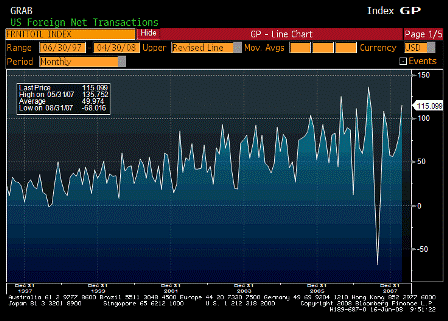
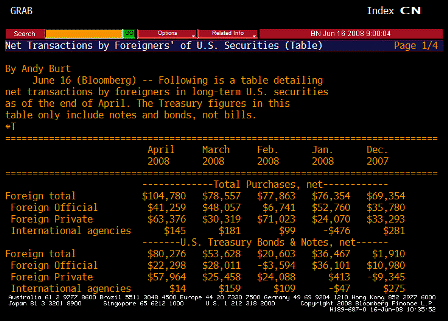
Net Long-term TIC Flows (Apr)

Survey $63.3B
Actual $115.1B
Prior $80.4B
Revised $79.6B

[top][end]

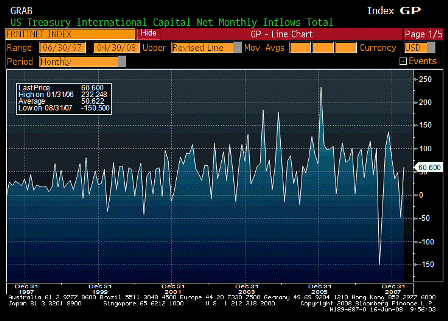
Total Net TIC Flows (Apr)

Survey $42.5B
Actual $60.6B
Prior -$48.2B
Revised $79.6B

[top][end]

TIC TABLE (Apr)

[top][end]


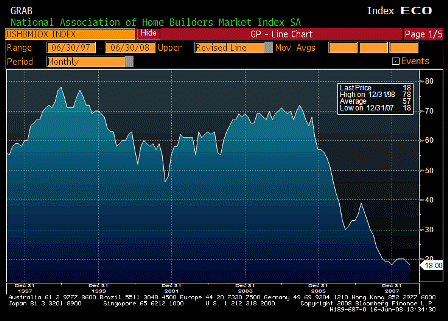
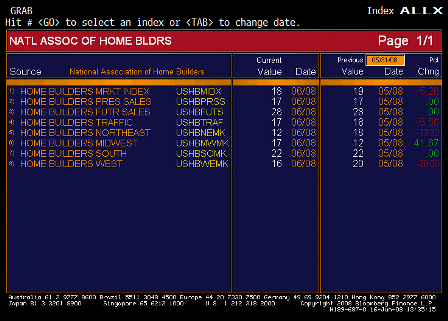
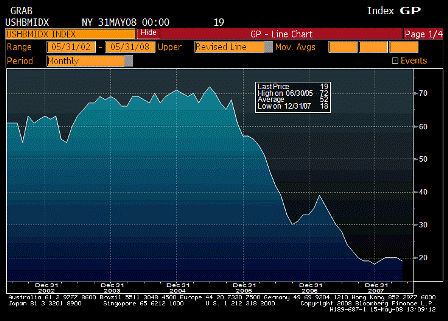
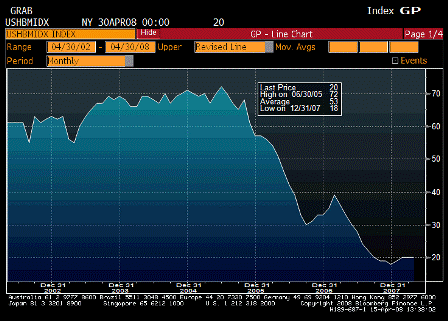
NAHB Housing Market Index (Jun)

Survey 19
Actual 18
Prior 19
Revised n/a

A bit worse than expected. Confidence is down all over due to food/crude/import prices. Might be the case here.

[top][end]

NAHB Housing Market Index (Jun)


[top]

2008-05-15 US Economic Releases


[Skip to the end]


2008-05-15 Initial Jobless Claims

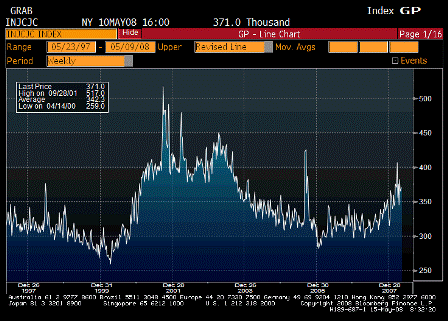
Initial Jobless Claims (May 10)

Survey 370K
Actual 371K
Prior 365K
Revised n/a

Looks like it’s past the peak.

[top][end]


2008-05-15 Continuing Claims

Continuing Claims (May 3)

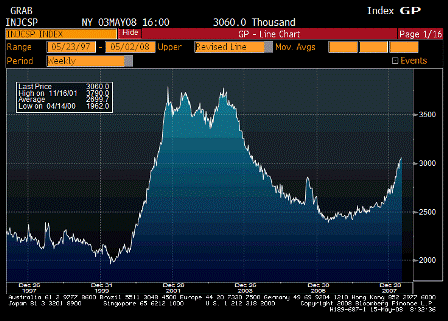
Survey 3035K
Actual 3060K
Prior 3020K
Revised 3032K

Looks like it’s not past the peak.

[top][end]


2008-05-15 Empire Manufacturing

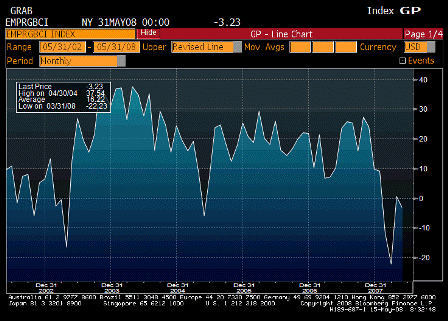
Empire Manufacturing (May)

Survey 0.0
Actual -3.2
Prior 0.6
Revised n/a

Still off the bottom, needs another month to see where it’s going.

[top][end]


2008-05-15 Net Long-term TIC Flows

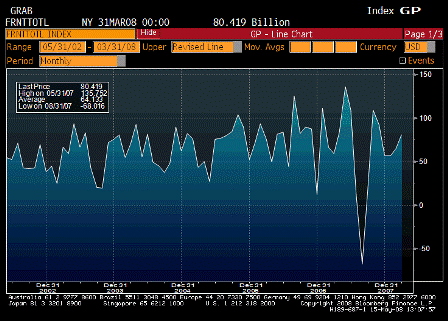
Net Long-term TIC Flows (Mar)

Survey $62.5B
Actual $80.4B
Prior $72.5B
Revised $64.9B

[top][end]


2008-05-15 Total Net TIC Flows

Total Net TIC Flows (Mar)

Survey $67.5B
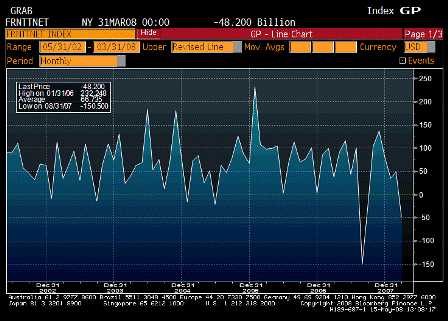
Actual -$48.2B
Prior $64.1B
Revised $48.9B

In general I expect these types of numbers to follow the trade gap down.

[top][end]


2008-05-15 Industrial Production

Industrial Production (Apr)

Survey -0.3%
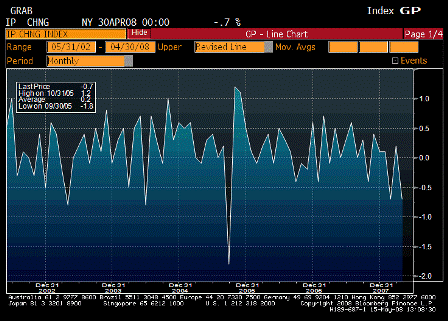
Actual -0.7%
Prior 0.3%
Revised 0.2%

Still weak. Been weak for 50 years.

[top][end]


2008-05-15 Capacity Utilization

Capacity Utilization (Apr)

Survey 80.1%
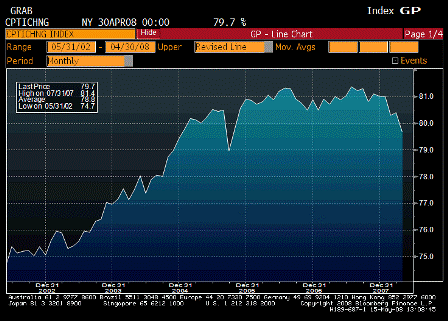
Actual 79.7%
Prior 80.5%
Revised 80.4%

Weak, but not recession levels yet.

[top][end]


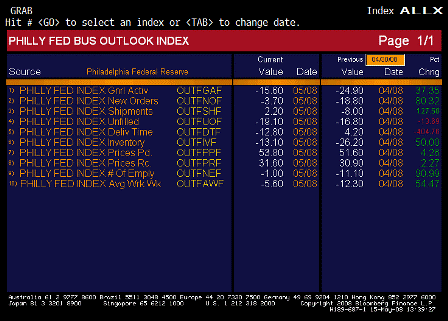
2008-05-15 Philadelphia Fed.

Philadelphia Fed. (May)

Survey -19.0
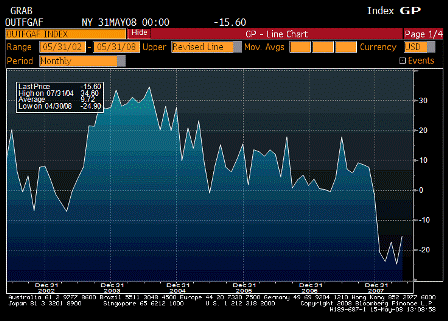
Actual -15.6
Prior -24.9
Revised n/a

2008-05-15 Philadelphia Fed. TABLE

Philadelphia Fed. TABLE

Perking up from low levels,
prices high and moving higher

[top][end]


2008-05-15 NAHB Housing Market Index

NAHB Housing Market Index (May)

Survey 20
Actual 19
Prior 20
Revised n/a

Still off the lows and looking like a bottom to me.


[top]

2008-04-15 US Economic Releases

  • Producer Price Index
  • Empire Manufacturing
  • NAHB Housing Market Index
  • ABC Consumer Confidence

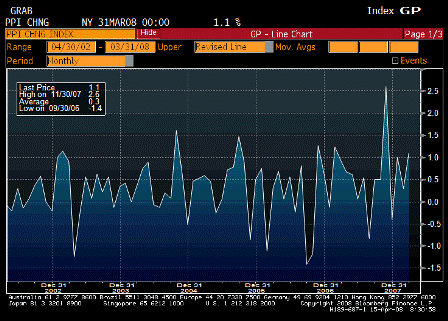
2008-04-15 Producer Price Index MoM

Producer Price Index MoM (Mar)

Survey 0.6%
Actual 1.1%
Prior 0.3%
Revised n/a

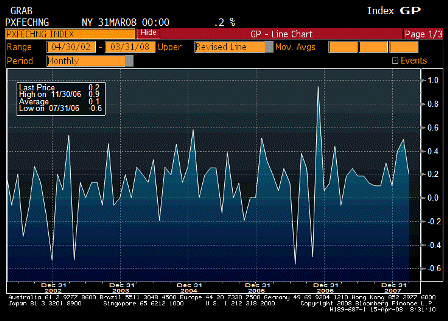
2008-04-15 PPI Ex Food & Energy MoM

PPI Ex Food & Energy MoM (Mar)

Survey 0.2%
Actual 0.2%
Prior 0.5%
Revised n/a

2008-04-15 Producer Price Index YoY

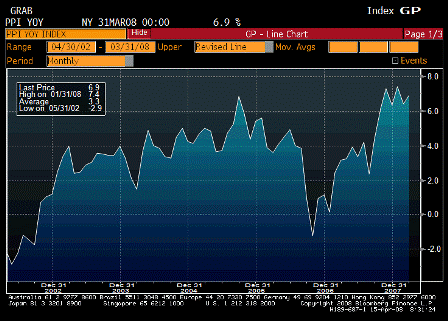
Producer Price Index YoY (Mar)

Survey 6.2%
Actual 6.9%
Prior 6.4%
Revised n/a

2008-04-15 PPI Ex Food & Energy YoY

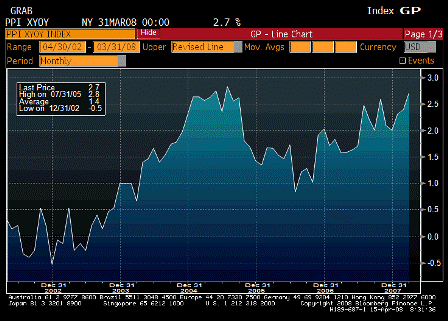
PPI Ex Food & Energy YoY (Mar)

Survey 2.8%
Actual 2.7%
Prior 2.4%
Revised n/a

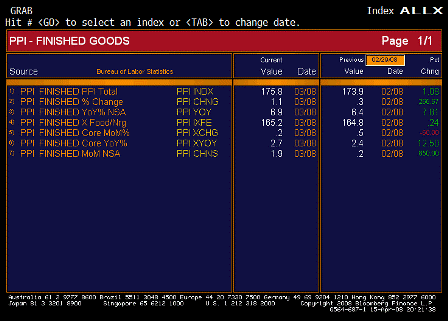
2008-04-15 Producer Price Index TABLE

Producer Price Index TABLE

Inflation ripping.

From Karim:

Headline/Core divergence continues

  • Headline up 1.1% m/m and 6.9% y/y

  • Core up 0.2% m/m and 2.7% y/y

  • Food (+1.2%) and gas (+1.3%) lead the way up, computers (-3.2%) and passenger cars (-0.2%) lead the way down.

  • Intermediate and crude pressures remain intense, rising 2.3% and 8.0% respectively for the month

  • Further margin squeeze likely to put further downward pressure on capex, especially in light of weak economy and credit conditions (see below)

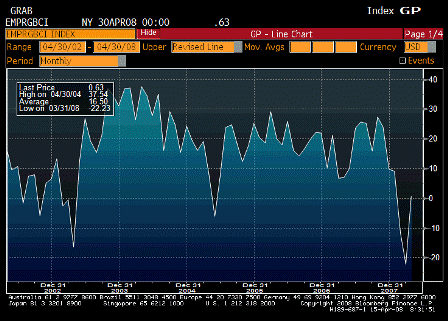
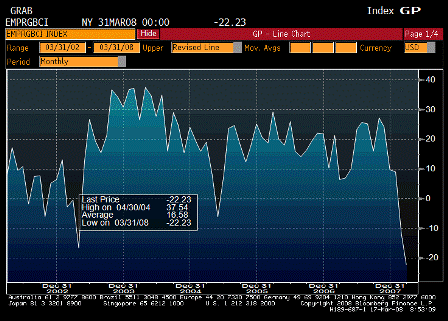
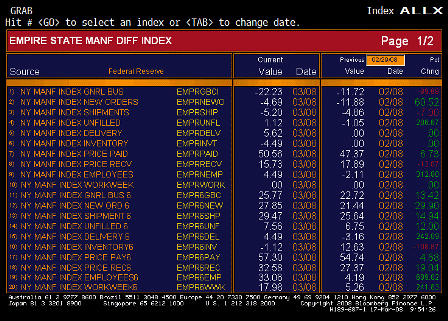
Empire jumps from -22.2 to 0.6. Index quite volatile and 10-20 point moves per month the norm as of late.

6mth expectations deteriorate from 25.8 to 19.6.

  • Shipments show largest jump from -5 to +17 (for current conditions)

  • Employment and average workweek both extremely weak

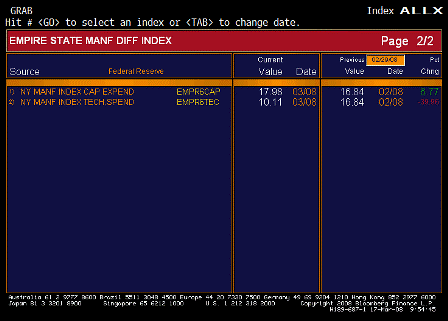
  • Capex intentions fall from 18 to 11.5

2008-04-15 Empire Manufacturing

Empire Manufacturing (Apr)

Survey -17.0
Actual 0.6
Prior -22.2
Revised n/a

Survey is colored by subjective recessions fears bouncing back some.


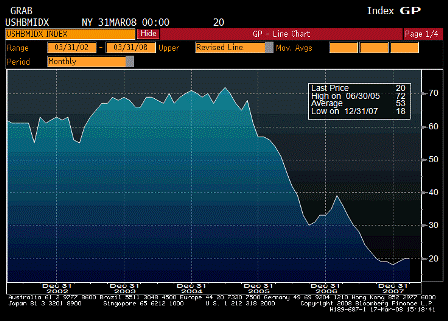
2008-04-15 NAHB Housing Market Index

NAHB Housing Market Index (Apr)

Survey 20
Actual 20
Prior 20
Revised n/a

Still looks to me like a bottom.


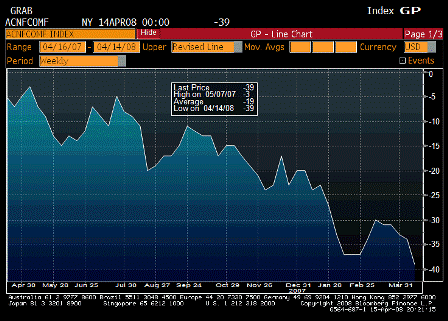
2008-04-15 ABC Consumer Confidence

ABC Consumer Confidence (Apr 13)

Survey n/a
Actual -39
Prior -34
Revised n/a

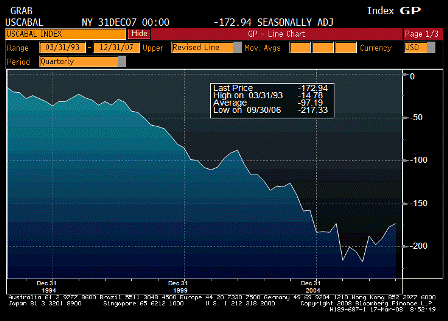
Still looking weak. Much like an export economy

2008-02-15 US Economic Releases

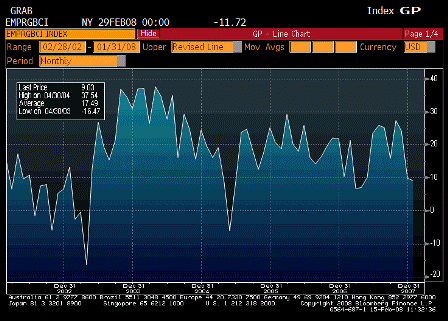
2008-02-15 Empire Manufacturing

Empire Manufacturing (Feb)

Survey 6.5
Actual -11.7
Prior 9.0
Revised n/a

Down, but it has been lower, not yet to previous recession levels.


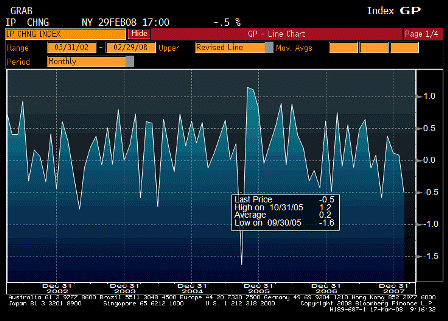
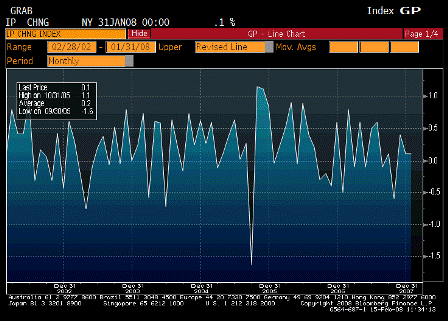
2008-02-15 Industrial Production

Industrial Production (Jan)

Survey 0.1%
Actual 0.1%
Prior 0.0%
Revised 0.1%

Modestly positive, and not at recession levels.


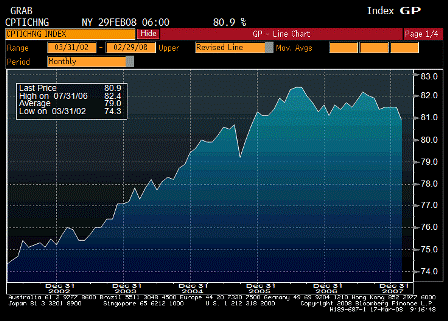
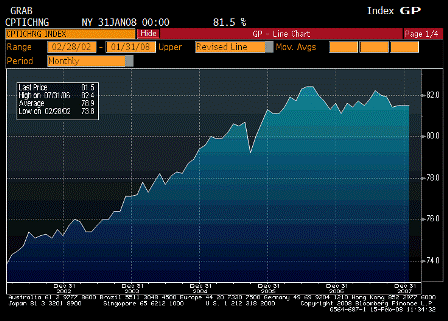
2008-02-15 Capacity Utilization

Capacity Utilization (Jan)

Survey 81.3%
Actual 81.5%
Prior 81.4%
Revised 81.5%

Holding up reasonably well.


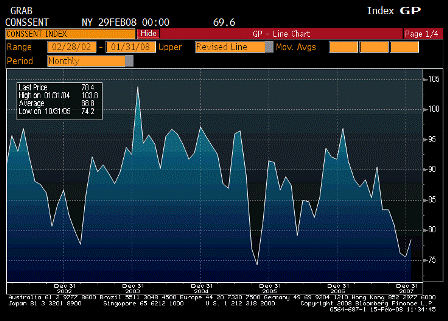
2008-02-15 U. of Michigan Confidence

U. of Michigan Confidence (Feb P)

Survey 76.0
Actual 69.6
Prior 78.4
Revised n/a

The CNBC effect keeping expectations down.

One year inflation expectations jumped to 3.7% putting the Fed on high alert.


♥

2008-01-15 US Economic Releases

2008-01-15 Producer Price Index MoM

Producer Price Index MoM (Dec)

Survey 0.2%
Actual -0.1%
Prior 3.2%
Revised n/a

2008-01-15 PPI Ex Food & Energy MoM

PPI Ex Food & Energy MoM (Dec)

Survey 0.2%
Actual 0.2%
Prior 0.4%
Revised n/a

2008-01-15 Producer Price Index YoY

Producer Price Index YoY (Dec)

Survey 7.1%
Actual 6.3%
Prior 7.2%
Revised n/a

2008-01-15 PPI Ex Food & Energy YoY

PPI Ex Food & Energy YoY (Dec)

Survey 2.0%
Actual 2.0%
Prior 2.0%
Revised n/a

Inflation pressures remain alarming.

2007 highest inflation since the early 1980s, when inflation was on the way down.

Last hit this number on the way up was in the 1970s.


2008-01-15 Advance Retail Sales

Advance Retail Sales (Dec)

Survey 0.0%
Actual -0.4%
Prior 1.2%
Revised 1.0%

Previous month still very high, two month average looks OK.


2008-01-15 Retail Sales YoY % Change

Retail Sales YoY % Change

Year over year numbers still modestly moving back up.


2008-01-15 Retail Sales Less Autos

Retail Sales Less Autos (Dec)

Survey -0.1%
Actual -0.4%
Prior 1.8%
Revised 1.7%

Same as above.


2008-01-15 Empire Manufacturing

Empire Manufacturing (Jan)

Survey 10.0
Actual 9.0
Prior 10.3
Revised 9.8

2008-01-15 Empire Manufacturing TABLE

Empire Manufacturing TABLE

A close look at the table shows prices still very strong.


2008-01-15 Business Inventories

Business Inventories (Nov)

Survey 0.4%
Actual
Prior 0.1%
Revised

Chart looks OK – no excessive build.


Data not in, until 5PM EST..

ABC Consumer Confidence (Jan 13)

Survey -21
Actual
Prior -20
Revised

♥