OPEC leader vows not to cut oil output even if price hits $20

The Saudis never ‘cut production’

They just set price and let the world buy what it wants at their price.

No one seems to know that.

As no one ever asks if they are going to raise price.

OPEC leader vows not to cut oil output even if price hits $20

“It is not in the interest of Opec producers to cut their production, whatever the price is,” he told the Middle East Economic Survey.

“Whether it goes down to $20, $40, $50, $60, it is irrelevant.”

In the MEES interview, Mr Naimi said Saudi Arabia and other Gulf oil producers would be able to withstand a long period of low crude prices, largely because their production costs were so low — at only about $4-$5 a barrel.


But he said the pain will be much greater for other oil regions, such as offshore Brazil, west Africa and the Arctic, whose costs are much
higher.

“So sooner or later, however much they hold out, in the end, their financial affairs will limit their production,” he said.

“We want to tell the world that high efficiency producing countries are the ones that deserve market share,” said Mr Naimi added. “If the
price falls, it falls . . . Others will be harmed greatly before we feel any pain.”

The bluntness of Mr Naimi’s message took even seasoned Opec observers by surprise. “I’m more bearish than most people looking at the
oil price, but even I am stunned how aggressive his comments are about this radical departure from policy,” said Yasser Elguindi of
Medley Global Advisors.

Wither exports and oil rigs

The narrative is that as foreign oil producers see their incomes fall, directly or indirectly they will fewer US goods and services, aka, US exports.

Just read the highlighted part about exports:

Kansas City Fed Manufacturing Index
kc-manu-index
Highlights
Tenth District manufacturing activity continued to expand at a moderate pace in December, and producers’ expectations for future activity remained at solid levels. Most price indexes grew at a slower pace, especially materials prices.

The month-over-month composite index was 8 in December, up slightly from 7 in November and 4 in October. The composite index is an average of the production, new orders, employment, supplier delivery time, and raw materials inventory indexes. The slight increase in activity was mostly attributed to durable goods producers, particularly for electronics, aircraft, and machinery products, while nondurable goods production remained sluggish. Most other month-over-month indexes were also slightly higher than last month. The production and employment indexes were unchanged, but the shipments, new orders, and order backlog indexes increased markedly.

However, the new orders for exports index fell from 8 to 0. The finished goods inventory index rose for the second straight month, while the raw materials inventory index eased somewhat.

November 2014 Sea Container Counts Continue to Show Rapid Contraction of Exports

Written by Steven Hansen

Export container counts continue to weaken, which is a warning that the global economy is slowing. Export three month rolling averages continue to decelerate – being in negative territory year-over-year. This is a headwind for 4Q2014 GDP.Container counts are a good metric to gauge the economy.

Keeping an eye on this as well- North Dakota and Texas unemployment claims.

North Dakota 4 week moving average, year over year moving up some but nothing serious yet:
nd-claims

Same for Texas:
tx-claims

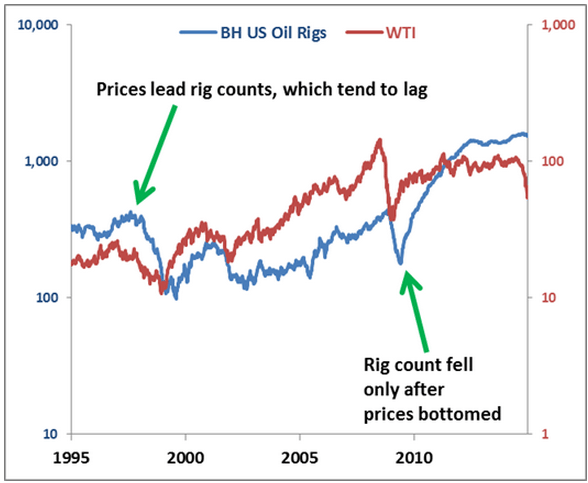
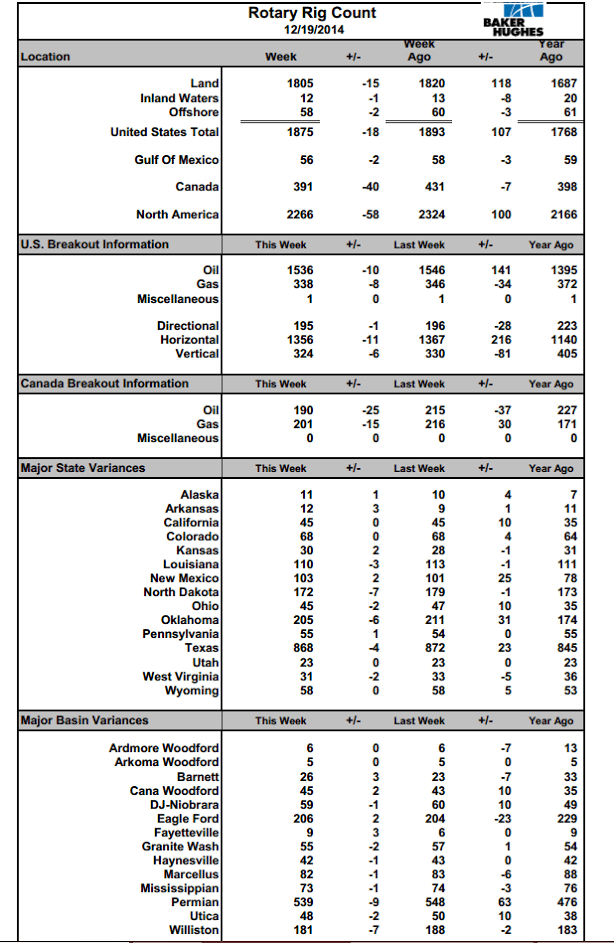
And oil rigs in service now heading south:

oil-rigs

oil-rigs-2

Posted in Oil

Bankers See $1 Trillion of Zombie Investments Stranded in the Oil Fields

Wonder if Janet factored this in?

Bankers See $1 Trillion of Zombie Investments Stranded in the Oil Fields

By Tom Randall

Dec 18 (Bloomberg) — There are zombies in the oil fields.

After crude prices dropped 49 percent in six months, oil projects planned for next year are the undead — still standing upright, but with little hope of a productive future. These zombie projects proliferate in expensive Arctic oil, deepwater-drilling regions and tar sands from Canada to Venezuela.

In a stunning analysis this week, Goldman Sachs found almost $1 trillion in investments in future oil projects at risk. They looked at 400 of the world’s largest new oil and gas fields — excluding U.S. shale — and found projects representing $930 billion of future investment that are no longer profitable with Brent crude at $70. In the U.S., the shale-oil party isn’t over yet, but zombies are beginning to crash it.

Yellen vs Mosler

At her press conference Janet Yellen stated that the net effect of the drop in oil prices is that of a tax cut, and therefore supportive of US output and employment.

My take is that the cuts in spending due to both the equal income lost by oil producers as well as the reduced ‘borrowing to spend’/credit expansion results in a net reduction of aggregate demand of hundreds of $ billions.

The Fed spends over $100 million on research, which is more than double what I spend, so take that into consideration as well.

So it makes sense for the markets to go with the Fed, which would mean stocks go back through the highs, and rates rise in anticipation of Fed rate hikes as the ‘oil tax cut’ does its thing to accelerate sales/output/employment.

;)

Brent crude held steady above $61 a barrel on Thursday, bringing a sharp drop in prices to a temporary halt as companies are forced to cut upstream investments around the world.

Chevron has put a plan to drill for oil in the Beaufort Sea in Canada’s Arctic on hold indefinitely, while Marathon Oil cut its capital expenditure for next year by about 20 percent.

Canadian oil producers also deepened 2015 spending cuts, as Husky Energy, MEG Energy and Penn West Petroleum joined those hacking back capital budgets in response to tumbling crude prices.

Comments on crude pricing, the economy, and the banking system

Crude pricing

The Saudis are the ‘supplier of last resort’/swing producer. Every day the world buys all the crude the other producers sell to the highest bidder and then go to the Saudis for the last 9-10 million barrels that are getting consumed. They either pay the Saudis price or shut the lights off, rendering the Saudis price setter/swing producer.

Specifically, the Saudis don’t sell at spot price in the market place, but instead simply post prices for their customers/refiners and let them buy all they want at those prices.

And most recently the prices they have posted have been fixed spreads from various benchmarks, like Brent.

Saudi spread pricing works like this:
Assume, for purposes of illustration, Saudi crude would sell at a discount of $1 vs Brent (due to higher refining costs etc.) if they let ‘the market’ decide the spread by selling a specific quantity at ‘market prices’/to the highest bidder. Instead, however, they announce they will sell at a $2 discount to Brent and let the refiners buy all they want.

So what happens?
The answer first- this sets a downward price spiral in motion. Refiners see the lower price available from the Saudis and lower the price they are willing to pay everyone else. And everyone else is a ‘price taker’ selling to the highest bidder, which is now $1 lower than ‘indifference levels’. When the other suppliers sell $1 lower than before the Saudi price cut/larger discount of $1, the Brent price drops by $1. Saudi crude is then available for $1 less than before, as the $2 discount remains in place. Etc. etc. with no end until either:
1) The Saudis change the discount/raise their price
2) Physical demand goes up beyond the Saudis capacity to increase production

And setting the spread north of ‘neutral’ causes prices to rise, etc.

Bottom line is the Saudis set price, and have engineered the latest decline. There was no shift in net global supply/demand as evidenced by Saudi output remaining relatively stable throughout.

The Global Economy

If all the crude had simply been sold to the highest bidder/market prices, in a non monetary relative value world the amount consumed would have been ‘supply limited’ based on the real marginal cost, etc. And if prices were falling do to an increased supply offered for sale, the relative price of crude would be falling as the supply purchased and consumed rose. This would represent an increase in real output and real consumption/real GDP(yes, real emissions, etc.)

However, that’s not the case with the Saudis as price setter. The world was not operating on a ‘quantity constrained’ basis as the Saudis were continuously willing to sell more than the world wanted to purchase from them at their price. If there was any increase in non Saudi supply, total crude sales/consumption remained as before, but with the Saudis selling that much less.

Therefore, with the drop in prices, at least in the near term, output/consumption/GDP doesn’t per se go up.

Nor, in theory, in a market economy/flexible prices, does the relative value of crude change. Instead, all other prices simply adjust downward in line with the drop in crude prices.

Let me elaborate.
In a market economy (not to say that we actually have one) only one price need be set and with all others gravitating towards ‘indifference levels’. In fact, one price must be set or it’s all a ‘non starter’. So which price is set today? Mainstream economists ponder over this, and, as they’ve overlooked the fact that the currency is a public monopoly, have concluded that the price level exists today for whatever ‘historic’ reasons, and the important question is not how it got here, but what might make it change from today’s level. That is, what might cause ‘inflation’. That’s where inflation expectations theory comes in. For lack of a better reason, the ‘residual’ is that it’s inflation expectations that cause changes in the price level. And not anything else, which are relative value stories. And they operate through two channels- workers demanding higher wages and people accelerating purchases. Hence the fixation on wages as the cause of inflation, and using ‘monetary policy’ to accelerate purchases, etc.

Regardless of the ‘internal merits’ of this conclusion, it’s all obviated by the fact that the currency itself is a simple public monopoly, rendering govt price setter. Note the introduction of monetary taxation, the basis of the currency, is coercive, and obviously not a ‘market expense’ for the taxpayer, and therefore the idea of ‘neutrality’ of the currency in entirely inapplicable. In fact, since the $ to pay taxes and buy govt secs, assuming no counterfeiting, ultimately come only from the govt of issue, (as they say in the Fed, you can’t have a reserve drain without a prior reserve add), the price level is entirely a function of prices paid by the govt when it spends and/or collateral demanded when it lends. Said another way, since we need the govt’s $ to pay taxes, the govt is, whether it knows it or not, setting ‘terms of exchange’ when it buys our goods and service.

Note too that monopolists set two prices, the value of their product/price level as just described above, and what’s called the ‘own rate’/how it exchanges for itself, which for the currency is the interest rate, which is set by a vote at the CB.

The govt/mainstream, of course, has no concept of all this, as inflation expectations theory remains ‘well anchored.’ ;)

In fact, when confronted, argues aggressively that I’m wrong (story of my life- remember, they laughed at the Yugo…)

What they have done is set up a reasonably deflationary purchasing program, of buying from the lowest bidder in competition, and managed to keep federal wages/compensation a bit ‘behind the curve’ as well, partially indexed to their consumer price index, etc.

And consequently, govt has defacto advocated pricing power to the active monopolist, the Saudis, which explains why changes in crude prices and ‘inflation’ track as closely as they do.

Therefore, the way I see it is the latest Saudi price cuts are revaluing the dollar (along with other currencies with similar policies, which is most all of them) higher. A dollar now buys more oil and, to the extend we have a market economy that reflects relative value, more of most everything else. That is, it’s a powerful ‘deflationary bias’ (consequently rewarding ‘savers’ at the expense of ‘borrowers’) without necessarily increasing real output.

In fact, real output could go lower due to an induced credit contraction, next up.

Banking

Deflation is highly problematic for banks. Here’s what happened at my bank to illustrate the principle:

We had a $6.5 million loan on the books with $11 million of collateral backing it. Then, in 2009 the properties were appraised at only $8 million. This caused the regulators to ‘classify’ the loan and give it only $4 million in value for purposes of calculating our assets and capital. So our stated capital was reduced by $2.5 million, even though the borrower was still paying and there was more than enough market value left to cover us.

So the point is, even with conservative loan to value ratios of the collateral, a drop in collateral values nonetheless reduces a banks reported capital. In theory, that means if the banking system needs an 8% capital ratio, and is comfortably ahead at 10%, with conservative loan to value ratios, a 10% across the board drop in assets prices introduces the next ‘financial crisis’. It’s only a crisis because the regulators make it one, of course, but that’s today’s reality.

Additionally, making new loans in a deflationary environment is highly problematic in general for similar reasons. And the reduction in ‘borrowing to spend’ on energy and related capital goods and services is also a strong contractionary bias.

UPDATE: Saudi Arabia cuts all oil prices to U.S., Asia – Bloomberg (OIL)

Dec 4 — Saudi Arabia cuts all oil prices to U.S. and Asia, according to Bloomberg headlines.

UPDATE: Reports have the message issued by Saudi Aramco — the state-owned oil and gas giant — now recalled.

ADP, mtg purch apps, Productivity, ISM, oil and gas well permits

Remember, this is their forecast for Friday, not hard data from their subscribers:

ADP Employment Report
eco-1
Highlights
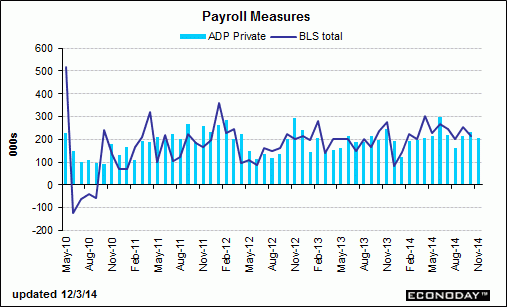
ADP’s estimate for private payroll growth for November is 208,000 vs the Econoday consensus for 225,000 and against a revised 233,000 for October. The corresponding Econoday consensus for Friday’s jobs report from the government is 225,000 vs October’s 209,000.

Both ADP and the BLS data have shown new jobs working their way lower after peaking earlier in the year after dipping for the cold winter and at the same time absorbing some of the 1.2 million who lost benefits at year end and subsequently took menial jobs:
eco-2

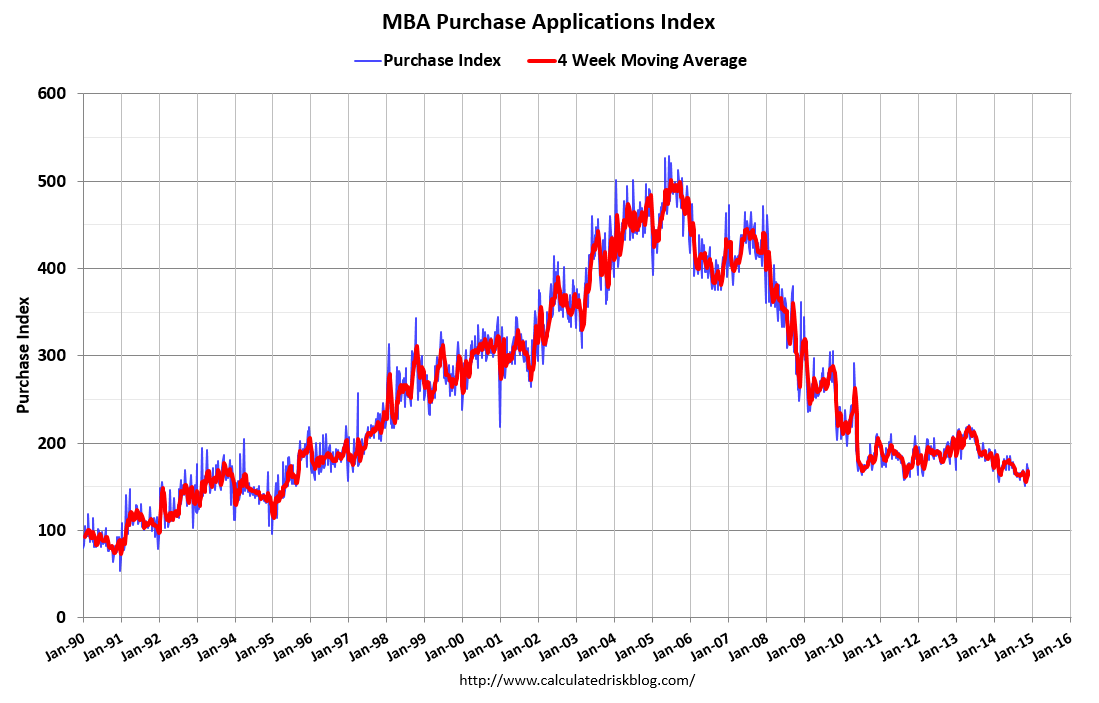
Mtg purchase apps still down year over year and moving sideways at best:

MBA Purchase Applications
eco-3
Highlights
The purchase index snapped back in the holiday shortened November 28 week, rising 3.0 percent after falling 10.0 percent in the prior week. The gain helped the year-on-year reading which improved to minus 4.0 percent from minus 10.0 percent. The refinance index, however, continues its long run in negative trend, down a steep 13.0 percent for a sixth straight decline. Rates were mostly lower in the week with the average 30-year mortgage for conforming loans ($417,000 or less) down 7 basis points in the week to 4.08 percent.
eco-4

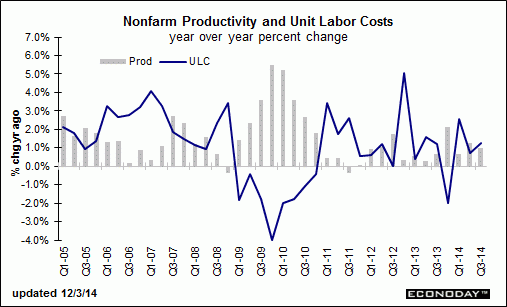
The decline in unit labor costs might be of interest to the Fed:

Productivity and Costs
eco-5
Highlights
Nonfarm productivity growth for the third quarter was revised up to an annualized 2.3 percent from the first estimate of 2.0 percent and following a 2.9 percent boost in the second quarter. Unit labor costs were revised down notably to minus 1.0 percent from a first estimate of up 0.3 percent after falling an annualized 3.7 percent in the second quarter.

Output growth slowed to 4.9 percent in the third quarter, following a 5.5 percent jump the prior quarter. Compensation growth in the third quarter was up 1.3 percent annualized after a dip of 0.9 percent the previous period.

Year-on-year, productivity was up 1.0 percent in the third quarter, down from 1.3 percent in the second quarter. Year-ago unit labor costs were up 1.2 percent, compared to up 0.7 percent in the second quarter.

The latest productivity report points to positive company profits and mild gains in consumer income.
eco-6

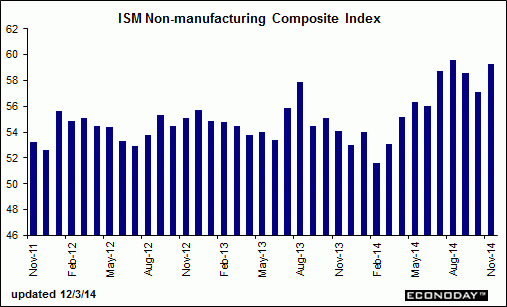
Good news on the ISM survey, though the employment index fell:

ISM Non-Mfg Index
eco-7
Highlights
ISM’s non-manufacturing sample reports very solid conditions, at a composite 59.3 in November vs 57.1 in October. Aside from August’s 59.6, November is a recovery high going back more than 9 years. New orders are very strong, up 2.3 points in the month to 61.4 with backlog orders up 4.0 points to 55.5 in a reading last matched in April 2011. Strength in orders is keeping up business activity which rose 4.4 points to a very strong 64.4. Employment remains solid but did slow 2.9 points from October’s near record of 59.6. Deliveries slowed noticeably, which is another sign of strength, while inventories rose. Pressures on input prices rose a bit to 54.4 which, however, is still benign for this reading. A look at industries shows the retail sector at top, which of course is very good news going into the holidays, and construction right behind which is also very good news. This report points to solid year-end acceleration for the economy.

eco-8

Meanwhile, the oil drilling slowdown might be on the high side of expectations:

Exclusive: New U.S. oil and gas well November permits tumble nearly 40 percent

By Kristin Hays

Dec 2 (Reuters) — Plunging oil prices sparked a drop of almost 40 percent in new well permits issued across the United States in November, in a sudden pause in the growth of the U.S. shale oil and gas boom that started around 2007.

Data provided exclusively to Reuters on Tuesday by industry data firm Drilling Info Inc showed 4,520 new well permits were approved last month, down from 7,227 in October.

The pullback was a “very quick response” to U.S. crude prices, which settled on Tuesday at $66.88 CLc1, said Allen Gilmer, chief executive officer of Drilling Info.

New permits, which indicate what drilling rigs will be doing 60-90 days in the future, showed steep declines for the first time this year across the top three U.S. onshore fields: the Permian Basin and Eagle Ford in Texas and North Dakota’s Bakken shale.

The Permian Basin in West Texas and New Mexico showed a 38 percent decline in new oil and gas well permits last month, while the Eagle Ford and Bakken permit counts fell 28 percent and 29 percent, respectively, the data showed.

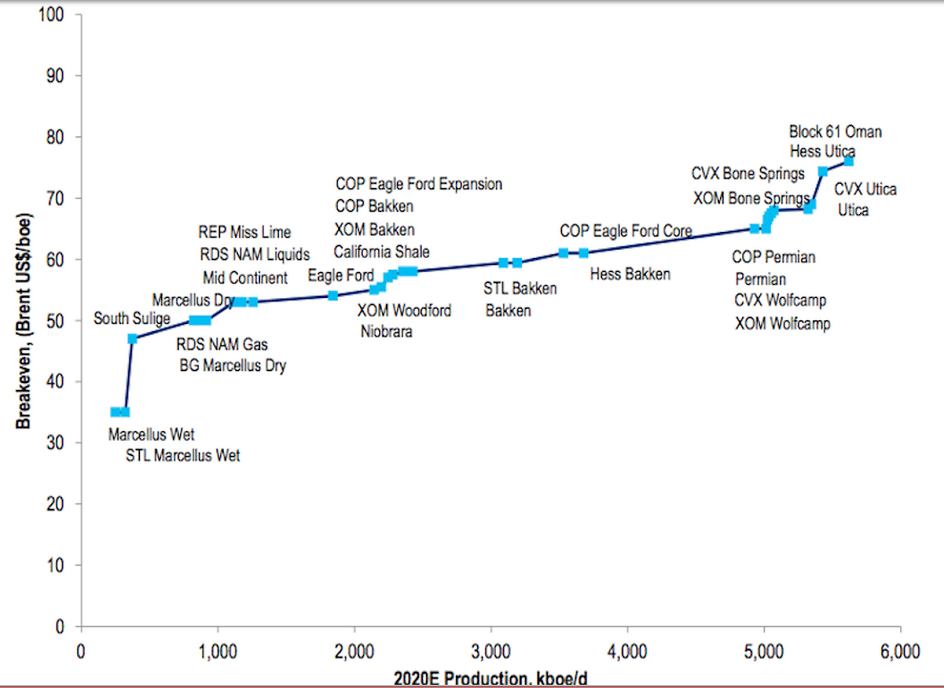
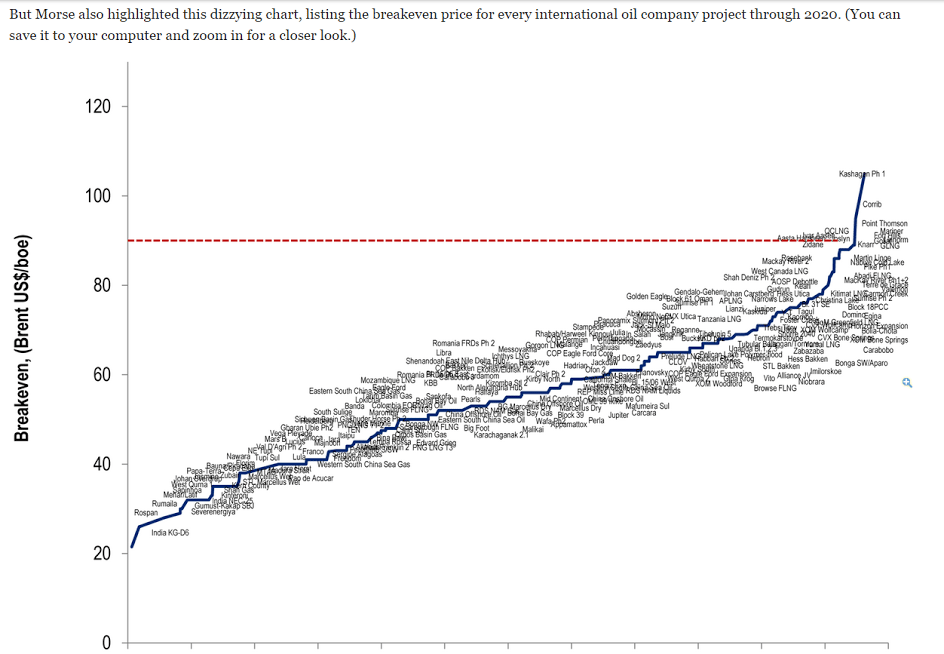
Crude break evens for drillers, construction spending

If you can buy oil cheaper in the fwd and futures markets why bother to drill for it?
;)

Charts from Citi:
co-be-1

co-be-2

Construction Spending
cs-oct-table
Highlights
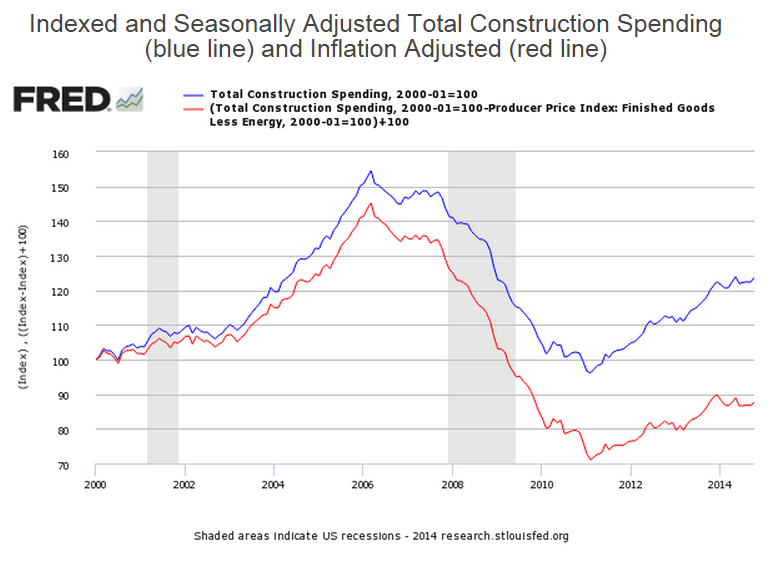
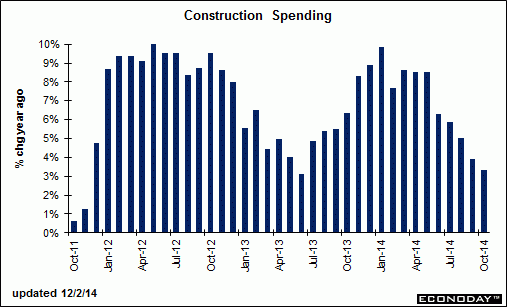
Construction outlays rebounded significantly on public outlays and the private residential component. Construction spending jumped 1.1 percent in October after a 0.1 percent dip in September. Market expectations were for a 0.6 percent boost.

October’s increase was led by public outlays which rebounded 2.3 percent after a 1.6 percent fall in September. Private residential spending gained 1.3 percent, following an increase of 0.8 percent the month before.

Private nonresidential construction spending slipped 0.1 percent, following a rise of 0.2 percent in September.

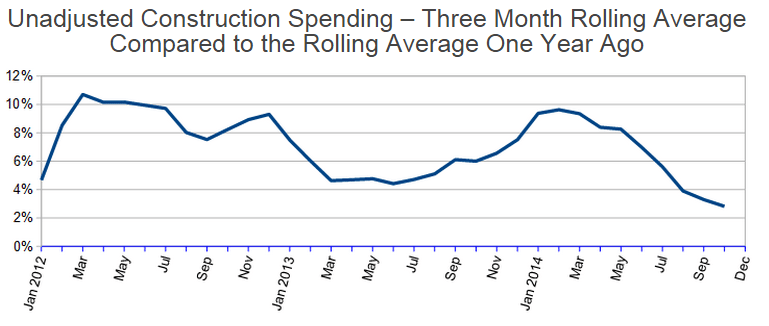
Note that the year over year growth rate is declining, and looks like it isn’t growing as fast this year as last year:

cs-oct