personal income and consumption charts and comments, and a word on oil

This is after tax personal income not adjusted for inflation. Note that there was anticipation of an acceleration from the first quarter, but now it looks like the growth has slowed and rolled over:

11-28-1

Here you can see how it was growing steadily, then shifted down when my payroll tax holiday expired, sort of resumed growing at the same rate, and now may be falling off, even with what the mainstream call ‘solid’ payroll growth:

11-28-2
Likewise, there’s been a lid on the growth personal consumption expenditures where the growth rate dipped for the cold winter, recovered, and then fell off some:

11-28-3

11-28-4

Adjusted for inflation/cpi the pattern is the same:

11-28-5

Oil- Not all that much to it.

The Saudis remain price setter as a simple point of logic.

No telling what their price target may be at any time, but they simply set price for their refiners and let them buy all they want at that price. And no one else has the excess capacity to do that.

Possible motives?

Put high priced producers out of business with $trillions of losses to make sure that when the subsequently raise prices to 150(?) new investment in high priced crude will then be considered to risky for anyone to finance?

And/or it’s not illegal for insiders to have gotten short for their personal accounts prior to the price cuts and subsequently covering prior to increasing prices, functionally transferring a bit of wealth from the state to private accounts?

Ramifications for the US:

US consumers helped a bit- about $100 billion/year last I heard?

Capex gets hurt by at least that much?

Trillions in value lost from loans and investments going south?

Thousands of high paying jobs lost in North Dakota, etc. due to reduced capex?

(EU not so much as they don’t invest nearly as much in high priced energy exploration/production?)

Canada, Mexico, Venezuela, Australia etc. economies and related securities/investments toast?

etc.

capital expenditures

With energy investment now in decline due to the Saudi price cuts look for this component of GDP to head south, as yet another ‘borrowing to spend’ generator fails to sustain its growth rate and odds of negative Q4 GDP growth increase dramatically.

cap-ex-1

cap-ex-2

Shale Drillers Idle Rigs From Texas to Utah Amid Oil Rout

By Lynn Doan

Nov 7 (Bloomberg) — The shale-oil drilling boom in the U.S. is showing early signs of cracking.

Rigs targeting oil sank by 14 to 1,568 this week, the lowest since Aug. 22, Baker Hughes Inc. (BHI) said yesterday. The Eagle Ford shale formation in south Texas lost the most, dropping nine to 197. The nation’s oil rig count is down from a peak of 1,609 on Oct. 10.

Posted in Oil

Mortgage Apps, Saudi oil output

Not good!

MBA Purchase Applications


Highlights
Mortgage activity was steady in the September 26 week, unchanged for the purchase index and down 0.3 percent for the refinance index. The purchase index remains depressed compared to last year, down 11 percent. A move lower in rates during the week didn’t help activity. The average 30-year conforming mortgage ($417,000 or less) fell 6 basis points to 4.33 percent.

Still strong demand for Saudi crude as they set price and let quantity adjust.

The question is what price they set.


Full size image

Saudis cut price- target could be $75?

I missed this when it first came out a few days ago.

This could be serious, as the plan could be to cut price low enough to put the higher priced producers out of business, which they can easily do. This includes all the shale and tar sands producers, for example.

And once that happens, with $trillions(?) of lost investments, it will be that much more difficult to raise capital to restart that production after the Saudis subsequently raise prices to the $150 level?

This article on the price cuts misses the above point entirely:

Saudi Arabia cuts October crude prices

By By Anjli Raval, Oil and Gas Correspondent

Sept 5 (FT) — Saudi Arabia cut October selling prices this week to customers in Asia, Europe and the US, in a sign that Opec’s largest producer is unlikely to curb production even amid an excess of crude oil supply.

The state-owned oil company Aramco reduced prices for its main oil export grade – Arab Light – to Asia by $1.70 a barrel in October from September, to a discount of 5 cents a barrel to the Oman-Dubai benchmark.

Prices to the Mediterranean fell by 95 cents a barrel, to a discount of $3.20 against the Brent benchmark. The same grade going to the US and northwest Europe declined by 40 and 70 cents respectively to the Argus Sour Crude Index and Brent benchmarks.

All four regions saw prices reach levels last seen in November 2010. Heavier grades also posted decreases.

“While the cuts were widely expected, the magnitude took a few in the market by surprise,” said Amrita Sen, at London-based consultancy Energy Aspects.

“For the Saudis, market share has really become an issue over the last year, so this is a signal that they are not just going to cut production because they have done so in the last few years,” she added.

Saudi Arabia has lost significant market share – particularly in Asia and the Mediterranean – to Iraq and Iran, both of which have been heavily discounting their crude. It is also increasingly competing with Kuwait and the UAE.

Although some analysts have said the lowering of prices for the US has been in response to growing shale oil production, others believe it is rather to do with low cost Opec producers seeking to expand their footing in the region.

“The overall reductions indicate they [Saudi Arabia] see a slack market and weak refining margins, meaning they have to discount more – particularly in Asia – to ensure their crude is taken,” said Gareth Lewis-Davies at BNP Paribas.

ICE October Brent, which hit $115 a barrel in mid-June, fell close to the $100 a barrel mark this week amid an oil glut.

Geopolitical tensions, from Libya to Iraq, have failed to disrupt production meaningfully. Moreover, excess supplies in the Atlantic Basin and North Sea, amid weak European demand, have only compounded the effect of North American production increases.

Market participants believe Saudi Arabia will cut production, influence prices and balance the market in times of oversupply, particularly since signalling its preferred price range of about $100 a barrel.

Production stands at close to 10m barrels a day, with 7m-8m b/d allocated for export.

As yet unhindered global production, combined with Saudi Arabia’s reluctance to cut output, bar seasonal fluctuations, could mean the price of oil falls further.

However, Abhishek Deshpande, analyst at Natixis, said the country was too reliant on oil revenues not to step in. “A greater number of exports at lower and lower prices doesn’t make sense.”

Even so, Mr Lewis-Davies added that when Saudi Arabia had sought to cut production in the past, regaining market share without disturbing the price had been problematic. There are also questions as to how much of the Gulf nation will be willing to lower output, especially if other Opec members do not follow suit.

Employment cost index, Personal income, Spending, and Saudi output

Still tame (with a hint of moving up some) particularly in comparison to the last cycle which was considered relatively tame:

Personal Consumption had a nice spike up in November:

But without the income to sustain it? (Ignore the latest yoy data point ‘dip’ as it’s from the spike a year ago. Just look at the last few monthly data points)

Highlights
Personal income was flat in December while spending was up. Income sluggishness may have been weather related. Personal income was unchanged after rising 0.2 percent in November. Markets expected a 0.2 percent rise. The wages & salaries component posted flat in December, following a 0.5 percent boost the month before.

Personal spending, however, was moderately strong, rising 0.4 percent after a 0.6 percent boost in November. Spending was led by a 1.5 percent jump in nondurables with services gaining 0.4 percent. Durables declined 1.8 percent after a 1.8 percent increase the month before.

The rise in personal consumption was not just price related. Real spending increased 0.2 percent in December after an increase of 0.6 percent in November.

Meanwhile, Saudi oil output, which indicates the net demand for global crude, keeps them in the sweet spot as swing producer/price setter:


Full size image

Comments on research report

From DB,
Comments below:

Commentary for friday: the second print on Q2 GDP growth showed a significant upward revision to +2.5% from +1.7% as previously reported. Recall that growth was only +1.1% in Q1.

After the 3rd downward revision

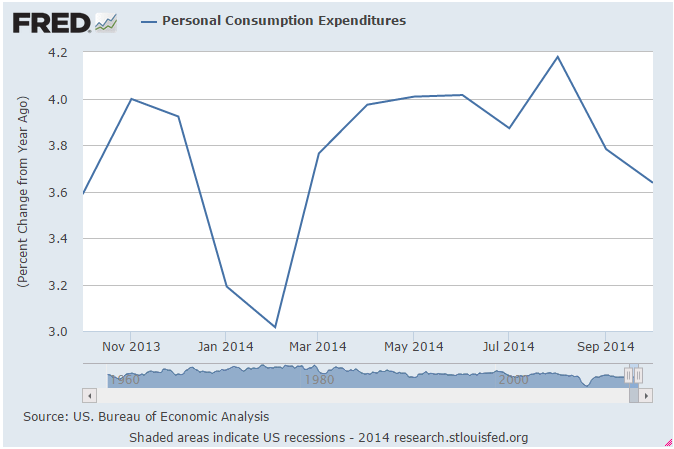
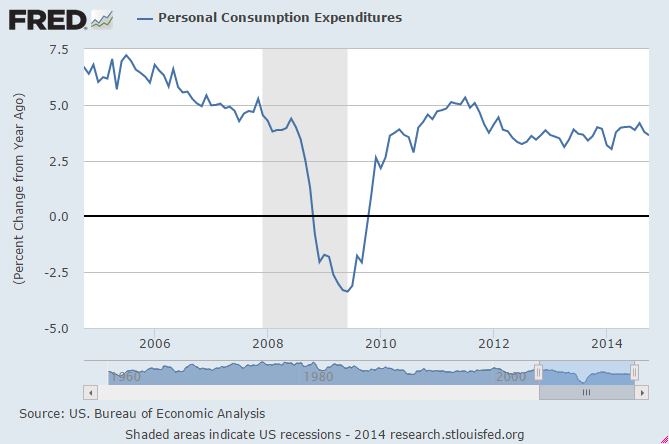
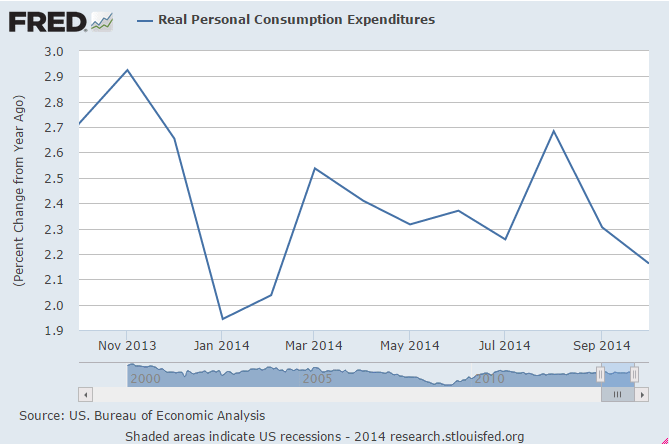
Given that the deflator was revised a tenth higher (0.8% vs. 0.7% as previously reported), the magnitude of the overall revision is even more impressive. Personal consumption was unrevised at +1.8% in Q2,

Down from 2.3% in Q1 if I recall correctly

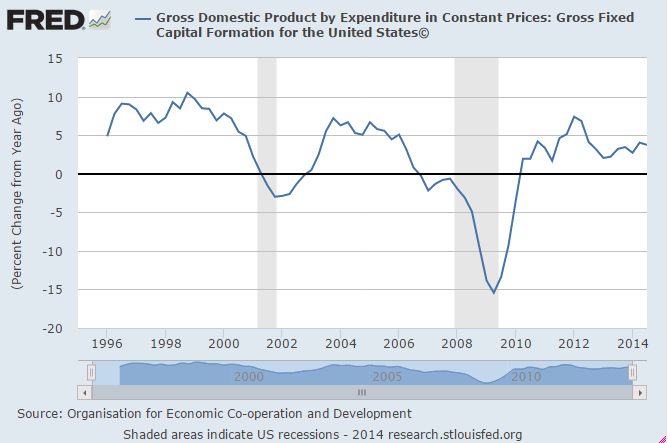
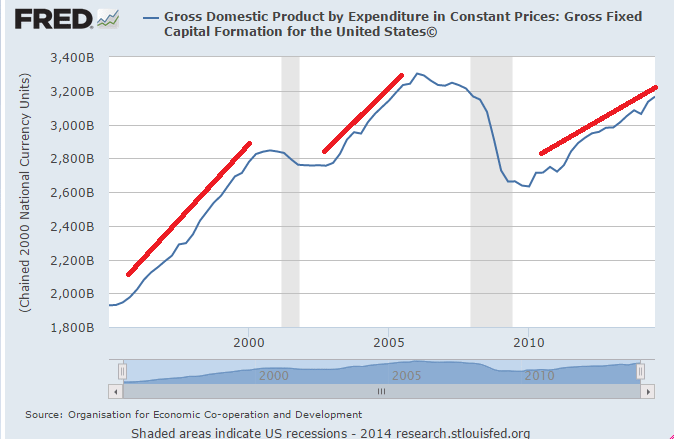
While business fixed investment was only modestly softer (+4.4% vs. +4.6%). Residential investment was also reduced slightly (+12.9% vs. +13.4%). The big changes to Q2 growth were in inventories and international trade. Inventory accumulation was lifted to $62.6b from $56.7b as first reported, thereby adding 0.6 ppt to growth compared to 0.4 ppt previously.

The question is voluntary to restock from a Q1 dip or sales growth forecast, or involuntary due to lower than expected sales.

In terms of trade, firmer exports and softer imports drove net exports to improve; as a result, the original -0.8 ppt drag from trade was revised up to zero.

Question is whether exports can be sustained through Q3 as the dollar spike vs Japan and then the EM’s hurts ‘competitiveness’

The government drag on Q2 was revised to become slightly larger (-0.2 ppt vs. -0.1 ppt as first reported). Nonetheless, the federal government drag on economic activity has diminished significantly compared to the impact in Q1 (-0.7 ppt) and Q4 2012 (-1.2 ppt). A diminished drag from the public sector should enable overall GDP growth, which was +1.6% year-on-year in Q2, to close the gap with private sector growth, which was +2.5% over the same period.

I see it this way- the govt deficit spending is a net add of spending/income. So with the deficit dropping from 7% of GDP last year to maybe 3% currently, with maybe 2% of the drop from proactive fiscal initiatives, some other agent has to be spending more than his income to sustain sales/incomes etc. If not, output goes unsold/rising inventories and then unproduced. The needed spending to ‘fill the spending gap’ left by govt cutbacks can come from either domestic credit expansion or increased net exports (no resident credit expansion/savings reductions. I don’t detect the domestic credit expansion and net export growth/trade deficit reduction seems likely given the dollar spike and oil price spike?

If we achieve +3.0% growth in the current quarter and +3.5% in Q4, this will push the year-on-year rate to +1.7% in Q3 and +2.5% by yearend. (this is in line with the Fed’s central tendency forecasts, which are due to be updated at the september FOMC meeting.)

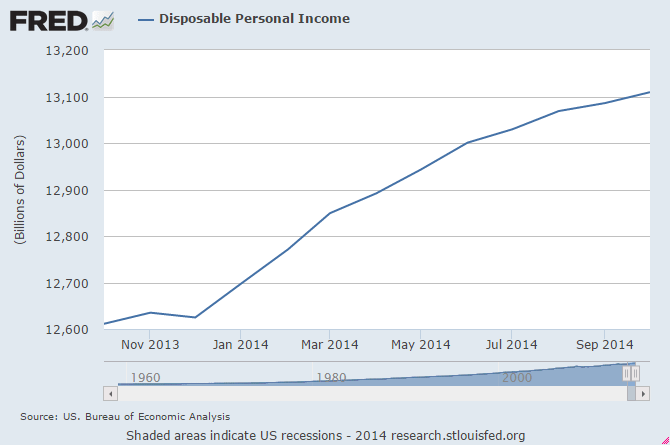
In order for our growth forecast to come to fruition, we will need to see a pickup in consumer spending,

Hard to fathom, as personal consumption has been slipping from 2.3 in Q1 to 1.8 in Q2, and walmart and the like sure aren’t seeing any material uptick in sales? Car sales are ok, but further gains from the June high rate seems doubtful as July has already posted a slower annual rate.

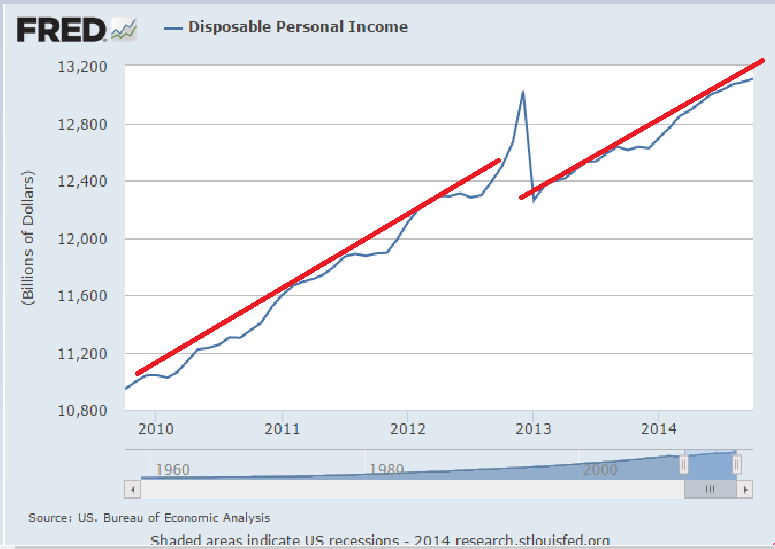
homebuilding and business investment relative to first half performance. The first two series are likely to be boosted by sturdier employment gains, and hence faster household income growth.

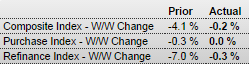
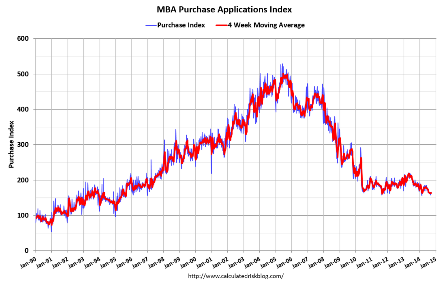
Seems early Q3 reports show falling mtg purchase applications, home sales falling month to month, and lots of anecdotals showing the spike in mtg rates has slowed things down. So growth from Q2 seems unlikely at this point?

We are confident that the pace of hiring will pick up in the relatively near term, because jobless claims continue to hold near cyclical lows.

New jobs dropped to 160,000 in july, and claims measure people losing their jobs, not new hires. Also, top line growth, the ultimate driver of employment, remains low, so assuming actual productivity hasn’t gone negative a spike in jobs is unlikely?

Given the usefulness of jobless claims as a payroll forecasting tool, it should come as little surprise that they are also significantly correlated with wage and salary growth. In fact, over the past 25 years, the current level of jobless claims has typically coincided with private wage and salary growth above 6% compared to 3.8% in Q2.

As above, claims may have correlated with all that in the past, but the causation isn’t there. Looks to me like claims are more associated with ‘time from the bottom’ as with time after the economy bottoms firings tend to slow, regardless of hiring?

Meanwhile, the third growth driver noted above—business investment—will largely depend on the corporate profit trend. Yesterday’s second print on GDP provided the first look at economy-wide corporate profits, which rose +3.9% in Q2 vs. -1.3% in Q1. Many analysts fretted the decline in profits in Q1, because they tend to drive business investment and hiring plans. We dismissed the Q1 weakness as a temporary development which occurred in lagged response to the growth slowdown in Q4 2012 and Q1 2013. The fact that profits are reaccelerating (+5.0% year-on-year versus +2.1% in Q1) is an encouraging development in this regard.

Profits also are a function of sales, which are a function of ‘deficit spending’ from either govt or other sectors, as previously discussed. And, again, i see no signs of ‘leaping ahead’ in any of those sectors.

Faster GDP growth through yearend should result in even stronger corporate profit growth.

Agreed! But didn’t he just say that the GDP growth would come from business investment that’s a function of profits (and in turn a function of sales/GDP)?

To be sure, the additional growth momentum now evident in the Q2 GDP results makes our 3% target for current quarter growth more easily attainable. –CR

I don’t see how inventory growth is ‘momentum’ and seems there are severe headwinds to Q3 net exports as drivers of growth?

And govt is there with a deficit of only 3% of GDP to help offset the relentless ‘unspent income’/demand leakages inherent in the global institutional structure.