WRKO Interview, GDP, Pending Home Sales, KC Fed, Corporate Profits, BOJ QE chart

WRKO Interview

Higher than expected, still a bit lower year over year, and supported by heavy unsold inventory building that’s exceeding the growth of new orders, as well as an increase in net exports which is counter to all the survey information and other hard data as well. Net export reports tend to be volatile, with relatively large zigs followed by large zags. And note reported GDI- gross domestic income (the flip side of GDP)- was up only .6 as discussed below. And a few comments below on health care premium expense:

United States : GDP
er-8-27-1
Highlights
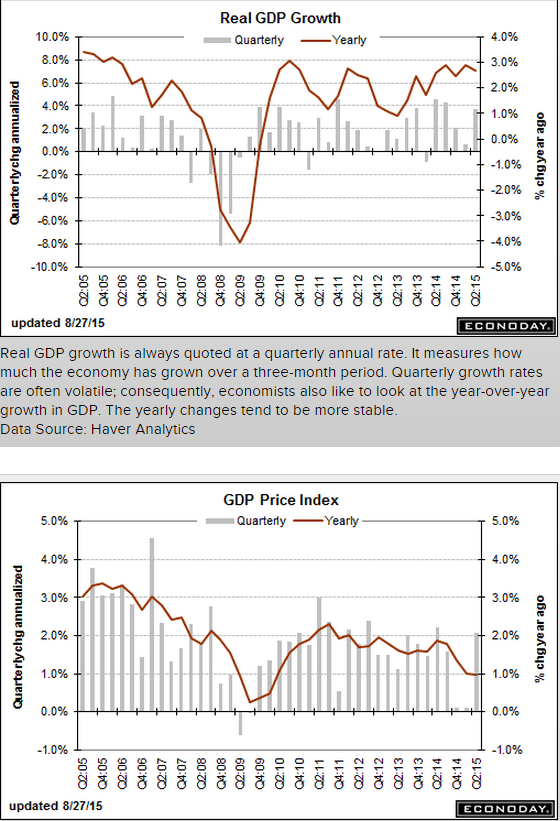
The second-quarter did show a big bounce after all, up at a revised annualized growth rate of 3.7 percent which is 5 tenths over the Econoday consensus and just ahead of the high estimate. The initial estimate for second-quarter GDP was 2.3 percent. This report points to better-than-expected momentum going into the current quarter.

Consumer demand was strong with personal consumption expenditures at a 3.1 percent rate led by an 8.2 percent rate for durables, a gain that was tied to vehicle spending. Residential investment was very strong, at plus 7.8 percent, as was nonresidential fixed investment which, boosted by an upward revision to structures, came in at plus 3.2 percent. Inventories contributed to second-quarter growth as did improvement in net exports. Final demand proved very solid, at plus 3.5 percent. The GDP price index, unlike many other price readings, is showing some pressure, at 2.1 percent and just above the Fed’s general policy goal.

The economy’s acceleration is now much more respectable from the first quarter when growth, at only 0.6 percent, was depressed by heavy weather and special factors. Splitting the difference, first-half growth came in a bit over 2 percent which, as it turns out, is right in line with the similar performance of 2014 when first-quarter growth, again depressed by severe weather, fell 2.1 percent followed by a 4.6 percent surge in the second quarter. Growth in the third quarter last year was 4.3 percent which would be a very good performance for this third quarter.

The impact of today’s report on Fed policy for September’s FOMC is likely to be minimal. Focus at the upcoming meeting will be on the state of the global financial markets and, very importantly, the strength of next week’s employment report for August.

er-8-27-2

Note the volatility of exports and imports, particularly for the last two quarters:
er-8-27-3
er-8-27-4

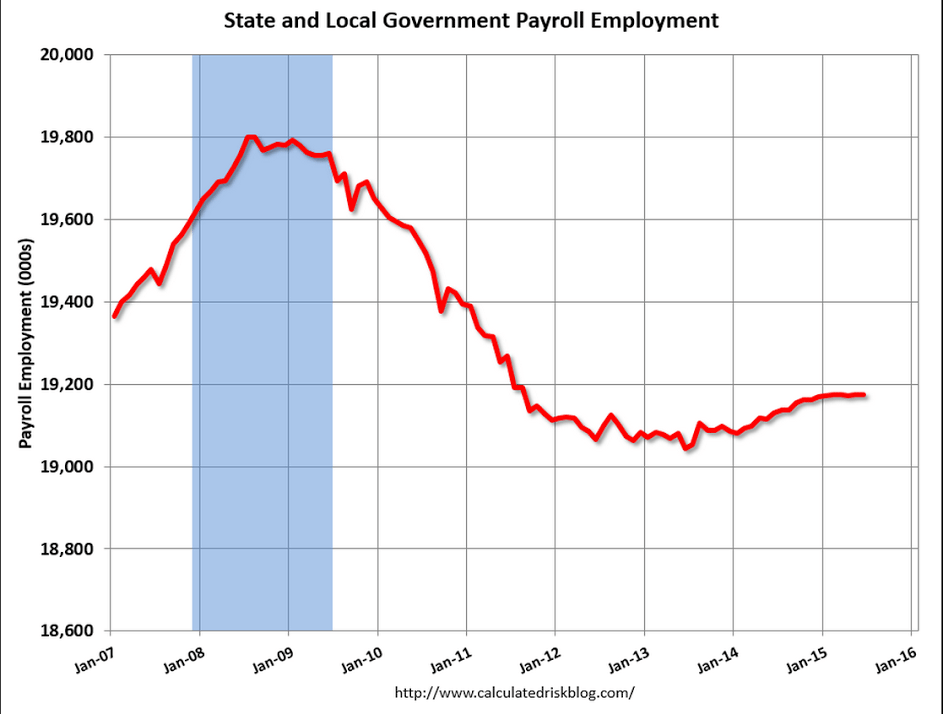
The state and local increase looks suspect as well:
er-8-27-5
er-8-27-6

The upward revisions to second-quarter growth also reflected the accumulation of $121.1 billion worth of inventories, up from the previous estimate of $110 billion. That meant inventories contributed 0.22 percentage point to GDP instead of subtracting 0.08 percentage point as reported last month.

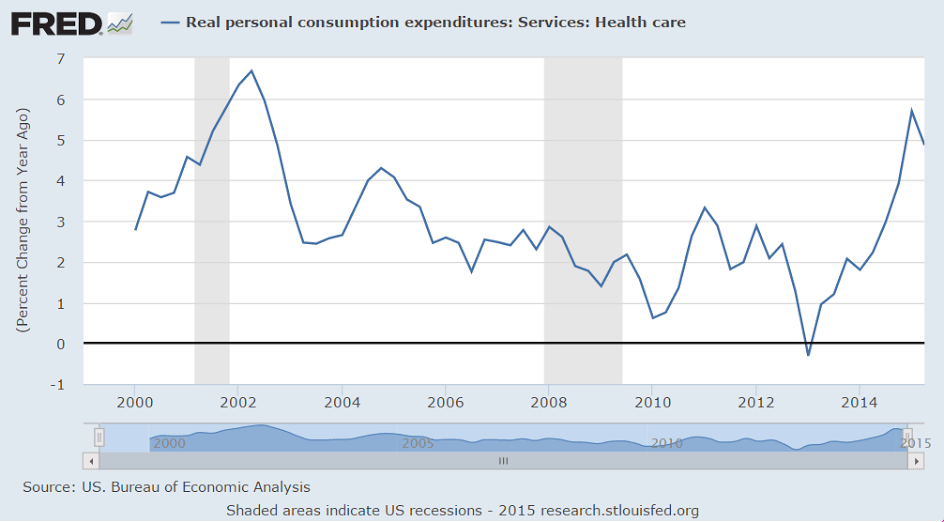
Apparently health care premiums are counted as personal consumption expenditures, and with the ACA there’s a one time increase in progress as more people get funded to pay premiums. This is adding some support to GDP growth until it levels off.
er-8-27-7

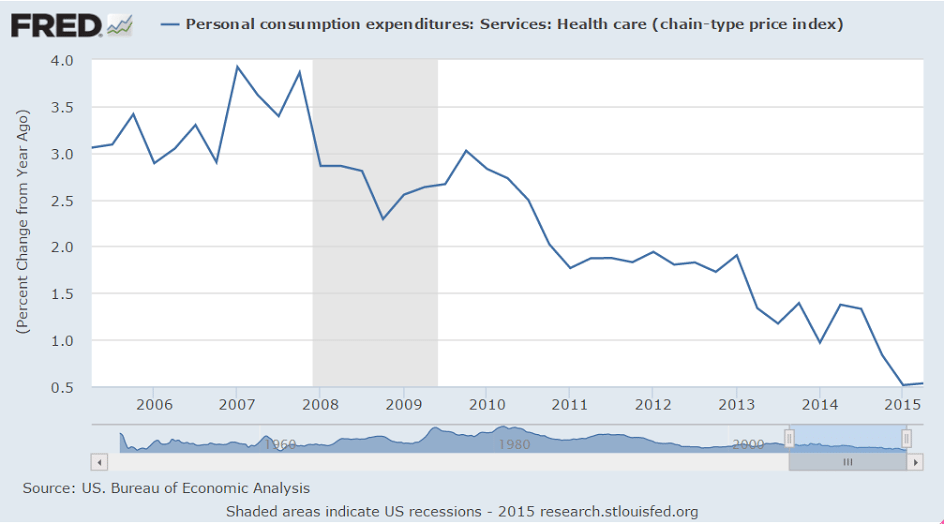
This has not necessarily increased actual health care services received or costs:
er-8-27-8

Gross domestic income was also released. While GDP measures total sales, GDI measures total income received from those sales. So while those numbers are necessarily identical, in practice they tend to differ initially as they are calculated independently and entail numerous estimates, and converge over time as hard numbers become available.

This is from the US Bureau of Economic Analysis:

Real gross domestic income (GDI) — the value of the costs incurred and the incomes earned in the production of goods and services in the nation’s economy — increased 0.6 percent in the second quarter, compared with an increase of 0.4 percent (revised) in the first. The average of real GDP and real GDI, a supplemental measure of U.S. economic activity that equally weights GDP and GDI, increased 2.1 percent in the second quarter, compared with an increase of 0.5 percent in the first quarter.

No acceleration here:

United States : Pending Home Sales Index
er-8-27-9
Highlights
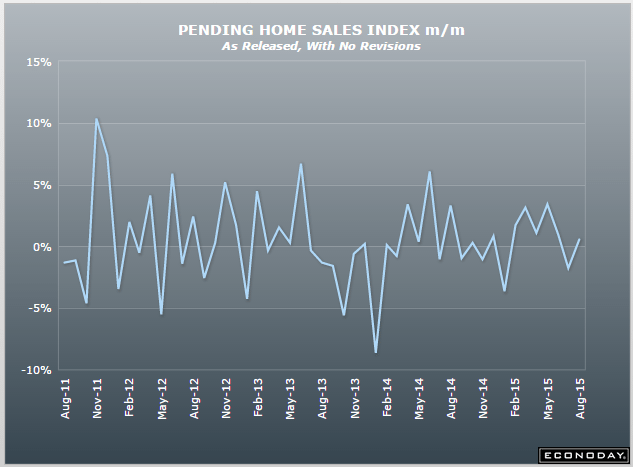
Pending home sales came in at the low end of expectations, up however a still respectable 0.5 percent. Regional data show a strong 4.0 percent gain for the Northeast, which however is the smallest region for existing home sales, and a 1.4 percent dip for the West. Sales were unchanged in the Midwest and rose 0.6 percent in the South which is the largest region. This report is positive but far from exceptional, pointing to no more than moderate growth ahead for existing home sales.

er-8-27-10

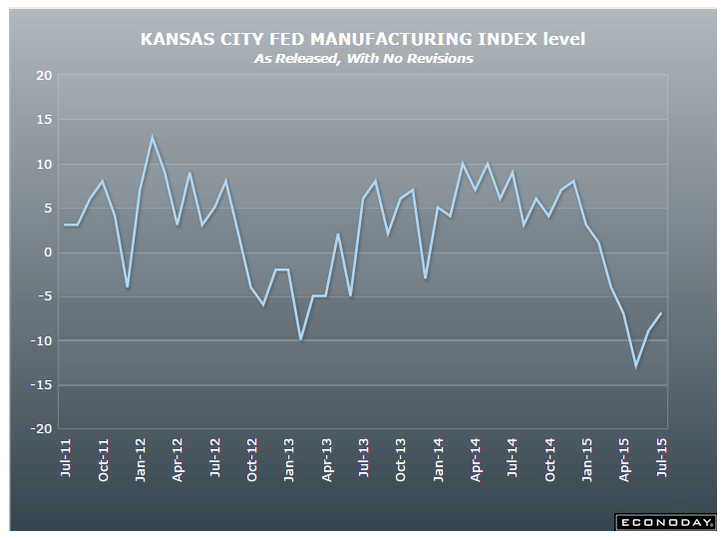
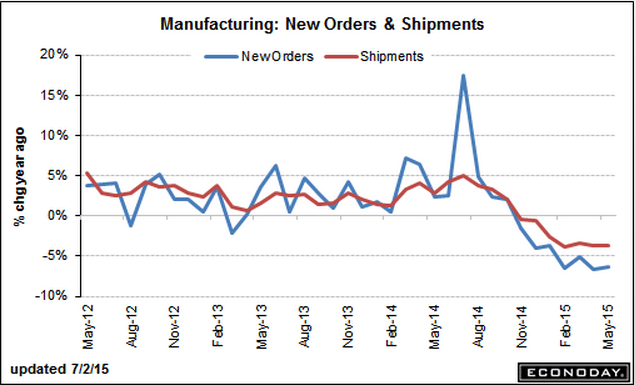
The bad news in manufacturing continues:

United States : Kansas City Fed Manufacturing Index
er-8-27-11
Highlights
Factory activity in the Kansas City Fed’s region remains in deep contraction, at minus 9 in August vs minus 7 in July and deeper than the Econoday consensus for minus 4. New orders are also at minus 9 with backlog orders at minus 21. These are deeply depressed readings that point to a long run of weak activity in the months ahead. Production is already far into the negative column at minus 16 with hiring at minus 10. Price readings in the August report are in contraction.

This report speaks to significant distress for the region which is getting hit by the oil-led fall in commodity prices. Taken together, regional reports have been mixed to soft so far this month, pointing to slowing for a factory sector that got a bit boost from the auto sector in June and July. The Dallas Fed report, which like this one has been badly depressed, will be posted on Monday.
er-8-27-12

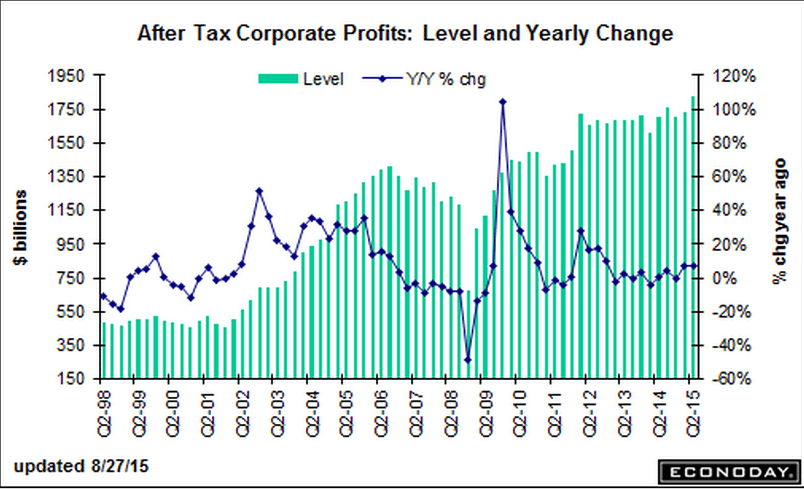
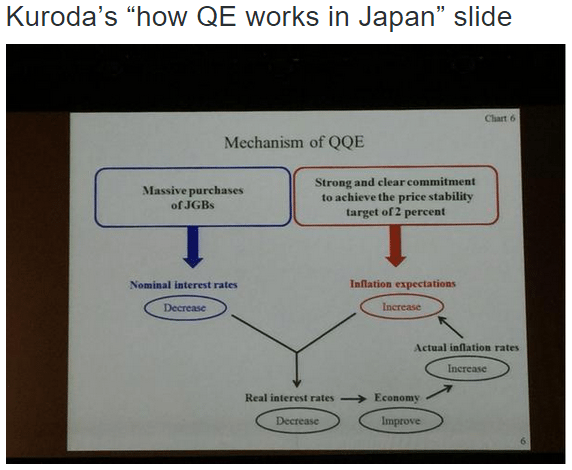
This is amateur hour.

After 20 years of this stuff, they still just need more time…
er-8-27-13

Fed white paper, building permits, transport charts, Japan trade


So someone on high sees it much like I do…
;)

In a white paper dissecting the U.S. central bank’s actions to stem the financial crisis in 2008 and 2009, Stephen D. Williamson, vice president of the St. Louis Fed, finds fault with three key policy tenets.

Specifically, he believes the zero interest rates in place since 2008 that were designed to spark good inflation actually have resulted in just the opposite. And he believes the “forward guidance” the Fed has used to communicate its intentions has instead been a muddle of broken vows that has served only to confuse investors. Finally, he asserts thatquantitative easing, or the monthly debt purchases that swelled the central bank’s balance sheet past the $4.5 trillion mark, have at best a tenuous link to actual economic improvements.

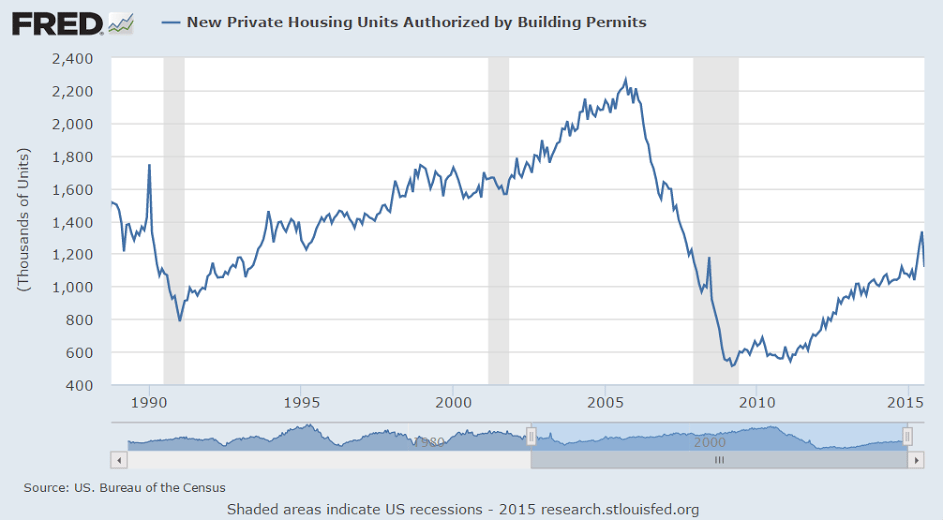
Remember last month cautioning about how a spike up in building permits has sometimes been followed by recession?
er-8-19-1
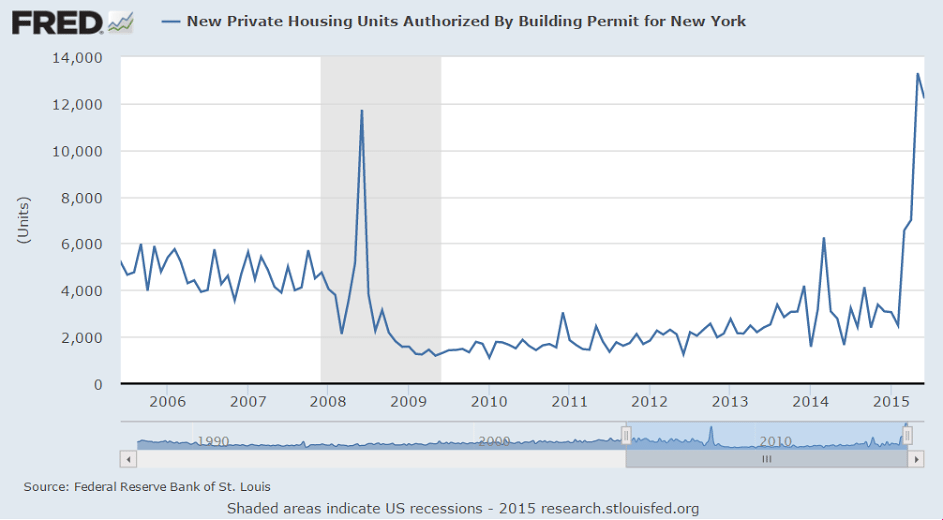
And the NY benefits that expired June 15 were supporting the total numbers and are likely to be followed by much lower numbers:
er-8-19-2
Once again Varoufakis reconfirms he’s clueless with regard to public finance:

Varoufakis Proposal for Eurozone Sovereign Debt

August 18 (Econintersect) — Former Greek finance minister Yanis Varoufakis has proposed a debt restructuring process for over-indebted Eurozone countries that does not involve writing down debt or bailing out insolvent countries. It is based on an idea proposed by Varoufakis with Stuart Holland and James K. Galbraith (link below).

The proposal is for a complex and costly process functionally identical to a simple, no cost, ECB guarantee.

DB Charts:

er-8-19-3

er-8-19-4

Exports growing though at a slower rate, imports declining at a faster rate:

Japan : Merchandise Trade
er-8-19-5

Retail Sales, Jobless Claims, Import Export Prices, Business Inventories, Japan Machine Orders, Freight Transportation, Gas Prices


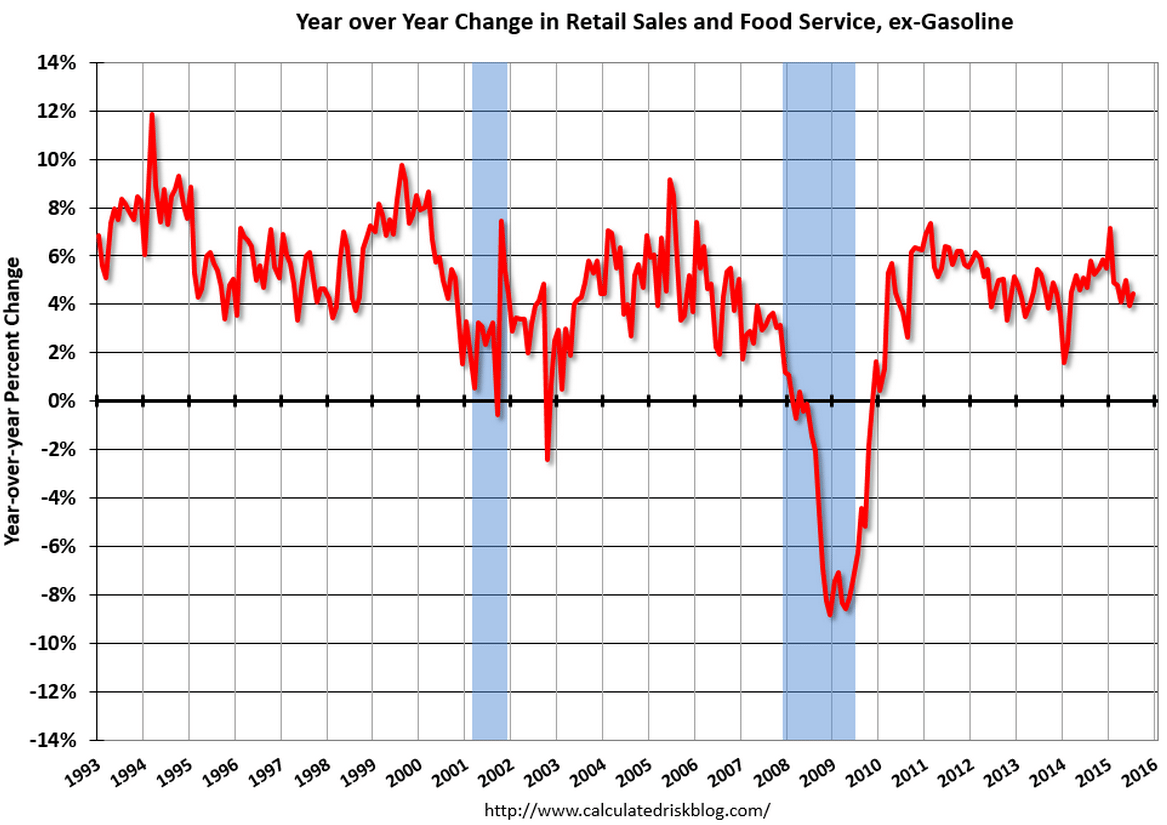
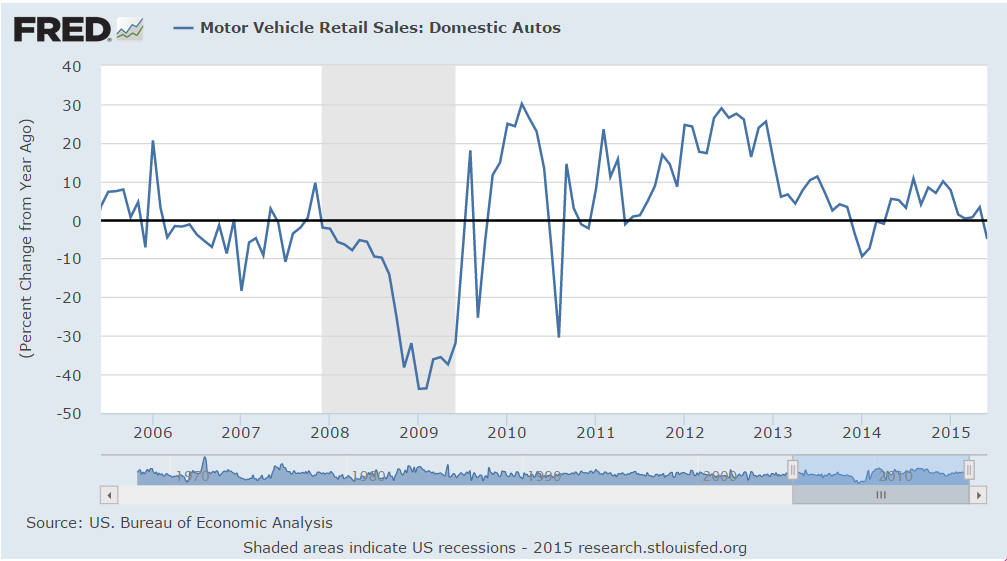
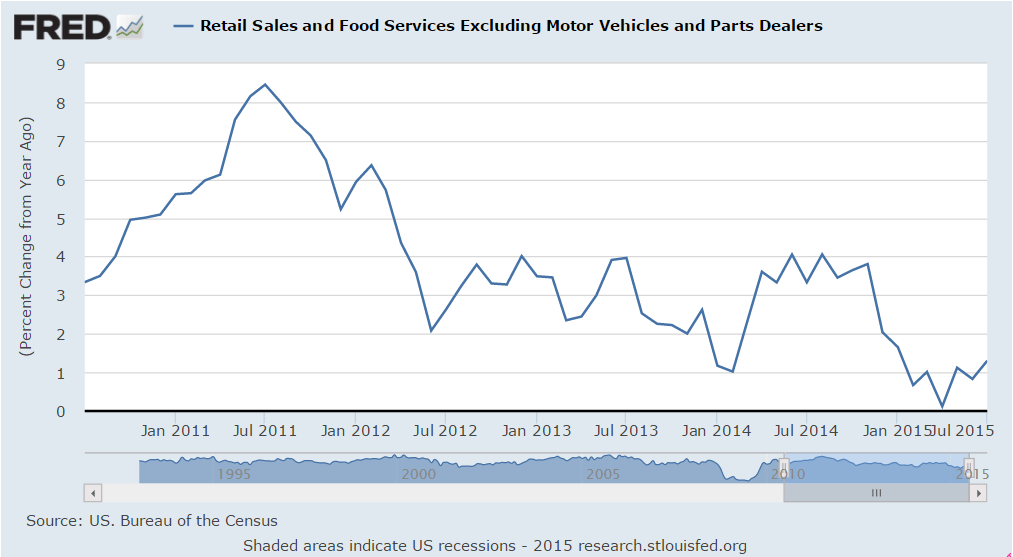
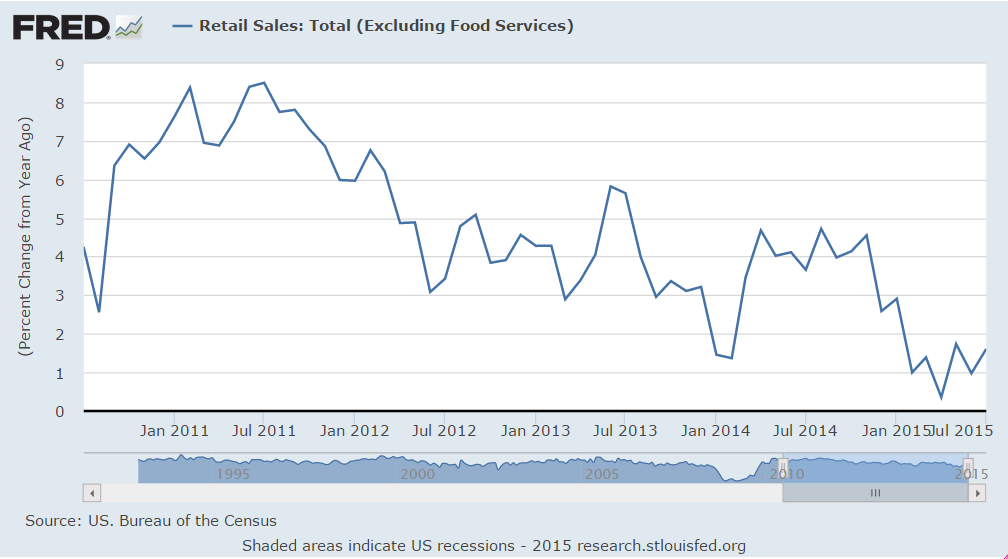
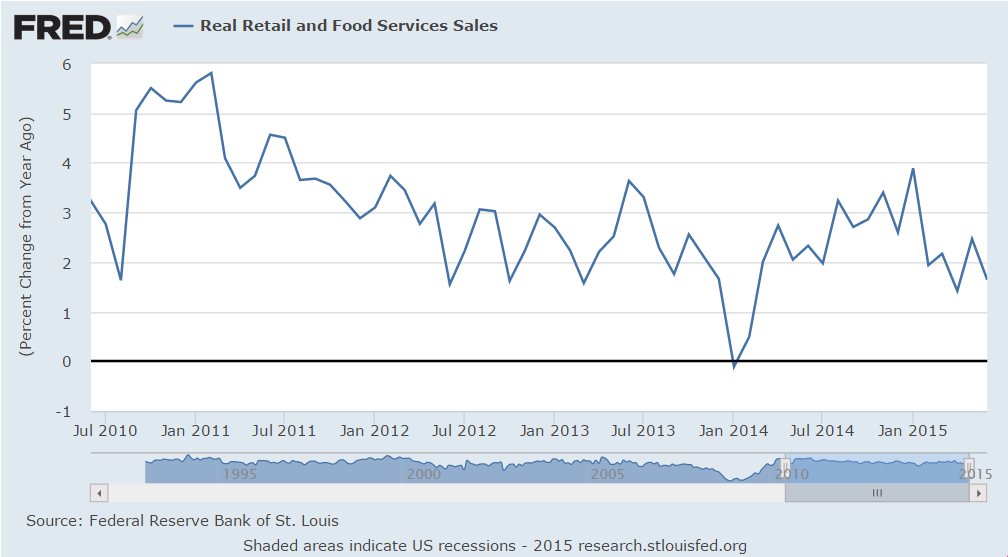
This is being touted as a strong report, but, again, looks to me like it’s dropped since year end and at best is moving sideways from there, and not to forget that a large share of auto sales are imports.

But I do agree the Fed is heck bent on raising rates in Sept, even without ‘some’ improvement, and will do so unless there’s a stock market decline severe enough to hold them back. So far that’s not happening.

Retail Sales
er-8-13-1

Highlights
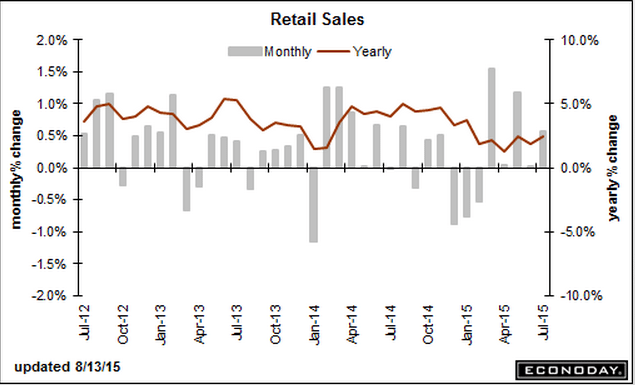
Big upward revisions underscore a very solid and very important retail sales report. Retail sales rose 0.6 percent in July with June revised to unchanged from an initial reading of minus 0.3 percent and with May revised to a jump of 1.2 percent from 1.0 percent. The revisions to June and May point to an upward revision for second-quarter GDP.

Vehicle sales, as expected, were the standout in July, jumping 1.4 percent to nearly reverse June’s 1.5 percent slide and nearly matching May’s historic 1.9 percent surge. But even outside vehicles, retail sales were strong with the ex-auto reading rising a solid 0.4 percent. Restaurants, in another strong signal of consumer strength, rose an outsized 0.7 percent following June’s 0.5 percent gain. These are very strong gains for this component. Excluding both vehicles and gasoline, retail sales rose 0.4 percent, again another solid reading.

Strength in both vehicles and restaurants point to the health of the US consumer and will likely give the hawks the courage, despite all the troubles in China, to push for a rate increase at the September FOMC.

er-8-13-4

er-8-13-5

er-8-13-6

er-8-13-7

er-8-13-8

er-8-13-9

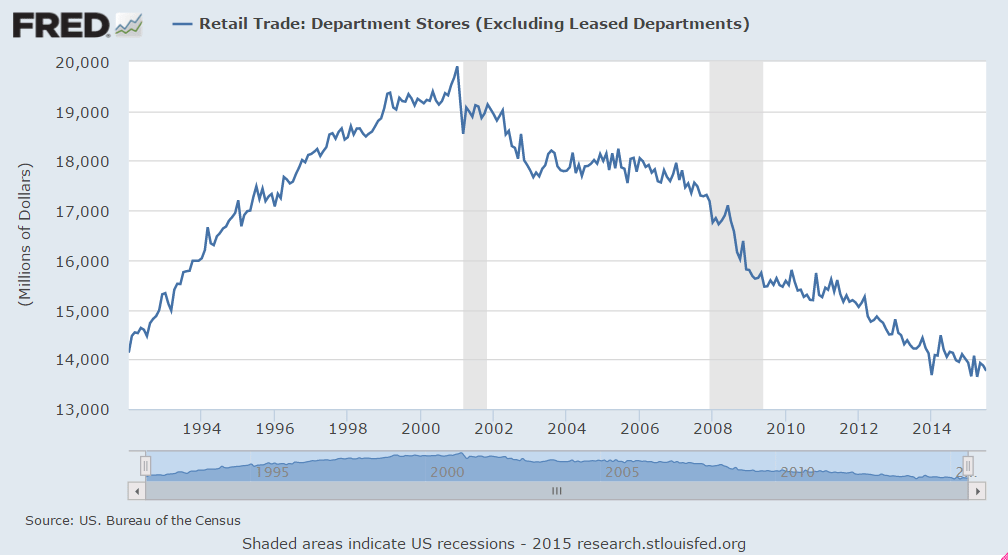
Tough times for department store sales continue, which explains some of the weakness in construction:

er-8-13-10

‘Some’ deterioration:

Jobless Claims
er-8-13-11

‘Some’ deterioration for Fed hopes of higher inflation. It’s been failing to hit its target for longer than I can remember…

er-8-13-12


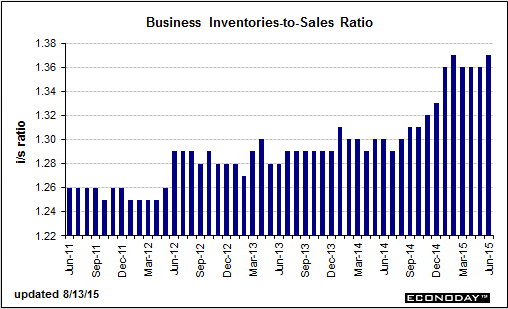
Excess inventory building in June helps Q2 GDP but the likely subsequent production cuts will hurt Q3. The now persistently too high inventory to sales ratio is overdue for a correction:

United States : Business Inventories
er-8-13-13

Highlights
Inventories rose relative to sales in June but the news isn’t that bad given that the build was centered in autos. Business inventories rose 0.8 percent in June which was well ahead of a 0.2 percent rise in sales. The mismatch lifts the inventory-to-sales ratio to 1.37 from 1.36.

But retail inventories at auto dealers were to blame, up 1.4 percent in June and contributing to a 0.7 percent rise for the retail component. Inventories at manufacturers and wholesalers, the two other components of the business inventory report, also rose, up 0.6 and 0.9 percent respectively.

Inventories are on the heavy side but the concentration in autos is welcome given how strong sales are, evidenced by the 1.4 percent surge for the motor vehicle component of the July retail sales report released earlier this morning. Note that this report, along with the retail sales report, are likely to lift revision estimates for second-quarter GDP.

er-8-13-14

Global weakness continues:

Japan : Machine Orders
er-8-13-15

Highlights
June seasonally adjusted machine orders (excluding volatile items) declined for the first time since February. They dropped a larger than anticipated 7.9 percent on the month and were up 14.7 percent on the year. Core orders were up 16.6 percent based on the original series. This was in contrast to expectations of a 17.5 percent increase.

Core machine orders are considered a proxy for private capital expenditures. The downward move followed a 0.6 percent gain a month before. The government repeated its assessment that machine orders would advance in the third quarter.

Nonmanufacturing orders excluding volatile items were up 5.0 percent while manufacturing orders dropped 14.0 percent. All orders including volatile items dropped 6.2 percent on the month. Manufacturing orders likely softened on continued weaker export demand while the sluggish domestic economy weighs on nonmanufacturers.”

Another weak looking index:

er-8-13-16


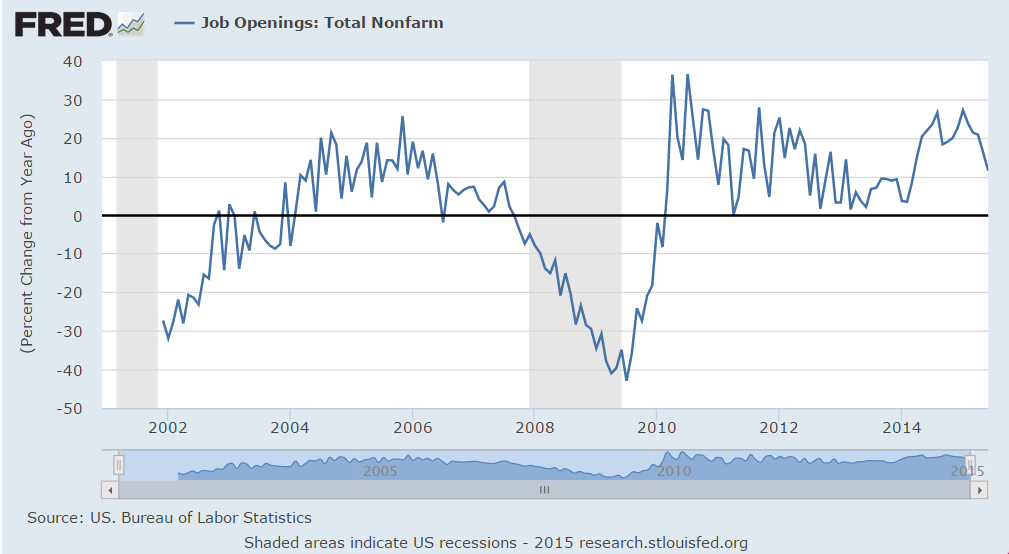
And I’d call this ‘some’ deterioration in the ‘labor market’. Looks like it was weakening before the 2014 oil capex boom supported it, and then has fallen off since the oil price collapse:

er-8-13-17


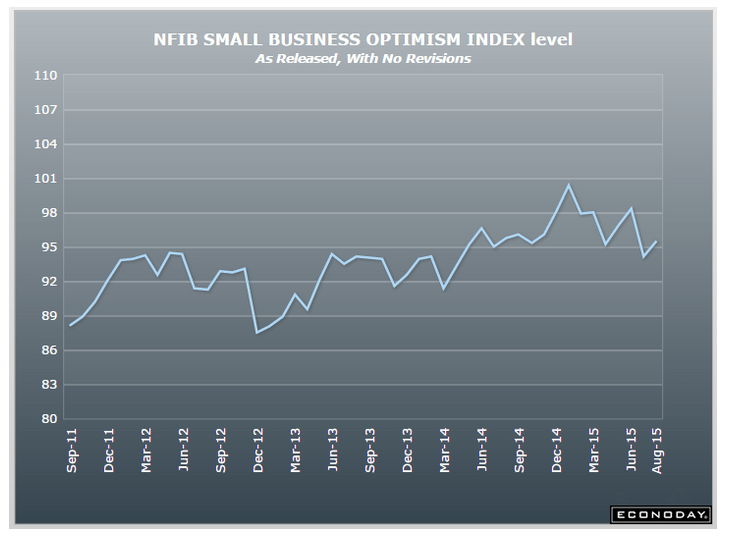
This is to the point I’ve been making that surveys are one man one vote, not one dollar one vote, so optimism remained high even as retail sales, for example, were fading. Yes, a lot more people saved $10 per week on gas but an equal amount of income was reduced for sellers of oil, including those earning royalties and holding leases, and investors of all sorts, and seems the spending cuts on domestic product by that group outweighed the additional spending from pump savings.

Fueled by low pump prices, U.S. motorists to drive more in August – survey

By Jarrett Renshaw

August 11 (Reuters)

U.S. motorists are paying an average of $2.58 per gallon, nearly a dollar less than a year ago, according to AAA, the nation’s largest motorist advocacy group. And a quarter of respondents expected prices to continue to decline, up from 10 percent a month ago.

The survey found that nearly 80 percent of people say gas prices influence how they feel about the economy. And with gas prices down nearly $1 from a year ago, U.S. motorists are feeling positive about the direction of the economy, the survey found.

“There is good news for retailers as consumer optimism picks up during peak vacation season,” said NACS Vice President of Strategic Industry Initiatives Jeff Lenard.

China, Germany, Productivity, NFIB Index, Redbook, Wholesale Trade


A few thoughts:

China’s US Tsy holding had been falling perhaps because they were selling $ to buy Yuan to keep it within in the prior band.

Pretty much all exporting nation’s currencies have already weakened vs the $, including the Yen and Euro, so this is a bit of a ‘catch up.’

In a weakening global economy from a lack of demand (sales) and ‘western educated, monetarist, export led growth’ kids now in charge globally, the path of least resistance is a global race to the bottom to be ‘competitive’. And the alternative to currency depreciation, domestic wage cuts, tends to be less politically attractive, as the EU continues to demonstrate.

The tool for currency depreciation is intervention in the FX markets, as China just did, after they tried ‘monetary easing’ which failed, of course. Japan did it via giving the nod to their pension funds and insurance companies to buy unswapped FX denominated securities, after they tried ‘monetary easing’ as well.

The Euro zone did it by frightening China and other CB’s and global and domestic portfolio managers into selling their Euro reserves, by playing on their inflationary fears of ‘monetary easing’-negative rates and QE- they learned in school.

The US used only ‘monetary easing’ and not any form of direct intervention, and so the $ remains strong vs all the rest.

I expect the Euro to now move ever higher until its trade surplus goes away, as global fears of an inflationary currency collapse are reversed and Euro buying resumes as part of global export strategies to export to the Euro zone. And, like the US, the EU won’t use direct intervention, just more ‘monetary easing’.

Ironically, ‘monetary easing’ is in fact ‘fiscal tightening’ as, with govts net payers of interest, it works to remove interest income from the global economy. So the more they do the worse it gets.

‘No matter how much I cut off it’s still too short’ said the hairdresser to the client…

The devaluations shift income from workers who see their purchasing power go down, to exporters who see their margins increase.
To the extent exporters then reduce prices and those price reductions increase their volume of exports, output increases, as does domestic employment. But if wages then go up, the ‘competitiveness’ gained by the devaluation is lost, etc., so that’s not meant to happen.

Also, the additional export volumes are likewise reductions in exports of other nations, who, having been educated at the same elite schools, respond with devaluations of their own, etc. etc. in a global ‘race to the bottom’ for real wages. Hence China letting their currency depreciate rather than spend their $ reserves supporting it.

The elite schools they all went to contrive models that show you can leave national deficit spending at 0, and use ‘monetary policy’ to drive investment and net exports that ‘offset’ domestic savings. It doesn’t work, of course, but they all believe it and keep at it even as it all falls apart around them.

But as long as the US and EU don’t have use of the tools for currency depreciation, the rest of the world can increase it’s exports to these regions via currency depreciation to lower their $ and Euro export prices, all of which is a contractionary/deflationary bias for the US and EU.

Of further irony is that the ‘right’ policy response for the US and EU would be a fiscal adjustment -tax cut or spending increase- large enough to sustain high enough levels of domestic spending for full employment. Unfortunately, that’s not what they learned in school…

The drop in expectations is ominous, particularly as the euro firms:

Germany : ZEW Survey
er-8-11-1

Highlights
ZEW’s August survey was mixed with a slightly more optimistic assessment of the current state of the economy contrasting with a fifth consecutive decline in expectations.

The current conditions gauge was up 1.8 points at 65.7, a 3-month high. However, expectations dipped a further 4.7 points to 25.0, their lowest mark since November 2014.


The drop in unit labor costs and downward revision of the prior increase gives the Fed cause to hold off on rate hike aspirations:

United States : Productivity and Costs
er-8-11-2

Highlights
A bounce back for output gave first-quarter productivity a lift, up a quarter-to-quarter 1.3 percent vs a revised decline of 1.1 percent in the first quarter. The bounce in output also held down unit labor costs which rose 0.5 percent vs 2.3 percent in the first quarter.

Output in the second quarter rose 2.8 percent vs a depressed 0.5 percent in the first quarter. Compensation rose 1.8 percent, up from 1.1 percent in the first quarter, while hours worked were little changed, up 1.5 percent vs 1.6 in the first quarter.

Looking at year-on-year rates, growth in productivity is very slight at only plus 0.3 percent while costs do show some pressure, up 2.1 percent in a reading, along with the rise in compensation, that will be welcome by Federal Reserve officials who are hoping that gains in wages will help offset weakness in commodity costs and help give inflation a needed boost.


Up a touch but the trend remains negative:

er-8-11-3


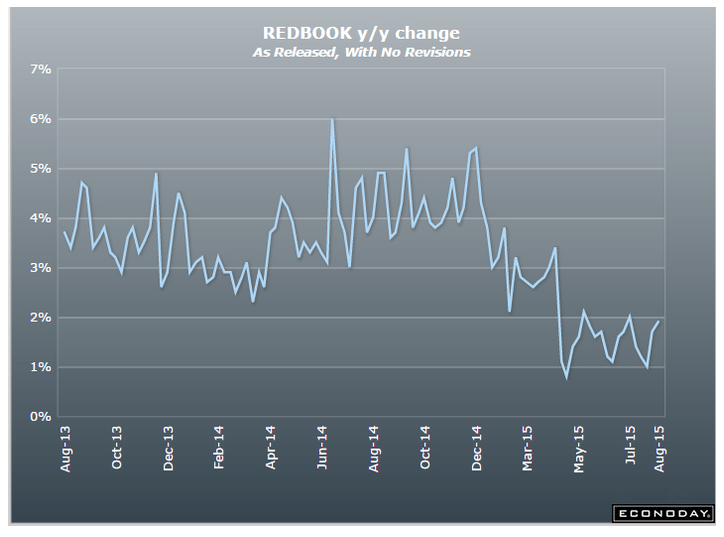
Redbook retail sales report still bumping along the bottom:

er-8-11-4


A decline in sales growth and rise in inventories is yet another negative:

United States : Wholesale Trade
er-8-11-5

Highlights
A build in auto inventories as well as for machinery drove wholesale inventories up a much higher-than-expected 0.9 percent in June. Sales at the wholesale level rose only 0.1 percent in the month, in turn driving the stock-to-sales ratio up 1 notch to a less-than-lean 1.30. This ratio was at 1.19 in June last year.

Chicago Fed, KC Fed, Japan Exports

Note the details and the conclusion:

source: Econoday

er-7-23-1

Highlights

June proved to be a slightly stronger month for the economy than expected, based on the national activity index which came in at plus 0.08 vs Econoday expectations for a 0.05 dip. The 3-month average is still in the negative column though just barely at minus 0.01.

Production indicators showed the most improvement in June, at minus 0.01 vs minus 0.08 in May. The gain here reflects strength in the utilities and mining components of the industrial production report where, however, manufacturing remained flat. Employment also improved, to plus 0.12 from May’s plus 0.06, here reflecting the 2 tenth downtick in the unemployment rate to 5.3 percent. This dip, however, was tied to a decrease in those looking for work which is not a sign of job strength. Personal consumption & housing, at minus 0.07, was little changed as was the sales/orders/inventories component at plus 0.03.

This report is a bit of a head fake, not reflecting the weakness in manufacturing and the special factor behind the decline in the unemployment rate. In sum, growth in the economy is no better than the historical average which is a disappointment, showing little bounce from the weak first quarter.

Unambiguously negative, again:


source: Econoday
er-7-23-2

Highlights

Deep continuing contraction is the score for the Kansas City manufacturing report where the headline index is little changed at minus 7. Order readings point to more trouble ahead with new orders at minus 6 and backlog orders at minus 14. Weakness in export orders, at minus 10, is a central negative for the report, as is hiring, at minus 19 and the workweek at minus 18. Price readings are steady and mute. This region’s manufacturing sector, hurt by both exports and the energy sector, is badly depressed as is the Dallas manufacturing sector. Regional July reports from Dallas and Richmond will be posted early next week to round out the view for what looks to be another weak month for manufacturing.

er-7-23-3

More signs the US trade deficit will be larger for Q2.
From Japan:

Exports to Asia were up 10.1 percent on the year while those to China were 5.9 percent higher. Exports to the European Union added 10.8 percent. It was the seventh consecutive increase. Exports to the U.S. climbed for the tenth straight month, this time by 17.6 percent.

NFIB employment, BOJ solvency, Non Farm Payrolls, Claims, Factory Orders

The cheer leaders didn’t bother to report on this they way they did when employment was increasing:

U.S. small business hiring takes a breather in June: NFIB

July 1 (Reuters) — The National Federation of Independent Business said its monthly survey of members found hiring was little changed last month. Fifty-two percent of small business owners reported hiring or trying to hire, with 44 percent of those reporting few or no qualified applicants for the positions they were trying to fill. Twenty-four percent reported job openings they could not fill, down from 29 percent in May, the NFIB said. The share of business owners looking to increase employment dropped six points, to 16 percent, while those planning reductions was up two points, at 6 percent.

Too stupid an article for me to pass up:

Is quantitative easing putting the Bank of Japan’s solvency at risk?

July 2 (Nikkei) — The BOJ’s holdings of long-term Japanese government bonds rose by 80 trillion yen a year, and its total assets expanded to 324 trillion yen at the end of fiscal 2014. The bank’s return on assets, that is, net profit divided by total assets, stood at 0.31%. If the interest rate goes up by 1 percentage point the bank’s unrealized losses are estimated to jump from 3.3 trillion yen at the end of March 2013 to 13.8 trillion yen at the end of March 2015. With the BOJ’s assets now equal to 64.7% of Japan’s GDP the credibility of the central bank is tied to the Japanese government’s fiscal discipline.

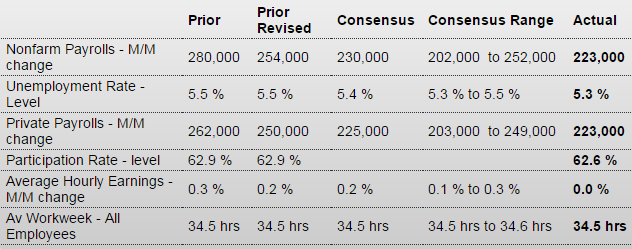
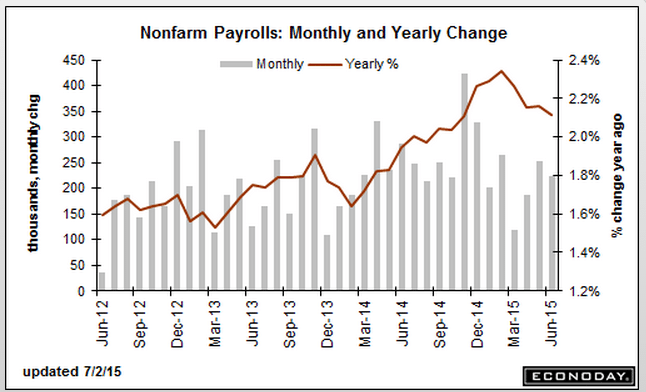
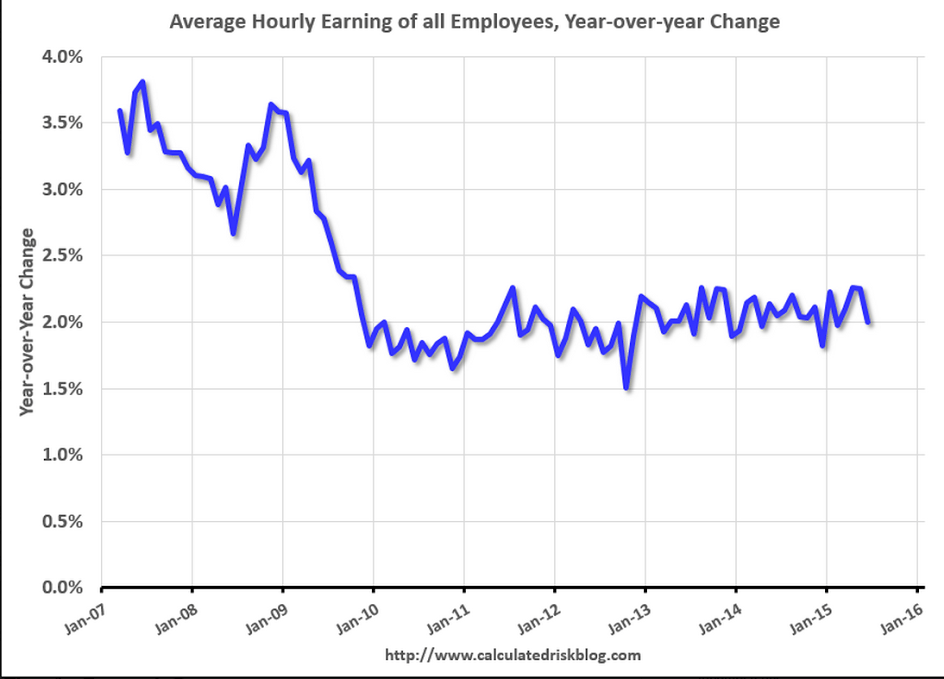
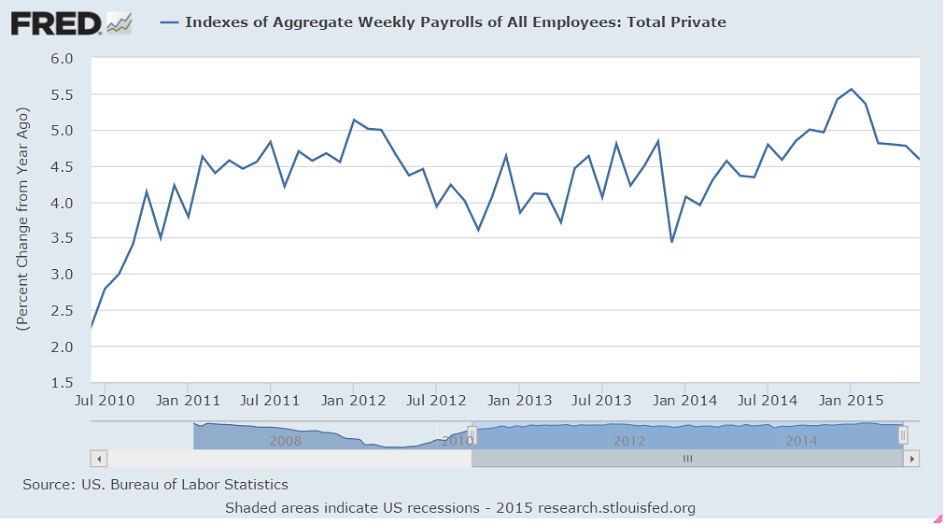
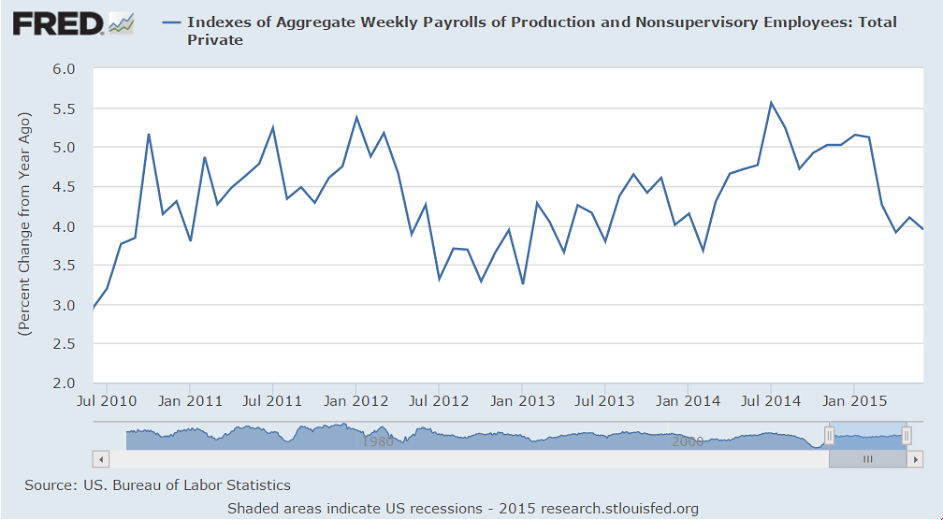
Not good, remember how they cheered the 280,000 new jobs in May, and downplayed the rise in unemployment and the increase in the participation rate? Now May is down to 254,000 and the participation rate fell way back, so they are playing up the drop in unemployment. And note the lack of comments over the deceleration of the year over year growth of employment since oil prices fell. And watch how they cling to their ‘wage inflation’ story even as growth rates again fall back:

NFP
er-7-2-1
Highlights
Push back that rate hike, at least that will be the initial reaction to June’s softer-than-expected employment report where nonfarm payroll growth came in at 223,000 vs Econoday expectations for 230,000 and include downward revisions totaling 60,000 to the two prior months (May revised to 254,000 from 280,000 and April to 187,000 from 221,000). Softness in payroll growth combines with softness in wage pressures with average hourly earnings unchanged in the month and the year-on-year rate moving down to 2.0 percent from 2.3 percent.

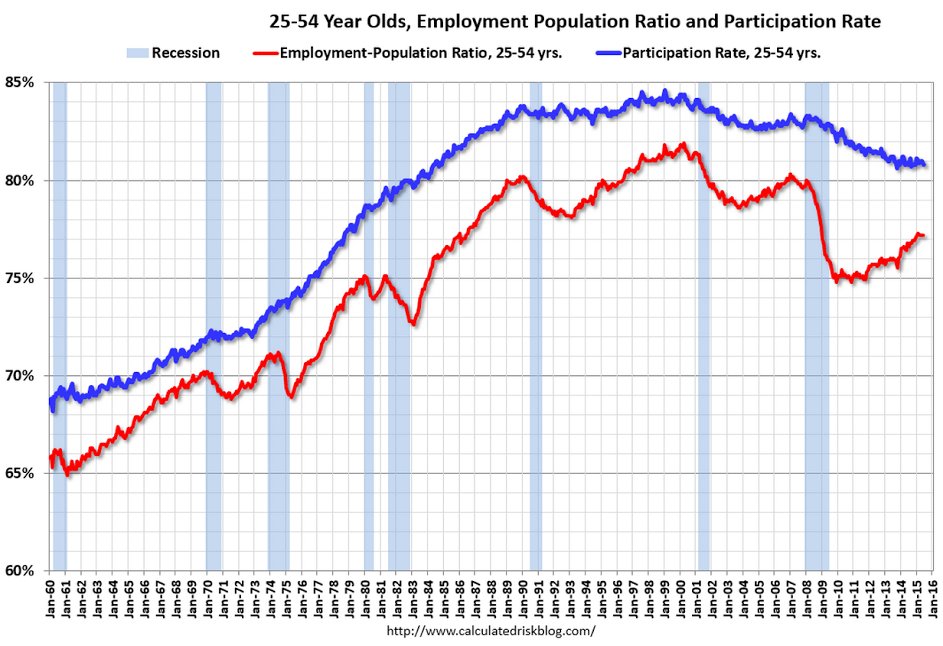
Timing distortions tied to the end of the school year, specifically new entrants to the labor market, appear to have pulled down the unemployment rate to 5.3 percent from 5.5 percent as the labor force in the household part of the report shrunk sharply, in turn pulling down the labor force participation rate by 3 tenths to an unusually low 62.6 percent. The U-6 unemployment rate, a favorite of Fed Chair Janet Yellen’s, fell 3 tenths to 10.5 percent.

Turning back to the establishment part of the report, private payrolls rose 223,000 vs a revised 250,000 in May. The average workweek was unchanged at 34.5 hours. Industries of note include a solid 33,000 rise in retail jobs and a 64,000 rise in professional & business service jobs. The latter reading includes a solid 20,000 rise in temporary help that hints at gains for permanent hiring ahead. Manufacturing and construction jobs were flat.

Focusing on trends, nonfarm payroll growth averaged 221,000 in the second quarter vs 195,000 in the first quarter which, despite the disappointment in today’s report, is solid improvement. The employment side of the labor market isn’t gangbusters but it is moving in the right direction while the unemployment side is increasingly favorable. This is a mixed report with special factors and isn’t likely to shake up the markets.
er-7-2-2

No demographics here- just a big fat lack of aggregate demand:
er-7-2-3
They call every zig up the start of ‘wage inflation’ even as they are all followed by zigs down:
er-7-2-4
This too has leveled off after being touted for ‘lift off’ when it turned up a bit. And state and local deficits keep falling as tax revenues increase, which is an increase of fiscal drag:
er-7-2-5
The rate of growth here had be on the rise but more recently has reversed:
er-7-2-6
er-7-2-7
Up a tad but still low historically:

United States : Jobless Claims
er-7-2-8
Highlights
Unemployment is very low right now, underscored by today’s 2 tenths drop in the unemployment rate to 5.3 percent and by the latest in jobless claims data where initial claims came in at 281,000 in the June 27 week. This is up 10,000 from the prior week but remains very low. The 4-week average inched 1,000 higher to a 274,750 level that is little changed from the month-ago comparison.

Continuing claims, where data lag by a week, rose 15,000 to 2.264 million in the June 20 week. The 4-week average is up 15,000 to 2.253 million. These readings, like those for initial claims, are also very low. The unemployment rate for insured workers is unchanged at 1.7 percent in another reading that is very low.

Another big negative ‘surprise’, and note the weak export comment, and how autos were weak despite higher May sales. Might be because of the high import content of those sales?

United States : Factory Orders
er-7-2-9
Highlights
The factory sector, hit by weak exports, continues to stumble with factory orders down 1.0 percent in May. This compares with Econoday expectations for minus 0.3 percent and is near the low-end estimate for minus 1.2 percent.

The durables component of the report, initially released last week, is now revised lower, to minus 2.2 percent from minus 1.8 percent. Durables in April have also been revised lower to minus 1.7 percent from minus 1.5 percent. The nondurables component, released with today’s report, helped limit the damage but not by much, up 0.2 percent on gains for petroleum and coal following a 0.3 percent gain for April.

But aircraft orders, always volatile, are to blame for much of the durables weakness, falling 49.4 percent in the month. Excluding transportation equipment, which is where aircraft orders are tracked, factory orders were unchanged in May which isn’t great but is much better than the minus 0.6 percent print for April.

Weakness in energy equipment is also a negative factor of the factory sector, down 22.2 percent in May following a 2.1 percent decline in April. Motor vehicle orders are also surprisingly weak, down 1.3 percent in May despite very strong sales. Orders for defense aircraft were also weak, down 6.4 percent.

Capital goods data had been showing some life but not much anymore with nondefense orders excluding aircraft down 0.4 percent following a 0.7 percent decline in April. These are especially disappointing readings. And core shipments of capital goods are dead flat, at minus 0.1 percent following only a 0.2 percent gain in April. These readings will likely pull down second-quarter GDP estimates.

Other disappointments include a steep 0.5 percent decline in total unfilled orders following April’s 0.2 percent decline. Declines in unfilled orders are not a good omen for employment. Total shipments fell 0.1 percent in the month. Inventories at least are stable, unchanged in the month as is the inventory-to-shipments ratio at 1.35.

First there was the unemployment report this morning and now this report, both of which may raise concern among the doves at the Fed that the second-quarter bounce back is not much of a bounce back at all.
er-7-2-10

Durables charts, new home sales,FHFA House Price Index, Japan PMI, GDP, Atlanta Fed, Mtg. purch apps, oil comment

Longer term year over year view not looking so good:
er-6-24-1

er-6-24-2

er-6-24-3

er-6-24-4

er-6-24-5
The cheer leading continues, and sales in the Northeast up 87% looks a bit unsustainable?

New Home Sales
er-6-24-6
Highlights
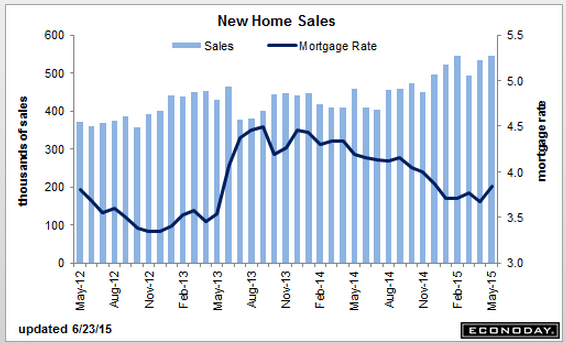
The lift off for housing is appearing more and more like it’s straight up. New home sales rose 2.2 percent in May to an annual rate of 546,000 which is 6,000 above the high end Econoday forecast. Add to this is a 27,000 upward revision to the two prior months with April now standing at 534,000 for a big 8.1 percent monthly gain.

The surge in sales is making for a strong seller’s market with supply relative to sales down to a very thin 4.5 months vs 4.6 months in April. Total new homes on the market stand unchanged at 206,000. The lack of supply risks becoming acute and will doubtlessly speed up construction activity led by permits which, in data posted last week, have been jumping.

Lack of supply will prove to be a positive for sales prices, which however, are down in the latest report, 2.9 percent lower to a median $282,800. Year-on-year, the median price is down 1.0 percent vs the year-on-year sales gain of 19.5 percent in a mismatch that points to price acceleration ahead.

Regional sales data show a strong 13.1 percent rise in the West where year-on-year sales are up 25.5 percent. The South, which is larger than all the other regions combined in this report, has the strongest year-on-year rate at 33.3 percent though monthly sales in May dipped 4.3 percent. Sales have been soft in both the Northeast and Midwest where year-on-year rates are in the negative column though the Northeast is showing monthly strength in this report.

Yesterday’s existing home sales report was very positive as is today’s report, both of which add to other data that put housing at the top economy right now for a sector that can offset stubborn weakness in the manufacturing economy.
er-6-24-7

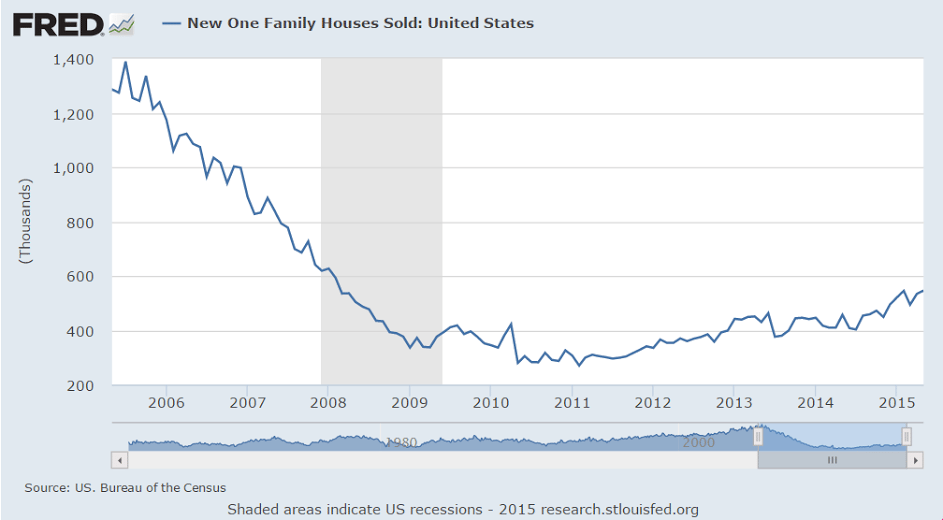
Seems like a stretch to call this ‘lift off’???
er-6-24-8
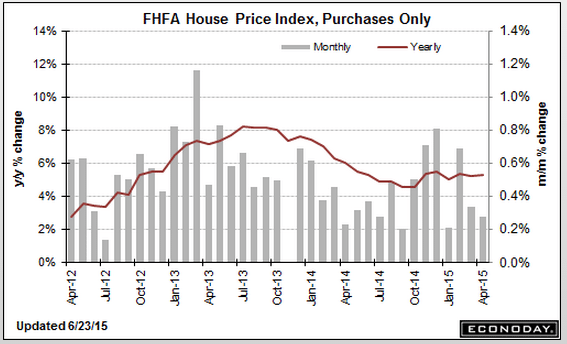
And price gains have at least moderated?
er-6-24-9
Another PMI goes negative. And note that exports are up, in contrast to the US:

Japan : PMI Manufacturing Index Flash
er-6-24-10
Highlights
The flash manufacturing PMI for June indicated a slight deterioration in operating conditions at Japanese manufacturers. Production growth slowed to a fractional pace, while new orders contracted for the third time this year so far. Subsequently, employment growth was subdued, while buying activity declined. The flash manufacturing reading was 49.9, down from the May final of 50.9. Output increased, though at a slower rate. Employment increased but at a slower rate. Both output and input prices increased at a faster rate.

While new orders changed direction and decreased, export orders increased at a faster rate. Reports of a favorable exchange rate and an increase in foreign demand led to a further rise in new export orders in June. Moreover, the latest expansion was the second-fastest since January and quicker than the series average.

As expected, still negative, still only a minor weather bounce to Q2 so far:

GDP
er-6-24-11
Highlights
The second revision to first-quarter GDP came in as expected, at minus 0.2 percent. Exports were near the top of the negative side, reflecting the strong dollar’s negative effect on foreign demand. A rise in imports was the quarter’s biggest negative.

The heavy weather of the quarter contributed to an outright contraction in business spending (nonresidential fixed investment) and an abrupt slowing in consumer spending (personal consumption expenditures).

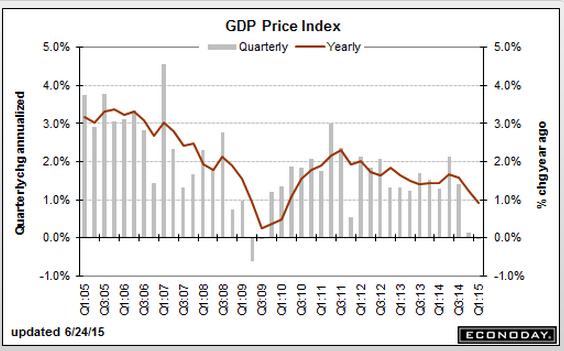
Despite PCE slowing, spending on services, that included an upward revision for restaurants, was the strongest component in the first quarter. Also adding to GDP was an inventory build, one however that was largely unwanted and tied to the quarter’s severe weather and port slowdown. Residential investment was also a positive. The GDP price index was unchanged in the quarter.

First-quarter 2015 wasn’t as badly hit as first-quarter 2014 when GDP sank 2.1 percent, a dip that was then reversed by a 4.6 percent bounce back in second-quarter 2014. Estimates for this second quarter’s GDP growth are settling into the 2 to 3 percent range. We’ll get yet another look at the first quarter with annual revisions on July 30.

I’m sure the Fed sees this:
er-6-24-12

Marginally better:
er-6-24-13

Now 18% over last year. Better, but bank credit numbers don’t show an increase and all cash purchases are down as a % of purchases:

MBA Mortgage Applications
er-6-24-14

Highlights
After swinging up-and-down the past few weeks, mortgage applications inched higher in the June 19 week. Purchase applications rose 1.0 percent with refinancing applications up 2.0 percent. Year-on-year, purchase applications are up a very strong 18.0 percent. Mortgage rates dipped in the week with the average for conforming loan balances ($417,000 or less) down 3 basis points to 4.19 percent.

More signs that US production has peaked and maybe starting to decline, which will mean increased petroleum imports and a higher trade deficit:
er-6-24-15

Comments on transport weakness, Draghi comments, Japan exports to US, new home sales,PMI and Fed indexes chart, Dallas Fed, Richmond Fed, Consumer confidence

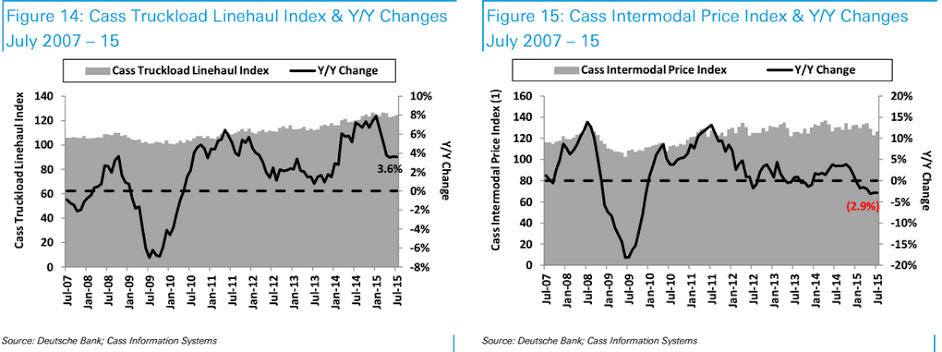
Transport Is Saying Consumer Spending Should Slow Further

By Steven Hansen

When one analyzes the economy, there are always some sections which do better than others. When the economic growth is weak (like currently), several segments can be in contraction while others are expanding.

Everything but the needed fiscal relaxation:

ECB’s Draghi urges euro zone to unite for economic reform

May 23 (Reuters) — “The current situation in the euro area demonstrates that this delay could be dangerous,” ECB President Mario Draghi said while acknowledging progress had been made, for example with banking union. But private risks need to be shared within the euro zone, with financial integration improving access to credit for companies and leading to a complete capital markets union, Draghi said. Countries should observe common standards when implementing structural reforms but also take a country-specific approach, as part of a process of “convergence in the capacity of our economies to resist shocks and grow together”.

Looks like our trade deficit is still on the rise:

“Exports to the United States rose 21.4 percent in the year to April, keeping the pace of gains in the previous month with brisk shipments of cars and vehicle engines.”

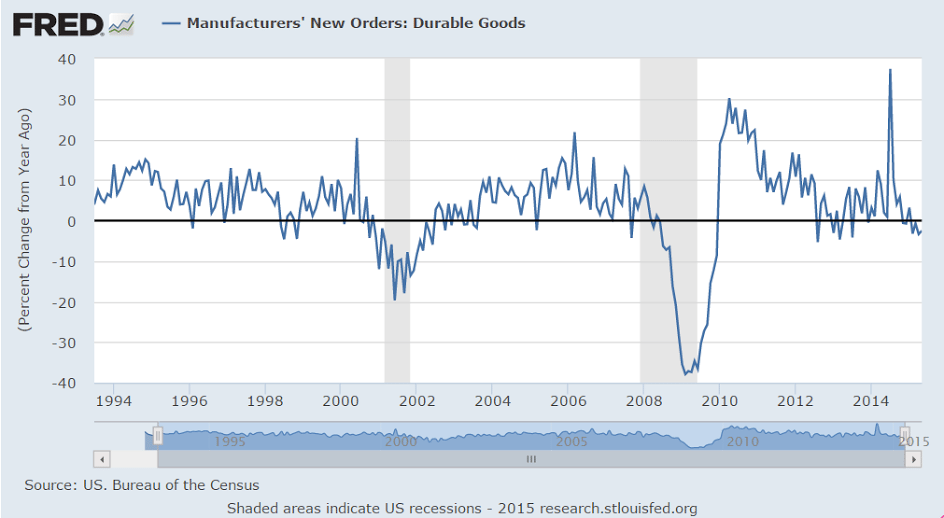
Chart not looking so good:

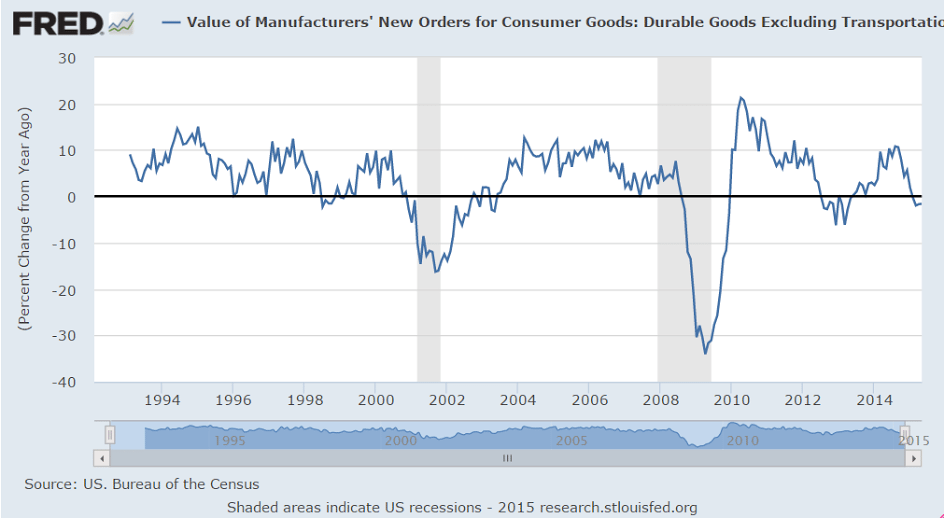
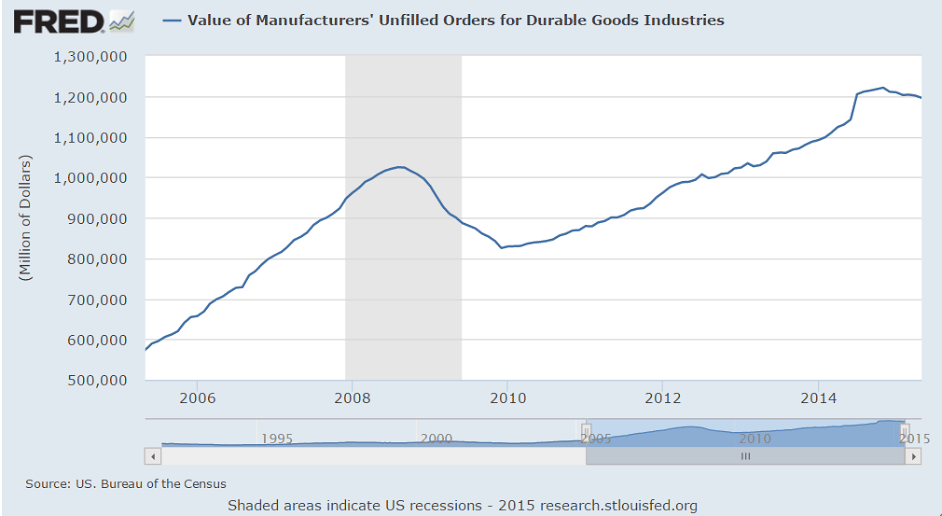
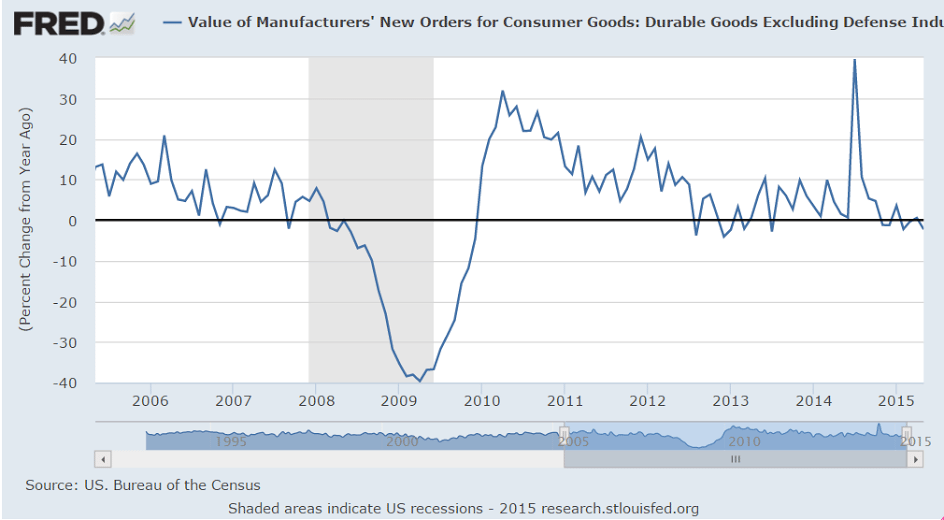
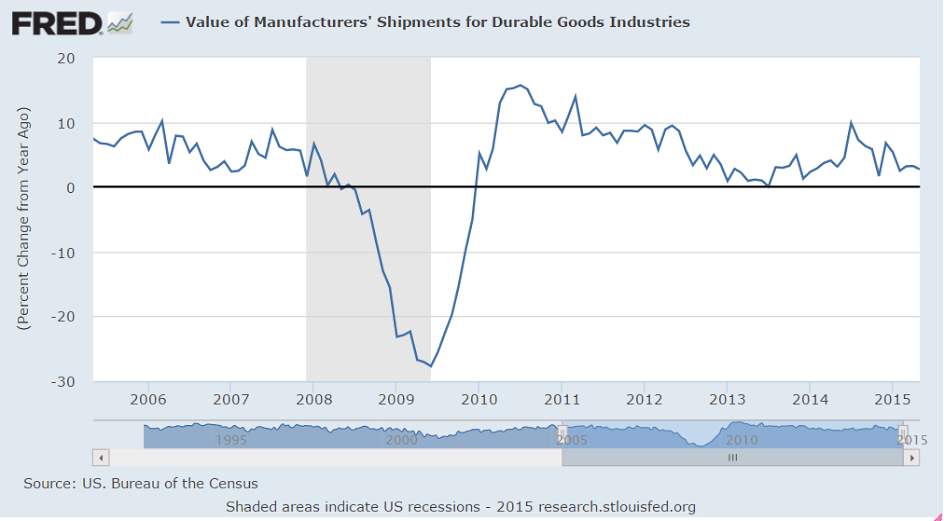
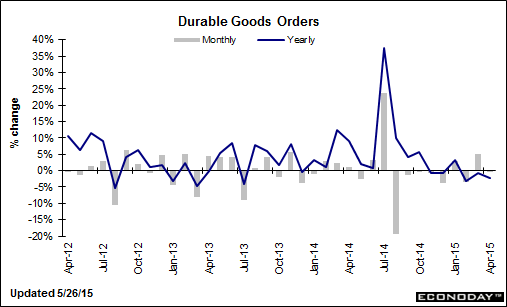
United States : Durable Goods Orders
er-5-26-1
er-5-26-2

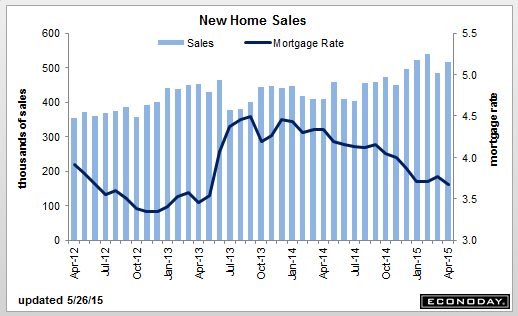
Up a bit after a dip in March but not much different from the Q1 average so hard to say Q2 is doing better than Q1 from this report:

United States : New Home Sales
er-5-26-3
Highlights
New home sales bounced back solidly in April, up 6.8 percent to a 517,000 annual rate that is on the high side of Econoday expectations. Strength is centered in the South which is the largest and important housing region and where sales rose 5.8 percent, this however fails to reverse the region’s 11.8 percent drop in the prior month.

Supply rose slightly in the month, to 205,000 new homes on the market, but supply relative to sales fell to 4.8 months from 5.1 month. Low supply should encourage builders to bring more homes on the market but at the same time low supply hurts current sales. Price readings are mostly favorable led by a 4.1 percent rise in the median price to $297,300 for a strong 8.3 percent year-on-year gain.

Readings in this report are always volatile month-to-month but the gains for April underscore the recent surge in housing starts & permits and help offset last week’s disappointing weakness in existing home sales. The housing sector is still trying to get off the ground but indications, taken together, are improving.
er-5-26-4
er-5-26-5

Again, doesn’t look like Q2 is doing any better than Q1 here either:

er-5-26-6

This is notable as my narrative is about the end of the energy capex that was chasing $100 oil that had been keeping total US GDP positive in 2014. This key indicator of that energy investment is showing the deep cuts have not stabilized but are continuing to take their toll, and the drop in total spending and income necessarily ripples out to the rest of the US and global economies. And note the continuing reports of weakness in exports, as the foreign sector drop in oil capex reduces their ability to import:

United States : Dallas Fed Mfg Survey
er-5-26-7

Highlights
Contraction in the energy sector continues to pull the Dallas Fed report into deeply negative ground, to a headline minus 20.8 vs minus 16.0 and minus 17.4 in the prior two months. Production shows a turn for the worse, at minus 13.5 vs April’s minus 4.7, as does employment, at minus 8.2 vs plus 1.8. New orders remain deeply negative, at minus 14.1 vs minus 14.0. Prices paid also fell further though the decline is easing, to minus 1.7 from minus 11.2.

The regional Fed reports all point to another slow month for the manufacturing sector which is struggling with energy contraction, especially evident in this report, as well as weakness in exports.

Dallas Fed: Texas Manufacturing Activity Contracts Further

Texas factory activity declined again in May, according to business executives responding to the Texas Manufacturing Outlook Survey. … The general business activity index fell to -20.8 in May, its lowest reading since June 2009.

Labor market indicators reflected employment declines and shorter workweeks. The May employment index declined 10 points to -8.2, after rebounding slightly above zero last month. Twelve percent of firms reported net hiring, compared with 21 percent reporting net layoffs. The hours worked index fell from -5 to -11.6.

United States : Richmond Fed Manufacturing Index
er-5-26-8
Highlights
Regional Fed reports on the manufacturing sector continue to be soft with Richmond’s at only plus 1 for May following two prior months of declines. New orders, after three straight declines, did rise but only to plus 2. Backlog orders, however, remain deep in the negative column at minus 10.

Employment growth is down while shipments are in contraction for a 4th month. Price readings are flat except for wages which show a big 11-point gain to 20. Wage pressures are a trigger for an FOMC rate hike and this reading, though isolated, will get the attention of the hawks at the Fed.

First it was Empire State, then the Philly Fed, then Kansas City, all showing weakness this month and now including Richmond. Data from the Dallas Fed, also released this morning, is especially weak. The manufacturing sector is having a tough time gaining momentum, held down by weak exports and contraction in the energy sector.

This is one man one vote, not one dollar one vote, and is another indicator where Q2 isn’t doing as well as Q1:
er-5-26-9

IMF re France, truck tonnage, China PMI, Japan PMI

More of same pro cyclical pressure:

France slammed by IMF for record-high spending

By Holly Ellyatt

May 20 (CNBC) — The International Monetary Fund (IMF) has warned France that it must reduce government spending and debt levels, as well as tackling its sticky unemployment rate.

The IMF said in its latest economic outlook on France, published on Tuesday, that although it sees a “solid short-term recovery (in France), structural rigidities continue to weigh on medium-term prospects.”

“Continued efforts are needed to tackle France’s fundamental economic problems: high structural unemployment, low potential growth, and record-high public spending,” the group added.

Indeed, the IMF noted that high and rising government spending has been “at the heart” of France’s fiscal problems for decades.

Trucking Tonnage Index Slumps in April 2015. Lowest Level In One Year.

Econintersect: The American Trucking Associations’ (ATA) trucking index declined 3% following an downwardly revised improvement of 0.4% in March. From ATA Chief Economist Bob Costello:

Still headed south. Maybe just a few more rate cuts…

New export orders declined means exporters putting more pressure on the govt to buy its euro back…

:(

China : PMI Flash Mfg Index
er-5-21-1
Highlights
May’s flash manufacturing PMI remained mired in contraction with a reading of 49.1 which was an improvement over April’s reading of 48.9. The output index which was at the breakeven point between growth and contraction in April, skidded to a reading of 48.4. New orders decreased at a slower rate while new export orders declined after increasing in April. Five sub-indexes decreased but at a slower rate. These included employment, output and input prices, backlogs of work and stocks of purchases.

A bit of hope here as weak currency/lower relative wages drives a few export orders:

Japan : PMI Manufacturing Index Flash
er-5-22-2
Highlights
Japanese manufacturing returned to growth in May with its best performance since February. Japan’s flash May manufacturing PMI reading was 50.9, up a full point from the April final of 49.9. A reading above 50 signifies growth. The flash output index climbed to 51.7 from 49.3 in April. Along with these readings, new orders increased, changing direction. Both export orders and employment increased at a faster pace in May. However, backlogs decreased at a faster rate. Both the stocks of purchases and finished goods changed direction and decreased. The readings, if confirmed when the final PMI is released for May is a favorable sign that points to stabilization in the economy.

Japan Q1 GDP, Sea Containers, home building charts

Looks like mainly inventory building:

Japan : GDP
er-5-20-1
Highlights
The Japanese economy appears to be recovering with its second consecutive quarter of growth. First quarter gross domestic product was up 0.6 percent on the quarter – consensus was for a 0.4 percent quarterly gain. On an annualized basis, GDP was up 2.4 percent. However, GDP was down 1.4 percent when compared with the same quarter a year ago. Fourth quarter GDP was revised down to a gain of 0.3 percent on the quarter or an annualized pace of 1.1 percent.

Among the components, domestic demand contributed 0.8 percentage point while net exports subtracted 0.2 percentage point. CAPEX contributed 0.1 percent while inventories added 0.5 percentage point. Private consumption was up 0.4 percent on the quarter as was CAPEX. Government consumption was up 0.1 percent.

From CNBC:

Economists have been watching Japan’s economic data closely for signs Abenomics, or Japanese Prime Minister Shinzo Abe’s plan to kick-start the long-moribund economy out of its decades-long struggle against deflation, has made any progress.

Some are unconvinced that the GDP data will herald a sustained recovery.

“The acceleration in GDP growth last quarter was mostly due to a jump in inventories, and a range of indicators point to a slowdown in the second quarter,” Marcel Thieliant, a Japan economist at Capital Economics, said in a note Wednesday. He expects Japan’s GDP growth will be around zero for the year, adding that the data suggest that the near-term chances of further easing from the Bank of Japan have diminished.

And not everyone is convinced domestic demand is making a comeback. In a note, DBS says private consumption on an annualized basis, while up 1.4 percent, grew at a similar rate as in the third and fourth quarters of 2014

“The cumulative growth in consumption in the past three quarters has remained far from enough to offset the contraction in early-2014 caused by the sales tax hike. This means that consumer spending remained far weaker than the normal levels prior to the tax hike,” DBS said.

“Admittedly, the pace of consumption recovery has remained very slow so far and whether it could pick up and match expectations in the coming quarters will remain to be seen,” the note added.

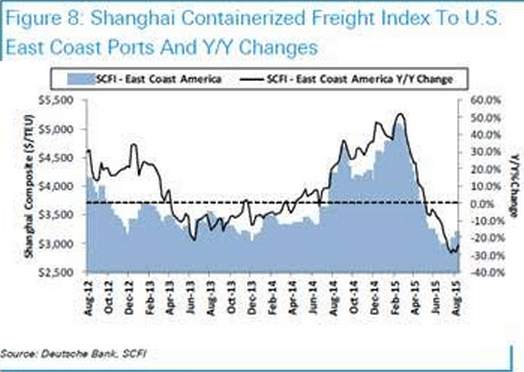
April 2015 Sea Container Counts Continue to Demonstrate Weak Conditions in the USA and Globally

By Steven Hansen

The data for this series continues to be weak. Not only is year-to-date volumes contracting for both imports and exports – but both April exports and imports are contracting month-over-month and year-over-year. This continues to indicate weak economic conditions domestically and globally.

And note how depressed sales and starts remain:
er-5-20-2

er-5-20-3

United States : MBA Mortgage Applications

er-5-20-4

Highlights
The ongoing run up in mortgage rates may be easing demand for mortgage applications just at the time that demand for purchase applications had been gaining steam. Purchase applications fell 4.0 percent in the May 15 week though, year-on-year, applications are still up a very strong 11.0 percent. Refinancing applications slipped 0.3 percent in the week. The average 30-year mortgage for conforming loan balances ($417,000 or less) rose to its highest level of the year, up 5 basis points to 4.04 percent. Watch for existing home sales on tomorrow’s calendar.

Down big:
er-5-20-5

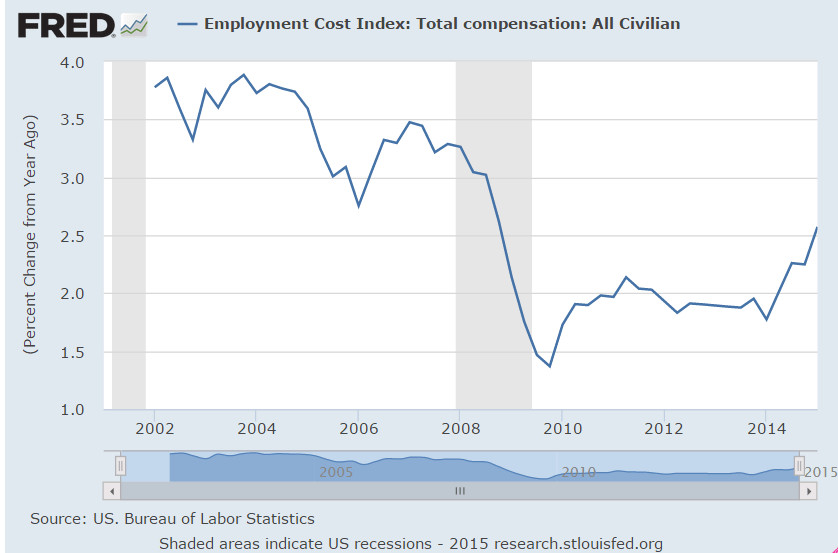
The Fed’s concerned about the employment cost index?

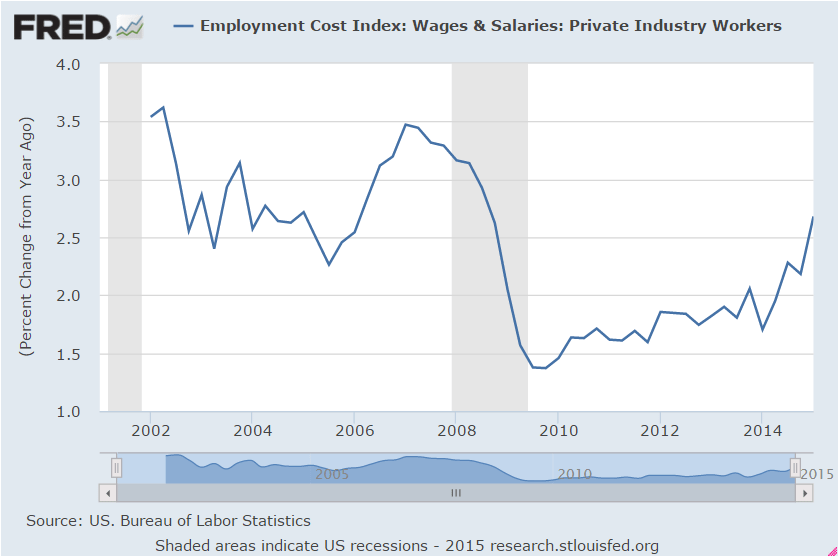
Not even up to the growth rate lows of the last cycle:

er-5-20-6
Just got through prior growth rate lows after years of being much lower:
er-5-20-7