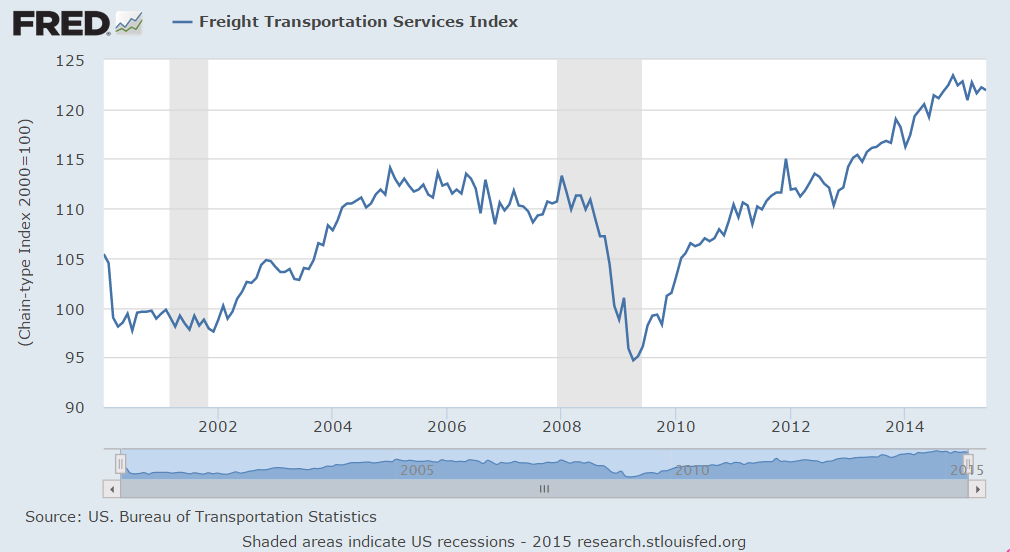
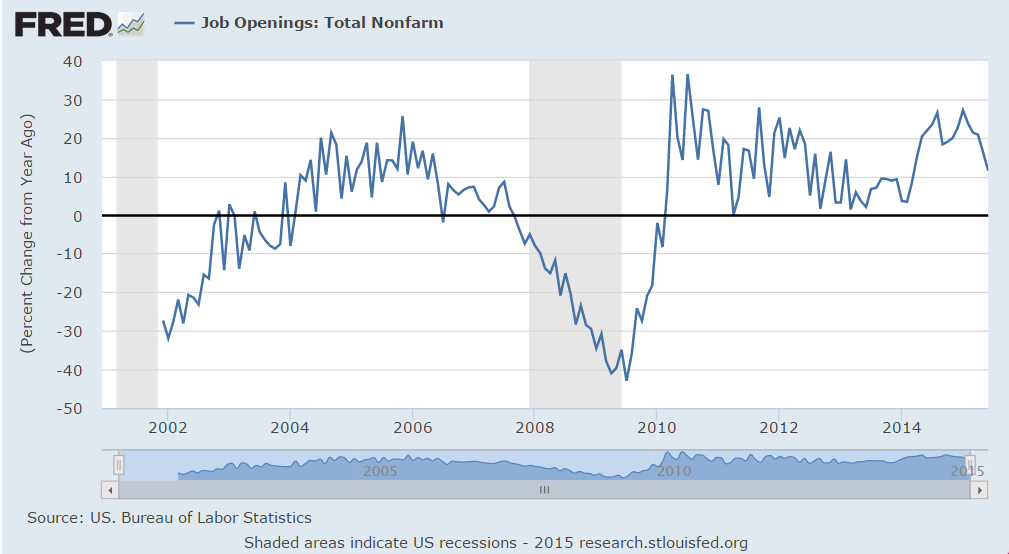
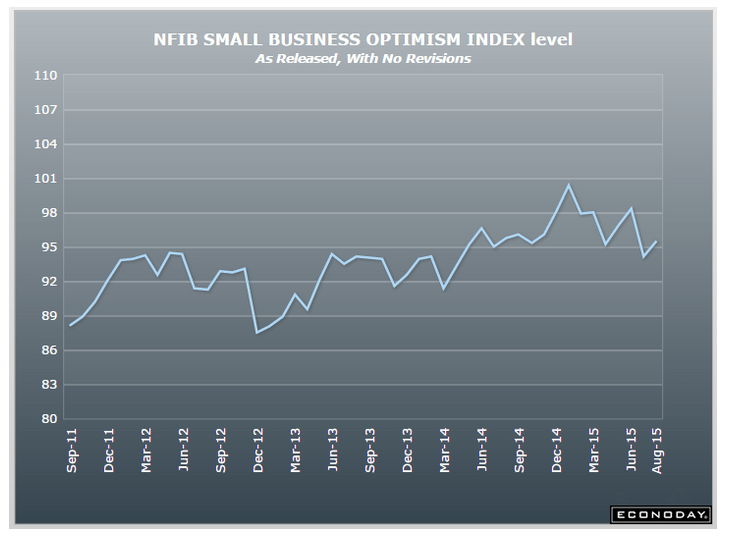
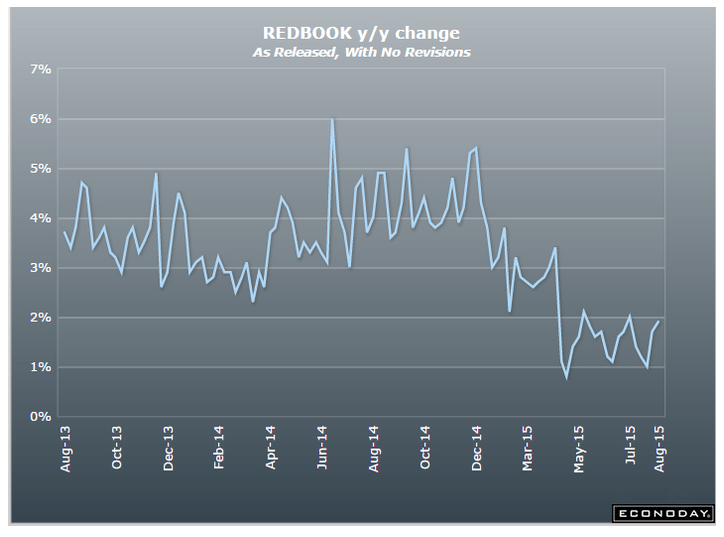
Retail Sales, Jobless Claims, Import Export Prices, Business Inventories, Japan Machine Orders, Freight Transportation, Gas Prices


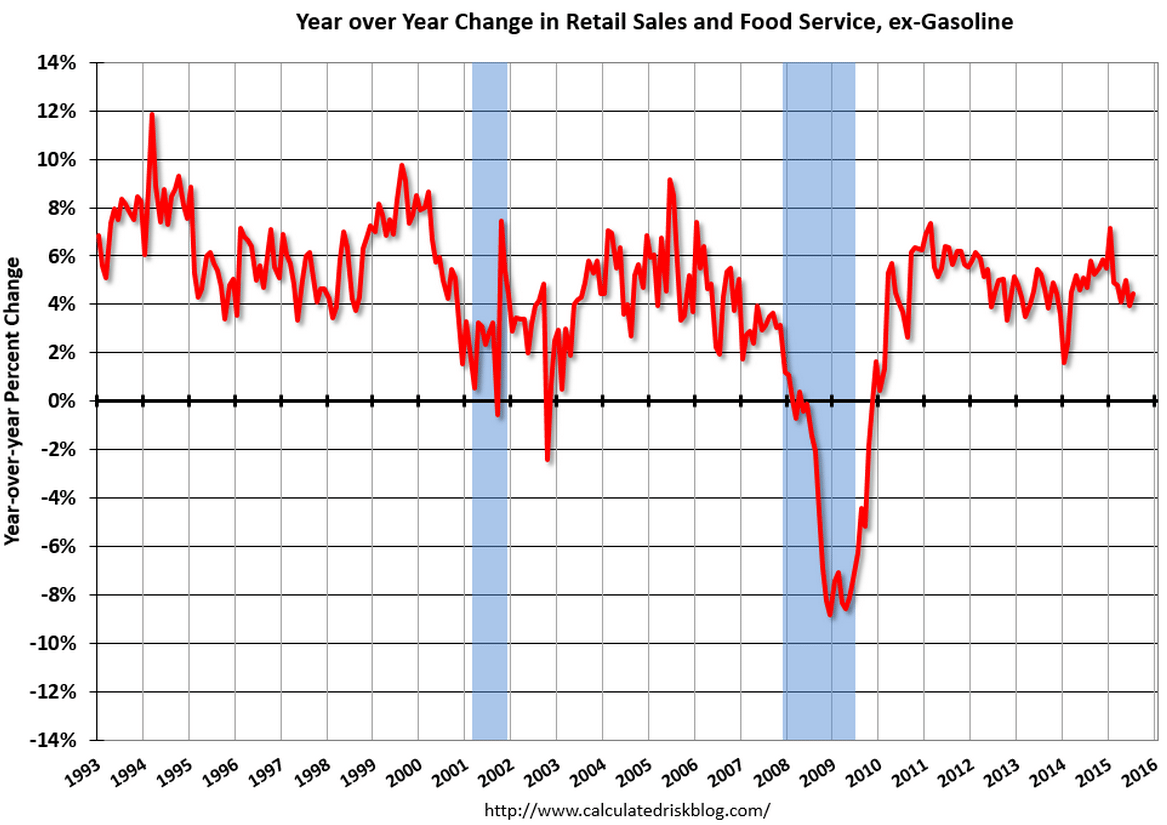
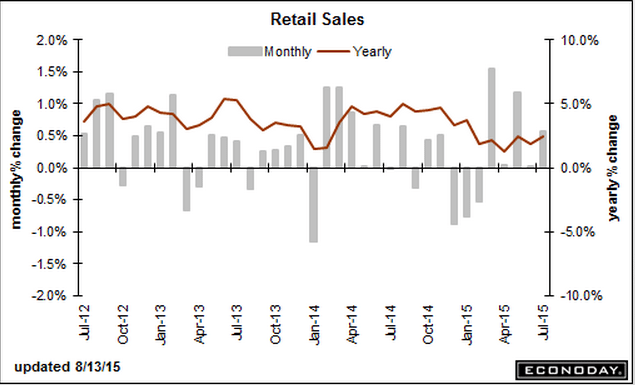
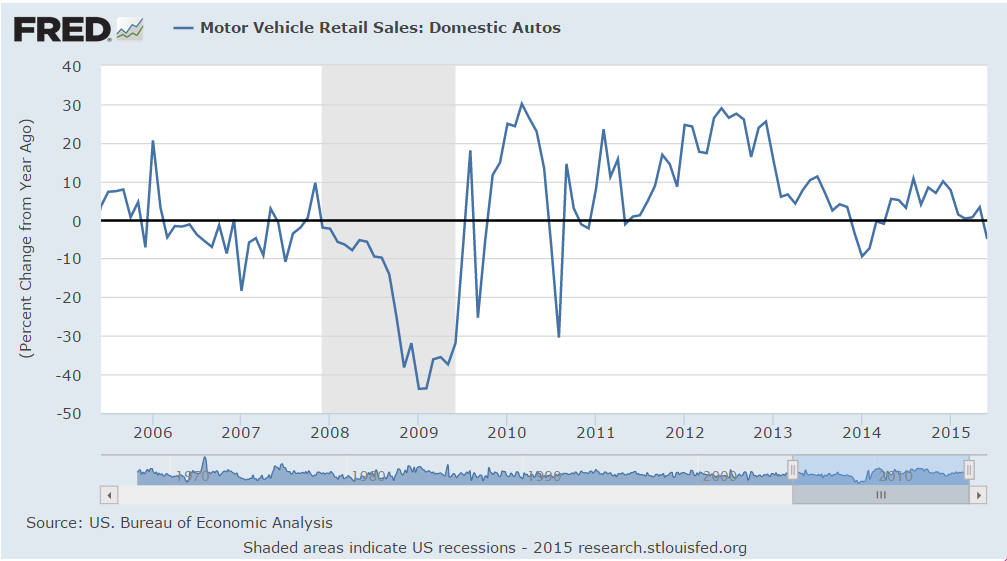
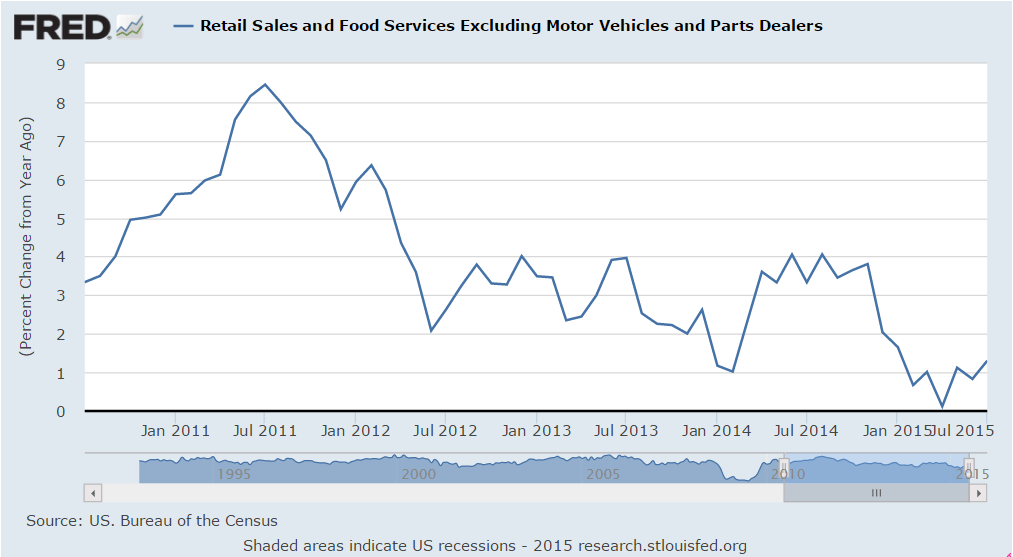
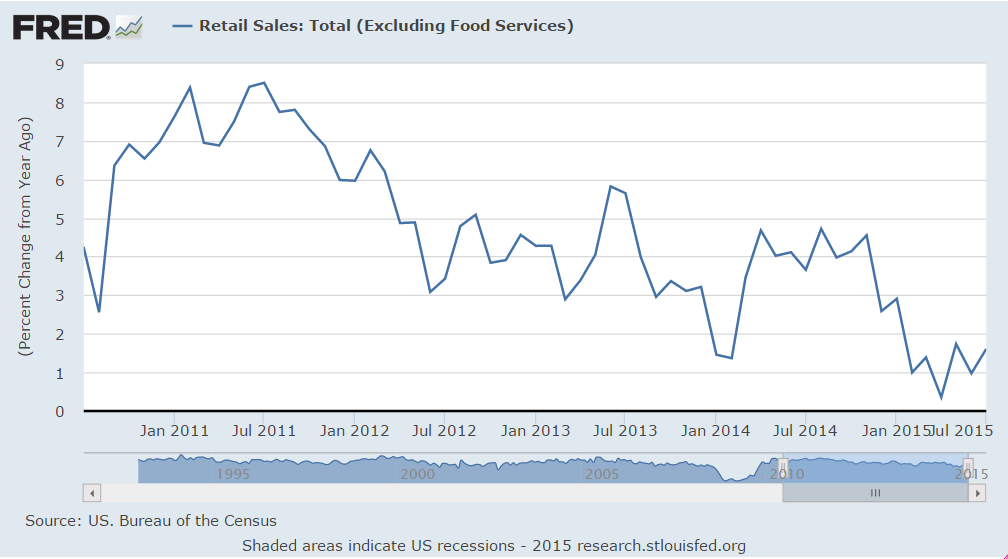
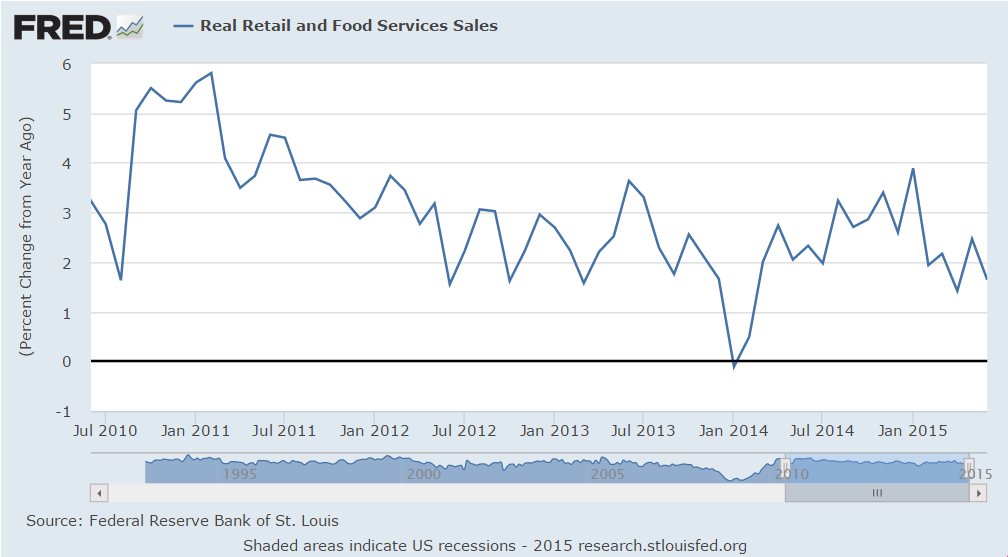
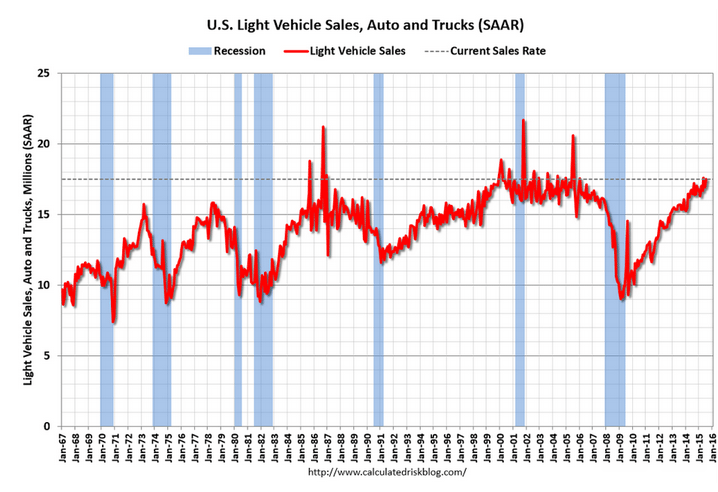
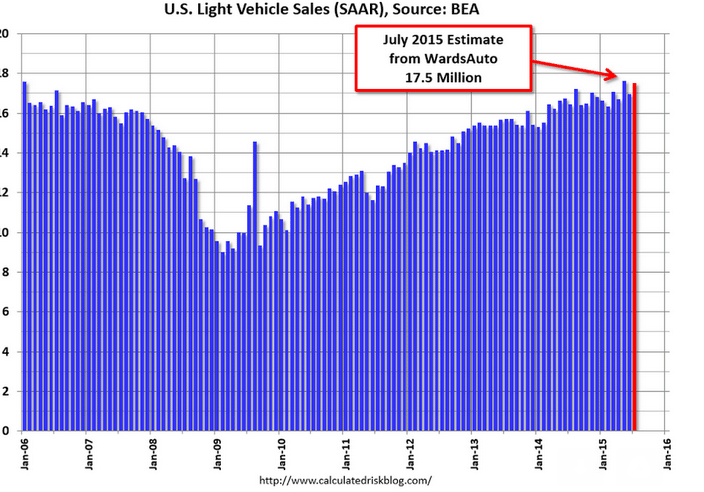
This is being touted as a strong report, but, again, looks to me like it’s dropped since year end and at best is moving sideways from there, and not to forget that a large share of auto sales are imports.

But I do agree the Fed is heck bent on raising rates in Sept, even without ‘some’ improvement, and will do so unless there’s a stock market decline severe enough to hold them back. So far that’s not happening.

Retail Sales
er-8-13-1

Highlights
Big upward revisions underscore a very solid and very important retail sales report. Retail sales rose 0.6 percent in July with June revised to unchanged from an initial reading of minus 0.3 percent and with May revised to a jump of 1.2 percent from 1.0 percent. The revisions to June and May point to an upward revision for second-quarter GDP.

Vehicle sales, as expected, were the standout in July, jumping 1.4 percent to nearly reverse June’s 1.5 percent slide and nearly matching May’s historic 1.9 percent surge. But even outside vehicles, retail sales were strong with the ex-auto reading rising a solid 0.4 percent. Restaurants, in another strong signal of consumer strength, rose an outsized 0.7 percent following June’s 0.5 percent gain. These are very strong gains for this component. Excluding both vehicles and gasoline, retail sales rose 0.4 percent, again another solid reading.

Strength in both vehicles and restaurants point to the health of the US consumer and will likely give the hawks the courage, despite all the troubles in China, to push for a rate increase at the September FOMC.

er-8-13-4

er-8-13-5

er-8-13-6

er-8-13-7

er-8-13-8

er-8-13-9

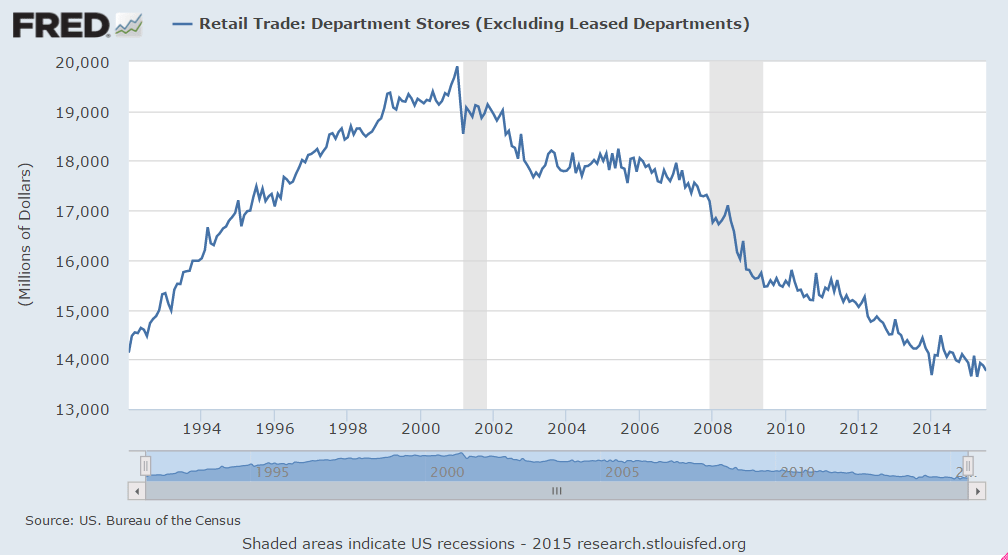
Tough times for department store sales continue, which explains some of the weakness in construction:

er-8-13-10

‘Some’ deterioration:

Jobless Claims
er-8-13-11

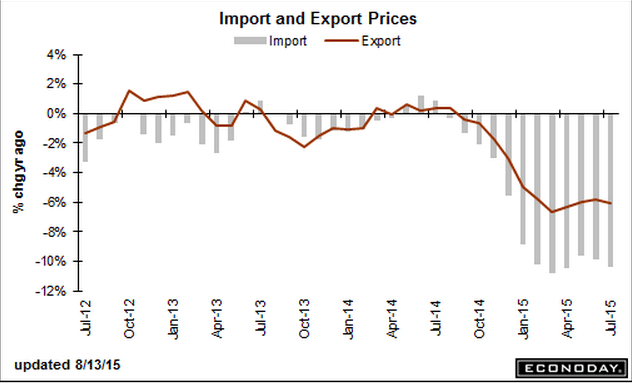
‘Some’ deterioration for Fed hopes of higher inflation. It’s been failing to hit its target for longer than I can remember…

er-8-13-12


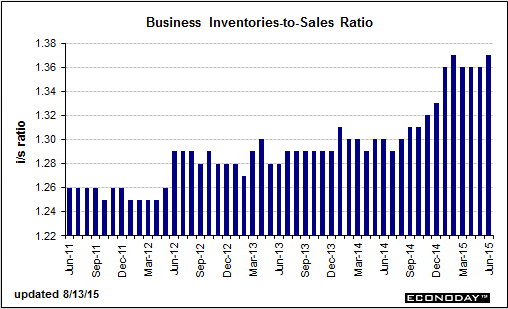
Excess inventory building in June helps Q2 GDP but the likely subsequent production cuts will hurt Q3. The now persistently too high inventory to sales ratio is overdue for a correction:

United States : Business Inventories
er-8-13-13

Highlights
Inventories rose relative to sales in June but the news isn’t that bad given that the build was centered in autos. Business inventories rose 0.8 percent in June which was well ahead of a 0.2 percent rise in sales. The mismatch lifts the inventory-to-sales ratio to 1.37 from 1.36.

But retail inventories at auto dealers were to blame, up 1.4 percent in June and contributing to a 0.7 percent rise for the retail component. Inventories at manufacturers and wholesalers, the two other components of the business inventory report, also rose, up 0.6 and 0.9 percent respectively.

Inventories are on the heavy side but the concentration in autos is welcome given how strong sales are, evidenced by the 1.4 percent surge for the motor vehicle component of the July retail sales report released earlier this morning. Note that this report, along with the retail sales report, are likely to lift revision estimates for second-quarter GDP.
er-8-13-14

Global weakness continues:

Japan : Machine Orders
er-8-13-15

Highlights
June seasonally adjusted machine orders (excluding volatile items) declined for the first time since February. They dropped a larger than anticipated 7.9 percent on the month and were up 14.7 percent on the year. Core orders were up 16.6 percent based on the original series. This was in contrast to expectations of a 17.5 percent increase.

Core machine orders are considered a proxy for private capital expenditures. The downward move followed a 0.6 percent gain a month before. The government repeated its assessment that machine orders would advance in the third quarter.

Nonmanufacturing orders excluding volatile items were up 5.0 percent while manufacturing orders dropped 14.0 percent. All orders including volatile items dropped 6.2 percent on the month. Manufacturing orders likely softened on continued weaker export demand while the sluggish domestic economy weighs on nonmanufacturers.”

Another weak looking index:

er-8-13-16


And I’d call this ‘some’ deterioration in the ‘labor market’. Looks like it was weakening before the 2014 oil capex boom supported it, and then has fallen off since the oil price collapse:

er-8-13-17


This is to the point I’ve been making that surveys are one man one vote, not one dollar one vote, so optimism remained high even as retail sales, for example, were fading. Yes, a lot more people saved $10 per week on gas but an equal amount of income was reduced for sellers of oil, including those earning royalties and holding leases, and investors of all sorts, and seems the spending cuts on domestic product by that group outweighed the additional spending from pump savings.

Fueled by low pump prices, U.S. motorists to drive more in August – survey

By Jarrett Renshaw

August 11 (Reuters)

U.S. motorists are paying an average of $2.58 per gallon, nearly a dollar less than a year ago, according to AAA, the nation’s largest motorist advocacy group. And a quarter of respondents expected prices to continue to decline, up from 10 percent a month ago.

The survey found that nearly 80 percent of people say gas prices influence how they feel about the economy. And with gas prices down nearly $1 from a year ago, U.S. motorists are feeling positive about the direction of the economy, the survey found.

“There is good news for retailers as consumer optimism picks up during peak vacation season,” said NACS Vice President of Strategic Industry Initiatives Jeff Lenard.

China, Germany, Productivity, NFIB Index, Redbook, Wholesale Trade


A few thoughts:

China’s US Tsy holding had been falling perhaps because they were selling $ to buy Yuan to keep it within in the prior band.
Pretty much all exporting nation’s currencies have already weakened vs the $, including the Yen and Euro, so this is a bit of a ‘catch up.’

In a weakening global economy from a lack of demand (sales) and ‘western educated, monetarist, export led growth’ kids now in charge globally, the path of least resistance is a global race to the bottom to be ‘competitive’. And the alternative to currency depreciation, domestic wage cuts, tends to be less politically attractive, as the EU continues to demonstrate.
The tool for currency depreciation is intervention in the FX markets, as China just did, after they tried ‘monetary easing’ which failed, of course. Japan did it via giving the nod to their pension funds and insurance companies to buy unswapped FX denominated securities, after they tried ‘monetary easing’ as well.

The Euro zone did it by frightening China and other CB’s and global and domestic portfolio managers into selling their Euro reserves, by playing on their inflationary fears of ‘monetary easing’-negative rates and QE- they learned in school.

The US used only ‘monetary easing’ and not any form of direct intervention, and so the $ remains strong vs all the rest.

I expect the Euro to now move ever higher until its trade surplus goes away, as global fears of an inflationary currency collapse are reversed and Euro buying resumes as part of global export strategies to export to the Euro zone. And, like the US, the EU won’t use direct intervention, just more ‘monetary easing’.

Ironically, ‘monetary easing’ is in fact ‘fiscal tightening’ as, with govts net payers of interest, it works to remove interest income from the global economy. So the more they do the worse it gets.

‘No matter how much I cut off it’s still too short’ said the hairdresser to the client…

The devaluations shift income from workers who see their purchasing power go down, to exporters who see their margins increase.
To the extent exporters then reduce prices and those price reductions increase their volume of exports, output increases, as does domestic employment. But if wages then go up, the ‘competitiveness’ gained by the devaluation is lost, etc., so that’s not meant to happen.

Also, the additional export volumes are likewise reductions in exports of other nations, who, having been educated at the same elite schools, respond with devaluations of their own, etc. etc. in a global ‘race to the bottom’ for real wages. Hence China letting their currency depreciate rather than spend their $ reserves supporting it.

The elite schools they all went to contrive models that show you can leave national deficit spending at 0, and use ‘monetary policy’ to drive investment and net exports that ‘offset’ domestic savings. It doesn’t work, of course, but they all believe it and keep at it even as it all falls apart around them.

But as long as the US and EU don’t have use of the tools for currency depreciation, the rest of the world can increase it’s exports to these regions via currency depreciation to lower their $ and Euro export prices, all of which is a contractionary/deflationary bias for the US and EU.

Of further irony is that the ‘right’ policy response for the US and EU would be a fiscal adjustment -tax cut or spending increase- large enough to sustain high enough levels of domestic spending for full employment. Unfortunately, that’s not what they learned in school…

The drop in expectations is ominous, particularly as the euro firms:

Germany : ZEW Survey
er-8-11-1

Highlights
ZEW’s August survey was mixed with a slightly more optimistic assessment of the current state of the economy contrasting with a fifth consecutive decline in expectations.

The current conditions gauge was up 1.8 points at 65.7, a 3-month high. However, expectations dipped a further 4.7 points to 25.0, their lowest mark since November 2014.


The drop in unit labor costs and downward revision of the prior increase gives the Fed cause to hold off on rate hike aspirations:

United States : Productivity and Costs
er-8-11-2

Highlights
A bounce back for output gave first-quarter productivity a lift, up a quarter-to-quarter 1.3 percent vs a revised decline of 1.1 percent in the first quarter. The bounce in output also held down unit labor costs which rose 0.5 percent vs 2.3 percent in the first quarter.

Output in the second quarter rose 2.8 percent vs a depressed 0.5 percent in the first quarter. Compensation rose 1.8 percent, up from 1.1 percent in the first quarter, while hours worked were little changed, up 1.5 percent vs 1.6 in the first quarter.

Looking at year-on-year rates, growth in productivity is very slight at only plus 0.3 percent while costs do show some pressure, up 2.1 percent in a reading, along with the rise in compensation, that will be welcome by Federal Reserve officials who are hoping that gains in wages will help offset weakness in commodity costs and help give inflation a needed boost.


Up a touch but the trend remains negative:

er-8-11-3


Redbook retail sales report still bumping along the bottom:

er-8-11-4


A decline in sales growth and rise in inventories is yet another negative:

United States : Wholesale Trade
er-8-11-5

Highlights
A build in auto inventories as well as for machinery drove wholesale inventories up a much higher-than-expected 0.9 percent in June. Sales at the wholesale level rose only 0.1 percent in the month, in turn driving the stock-to-sales ratio up 1 notch to a less-than-lean 1.30. This ratio was at 1.19 in June last year.

PMC, Personal Income, ISM Manufacturing, Construction Spending, Car Sales

Another PMC, and an estimated $45 million check to Boston’s Dana Farber for cancer research! Congrats to all the donors and participants- over 6,000 riders and thousands of volunteers handling the logistics!

Special nod to Billy and Meredith Starr for a most successful 35th PMC and total donations approaching $500 million!!!

And thanks to all of you who contributed and those who will be contributing… ;)

(Note Elizabeth’s sandals with spd clips :)
er-8-3-3

Personal Income and Outlays

er-8-3-4

Highlights
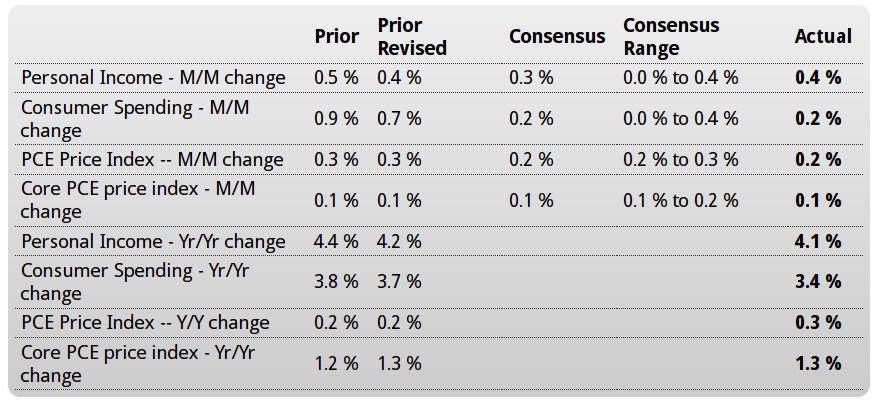
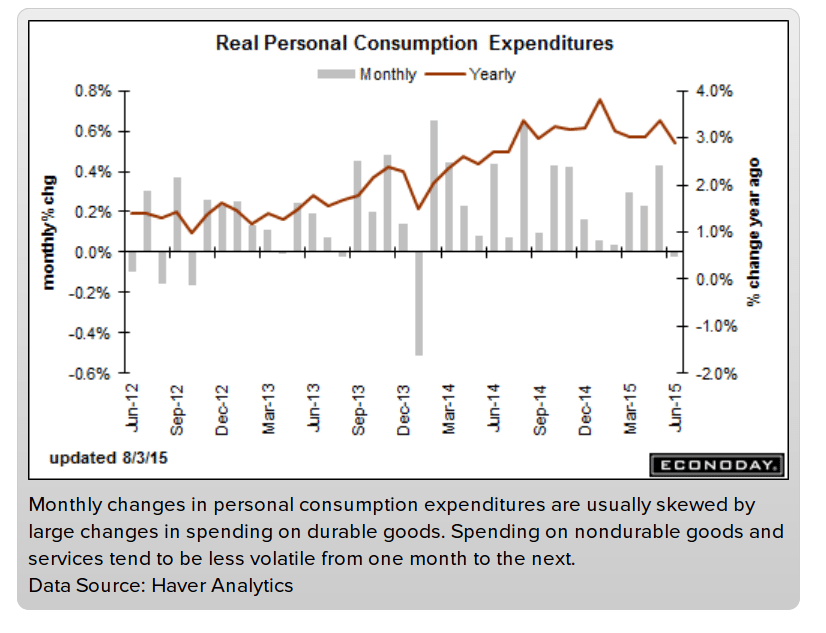
The consumer showed less life in June with inflation remaining very quiet. Consumer spending rose an as-expected 0.2 percent in June, down from a revised spike of 0.7 percent in May with the slowing tied in part to lower vehicle sales. Personal income, boosted by gains for rents and transfers that offset slight slowing in wages, rose slightly more than expected at 0.4 percent.

The key inflation reading in this report, the core PCE price index, rose only 0.1 percent for a very quiet 1.3 percent year-on-year rate that won’t be moving up expectations for the Federal Reserve’s rate hike. The year-on-year rate is at a 4-1/2-year low and has remained below 1.5 percent since November. The overall price index rose 0.2 percent in June with its year-on-year rate, reflecting the collapse in oil prices, at only plus 0.3 percent.

The savings rate is below 5.0 percent at 4.8 percent but remains on the high side, which points to consumer health and hints at underlying spending strength. The economy is just bumping along right now, pointing to no urgency for policy change.

Wage income down:

PERSONAL INCOME AND OUTLAYS: JUNE 2015

August 3 (Bureau of Economic Analysis)
Wages and salaries increased $18.3 billion in June, compared with an increase of $32.0 billion in May. Private wages and salaries increased $16.0 billion in June, compared with an increase of $29.6 billion in May. Government wages and salaries increased $2.3 billion, compared with an increase of $2.4 billion.

Without the big jump in reported personal dividend income personal income would have been lower:

Rental income of persons increased $7.4 billion in June, compared with an increase of $7.7 billion in May. Personal income receipts on assets (personal interest income plus personal dividend income) increased $20.2 billion, compared with an increase of $8.4 billion. Personal current transfer receipts increased $8.6 billion, compared with an increase of $8.9 billion.

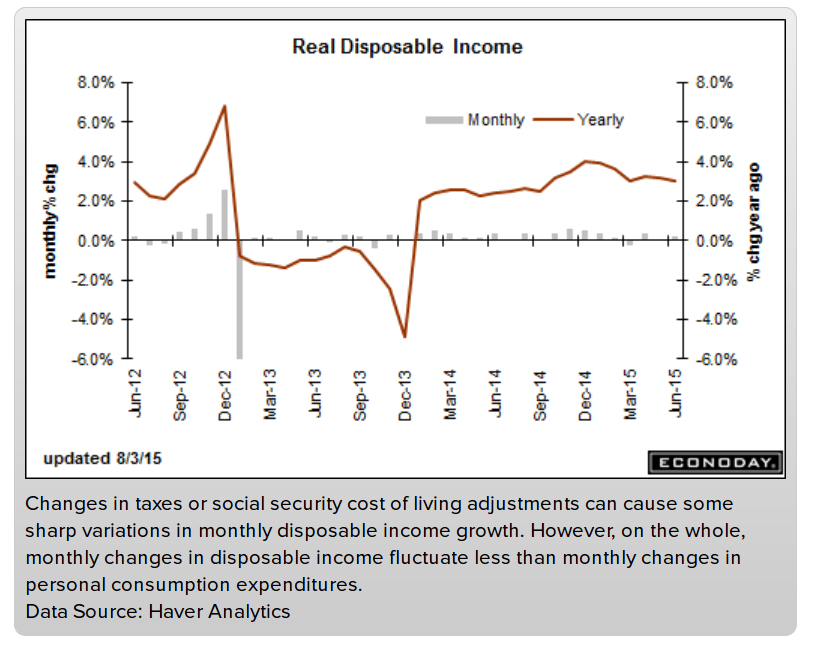
Lower tax payments helped disposable personal income but it’s still a very low rate of growth:

Personal current taxes increased $7.5 billion in June, compared with an increase of $12.5 billion in May. Disposable personal income (DPI) — personal income less personal current taxes — increased $60.6 billion, or 0.5 percent, in June, compared with an increase of $53.8 billion, or 0.4 percent, in May.

Real DPI — DPI adjusted to remove price changes — increased 0.2 percent in June, compared with an increase of 0.1 percent in May.

Like most all indicators, there’s been a falling off since oil prices broke during Q4 2014:

er-8-3-5

er-8-3-6

source: Bureau of Economic Statistics
Disposable personal income was revised up $19.7 billion, or 0.2 percent, for 2012; was revised down $109.5 billion, or 0.9 percent, for 2013; and was revised down $76.1 billion, or 0.6 percent, for 2014.

Personal outlays was revised down $30.8 billion, or 0.3 percent, for 2012; was revised down $91.4 billion, or 0.8 percent, for 2013; and was revised down $63.7 billion, or 0.5 percent, for 2014. Revisions to personal outlays primarily reflected downward revisions to PCE.

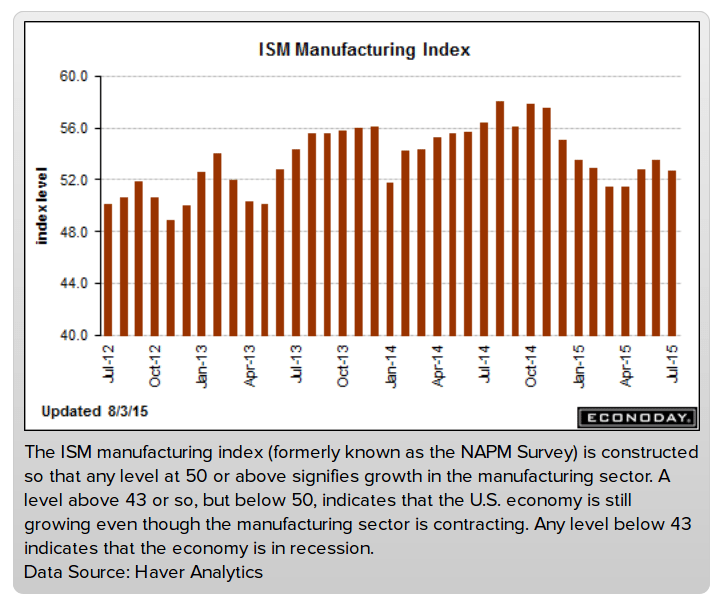
Exports again, and now employment showing weakness in the latest reports:

ISM Mfg Index

er-8-3-7

Highlights
Weak employment and continued contraction in exports held down the manufacturing index which slipped 0.8 tenths in July to a lower-than-expected 52.7 to indicate slowing monthly activity for ISM’s sample. Employment growth slowed nearly 3 points to 52.7 while new export orders fell 1.5 points to 48.0 for the 5th sub-50 contractionary reading of the last 7 months.

But there are signs of strength in the report led by new orders which rose 1/2 point to 56.5 which is the strongest reading of the year for this most important of all readings. The gain contrasts with the drop in export orders and points to strength in the domestic economy. Production is also strong at 56.0.

But another negative in the report is sharp contraction in backlogs, down 4.5 points to 42.5 to signal the sharpest draw in nearly 3 years. This drop helps explain the slowing in employment but is offset in the longer term outlook by the rise in new orders.

This report is mixed with export orders pointing to continuing headwinds for the manufacturing sector though total new orders are a plus. Note that this report was posted before its usually scheduled 10:00 a.m. ET release time.

er-8-3-8

er-8-3-9

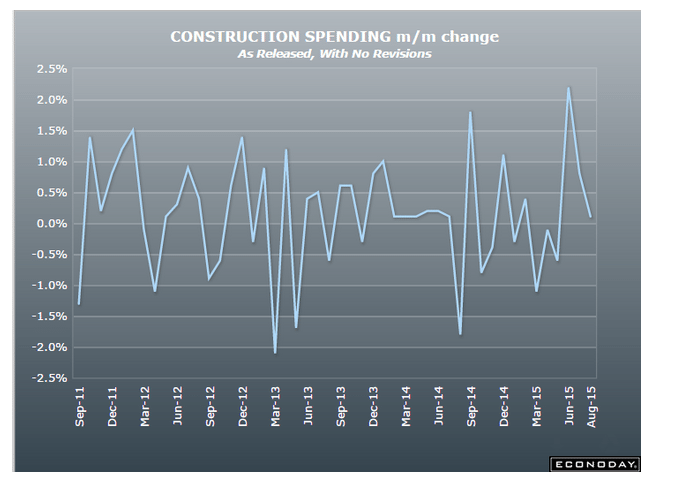
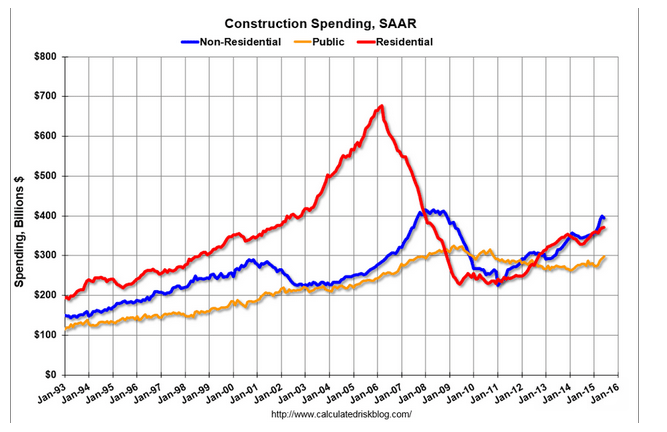
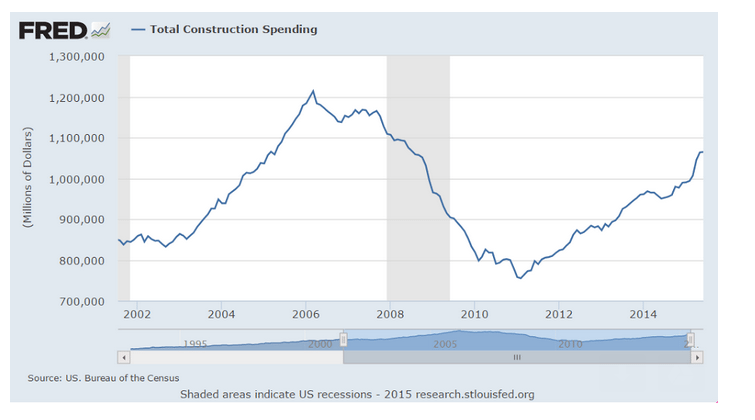
Construction up nicely vs last year this time, but not so much vs earlier this year, and some of it is the NY thing regarding getting started ahead of expiring credits as previously discussed, which look to have been followed by a sharp fall off:

Construction Spending

source: Econoday.com
er-8-3-10

Highlights
Held back by a slight and unexpected decline in single-family homes, construction spending inched only 0.1 percent higher in June. Spending on new single-family homes slipped 0.3 percent in June following gains of 0.5 percent and 1.0 percent in the prior two months. Showing much greater strength are multi-family units, up 2.8 percent in June following prior gains of 1.3 and 3.4 percent. Year-on-year, single-family homes are up a very strong 12.8 percent while multi-family is up 23.7 percent.

The biggest drag to June comes from the private non-residential category which fell 1.3 percent reflecting sweeping monthly declines for offices, commercial structures, factories along with power and transportation spending. On the plus side were construction for highways and education.

Housing permit data point to strength ahead for single-family construction spending along with continued standout strength for the multi-family category. But the decline on the non-residential side does underscore weakness right now in business investment. But taken together, total spending is still up a very constructive 12.0 percent year-on-year and the second-half outlook is still positive.

er-8-3-11
er-8-3-12

Not adjusted for inflation:

er-8-3-13

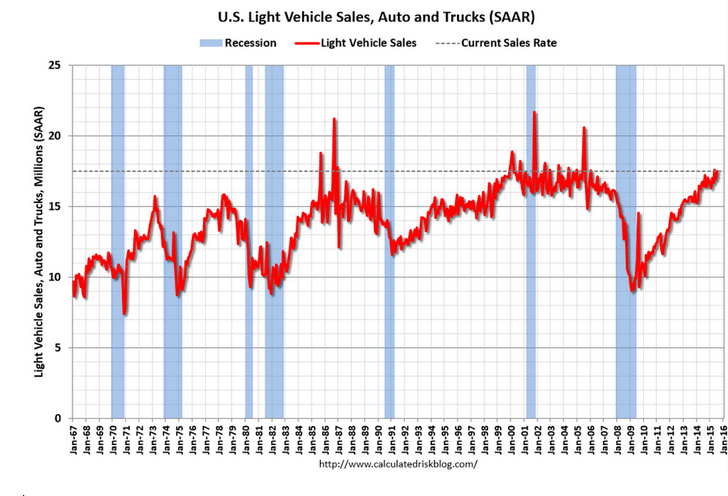
Motor vehicle sales looking up, estimated at a 17.5 million annual rate, almost as high as May and split between domestic and imports isn’t out yet. Domestically produced car sales have been down year over year:

er-8-3-14
er-8-3-15

GDP Income, Saudi Oil Output, Restaurant Index

BEA Reports 2nd Quarter 2015 GDP Growing at 2.32%:

By Rick Davis

July 30 (Consumer Metrics)

Real annualized per capita disposable income was reported to be $37,846, some -$364 per year less than the previously reported $38,210 per annum. All of that downside came as a result of revisions to the prior quarter’s data, which was revised downward by -$437 (over a full percent). Meanwhile, the household savings rate plunged to 4.8% — down -0.7% from the previously reported 5.5%.

For this revision the BEA assumed an annualized deflator of 2.04%. During the same quarter (April 2015 through June 2015) the inflation recorded by BLS in their CPI-U index was 3.52%. Under estimating inflation results in optimistic growth rates, and if the BEA’s “nominal” data was deflated using CPI-U inflation information the headline number would show a more modest +0.89% growth rate.

Especially hard hit in the revisions were the real per-capita disposable income numbers. The cumulative compound annualized growth rate for real disposable income has been only +0.45% since the second quarter of 2008. And these figures represent mean incomes that are skewed by disproportionate growth at the upper end. According to Sentier Research, median incomes during the same time span have contracted by roughly 4%.

And household savings rates have been weaker than previously suspected, confirming the lower incomes.

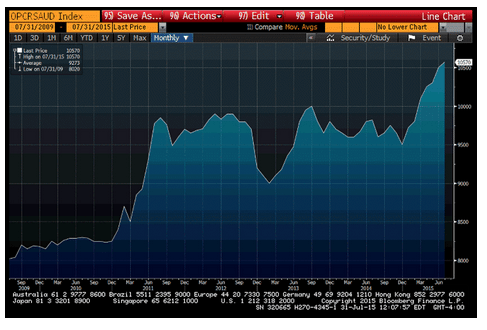
Demand for Saudi oil firm and up a bit:

er-8-2-1

Even this is sagging:

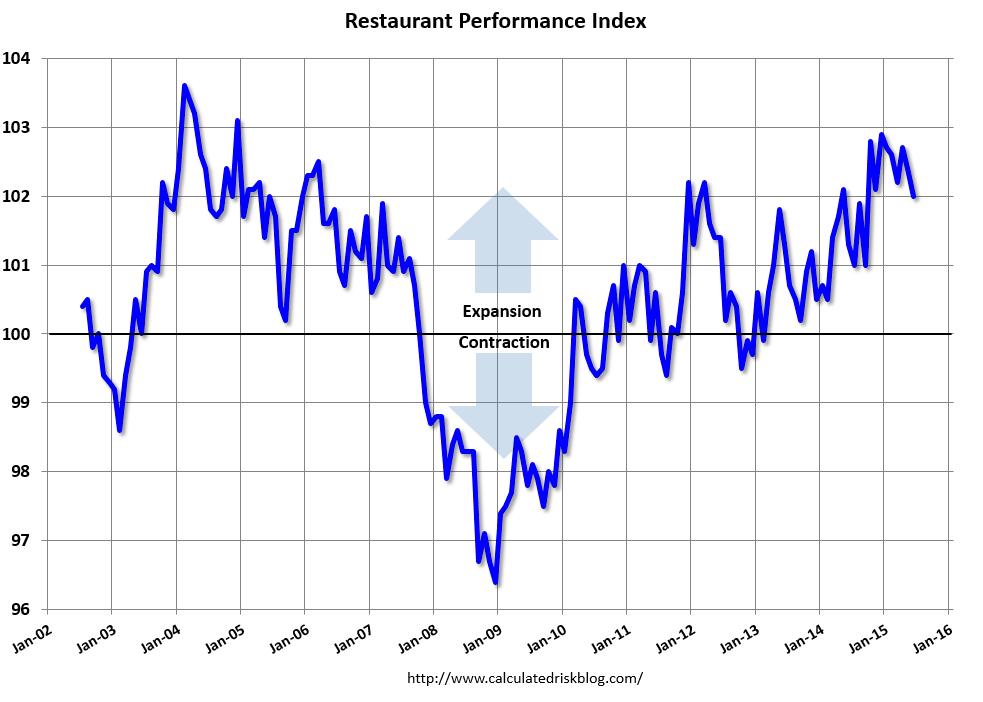
Restaurant Performance Index declined in June

By Bill McBride

July 31 (Calculated Risk Blog)

Here is a minor indicator I follow from the National Restaurant Association: Dampened Outlook Causes Restaurant Performance Index Decline in June

As a result of a somewhat dampened outlook among restaurant operators, the National Restaurant Association’s Restaurant Performance Index (RPI) declined in June for the second consecutive month. The RPI – a monthly composite index that tracks the health of and outlook for the U.S. restaurant industry – stood at 102.0 in June, down 0.4 percent from May and its lowest level in nine months. Despite the decline, June represented the 28th consecutive month in which the RPI stood above 100, which signifies continued expansion in the index of key industry indicators.

“Although same-store sales and customer traffic levels remained positive in June, the overall RPI declined as a result of dampened optimism among restaurant operators,” said Hudson Riehle, Senior Vice President of the Research and Knowledge Group for the Association. “The proportion of restaurant operators expecting sales growth fell to its lowest level in nine months, while operators’ outlook for the economy turned negative for the first time in nearly two years.”

er-8-2-2

The index decreased to 102.0 in June, down from 102.4 in May. (above 100 indicates expansion).

Restaurant spending is discretionary, so even though this is “D-list” data, I like to check it every month. Even with the decline in the index, this is a solid reading.

Read more at Calculated Risk Blog

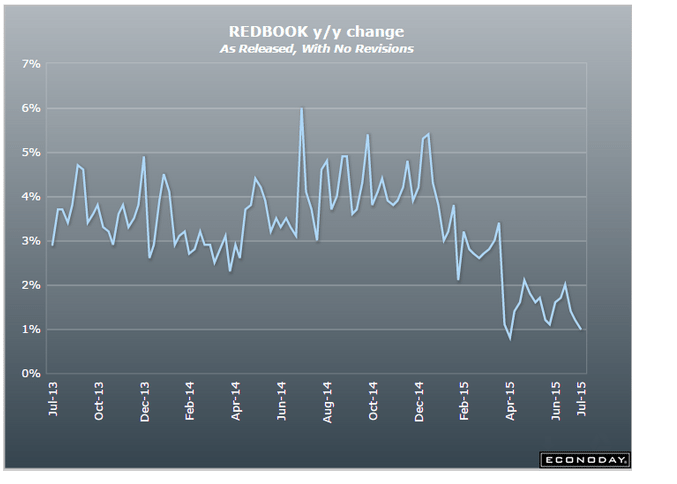
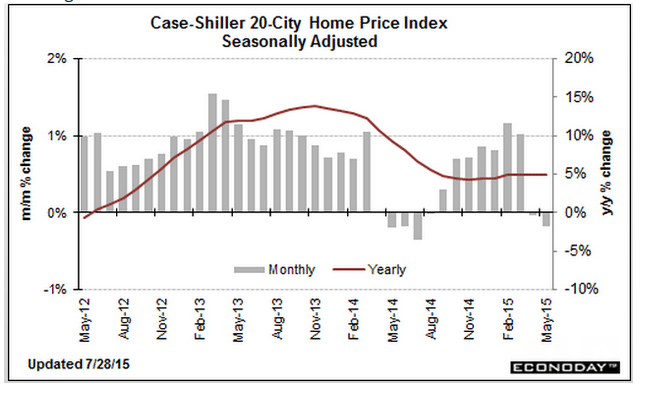
Redbook Retail Sales, Case-Shiller House Prices, PMI Services, Consumer Confidence, Richmond Fed, Oil Capex, Truck Tonnage

Still bad:

source: Econoday.com
er-7-28-1

Softening:

source: Econoday.com
er-7-28-2

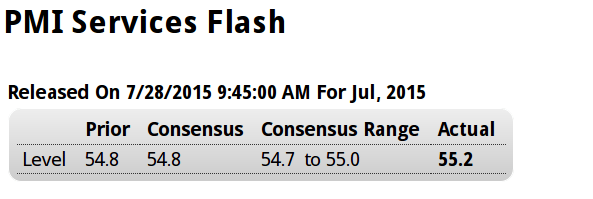
I don’t put much weight on Markit surveys, but the optimism comment is interesting:


source: Econoday.com
er-7-28-3

Highlights

Service sector growth is strengthening slightly this month based on Markit’s July flash index which is up 4 tenths to a very solid 55.2. New orders are at a 3-month high and are getting a boost from both consumer spending and from business customers, the latter a welcome signal of strength for business investment. Backlogs are up and so is hiring. But optimism in the 12-month outlook, perhaps shaken by the outlook for the global economy, is the softest it’s been in three years. Input prices continue to rise but final prices are flat. This report is mostly upbeat and, despite the easing in the outlook, points to solid contribution from the service sector.

This kind of drop is concerning, and I’ve been watching for employment, a lagging indicator, to take a dive:

source: Econoday.com
er-7-28-4

Highlights

Consumer confidence has weakened substantially this month, to 90.9 which is more than 6 points below Econoday’s low estimate. Weakness is centered in the expectations component which is down nearly 13 points to 79.9 and reflects sudden pessimism in the jobs outlook where an unusually large percentage, at 20 percent even, see fewer jobs opening up six months from now.

Less severe is weakness in the present situation component which is down nearly 3 points to 107.4. Here, slightly more, at 26.7 percent, say jobs are hard to get but this is still low for this reading.

A striking negative in the report is a drop in buying plans for autos which confirms weakness elsewhere in the report. Inflation expectations are steady at 5.1 percent which is soft for this reading.

This report is citing problems in Greece and China as possible factors for the decline in expectations, but US consumers are typically insulated from international events. The decline in expectations, mirrored earlier this morning by a similar decline in the service-sector outlook, may be sending early hints of second-half slowing, slowing that could push back of course the Fed’s expected rate hike.

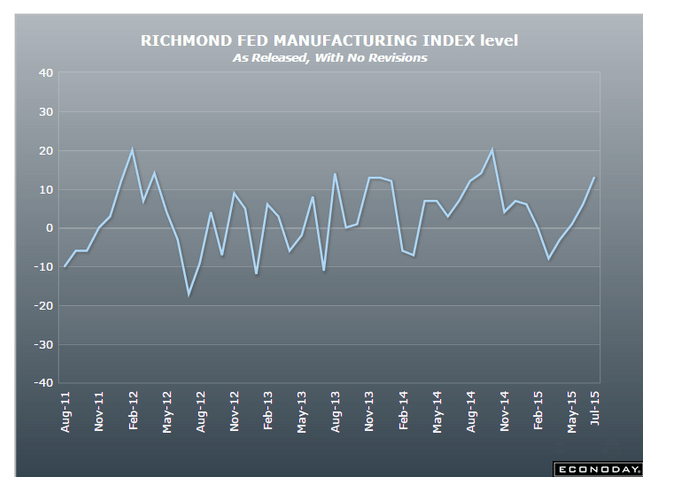
A bit better, but another reference to softening employment. And note the volatility of this series, with moves up often followed quickly with moves down:

source: Econoday.com
er-7-28-5

Highlights

The Richmond Fed is reporting the best strength of any manufacturing region this month, at 13 which is above the Econoday top-end estimate. New orders are especially strong, up 7 points to 17, with backlog orders also rising, up 7 points to 10. Shipments are strong, capacity utilization is up and inventories, because of the activity, are being drawn down. Hiring, however, is slowing. Price data show slight pressure for inputs but no pressure for finished goods.

This report contrasts with much slower rates of growth in the New York and Philadelphia Fed regions and sharply contrasts with recent data from the Dallas and Kansas City Feds where manufacturing, due to the energy sector, is in deep contraction. But today’s result is a welcome positive, suggesting that manufacturing may yet pick up this year and a reminder of strength in yesterday’s durable goods report.

er-7-28-6


This had been estimated at $100 billion:

source: Financial Times
er-7-28-7

Housing Starts, Consumer Sentiment

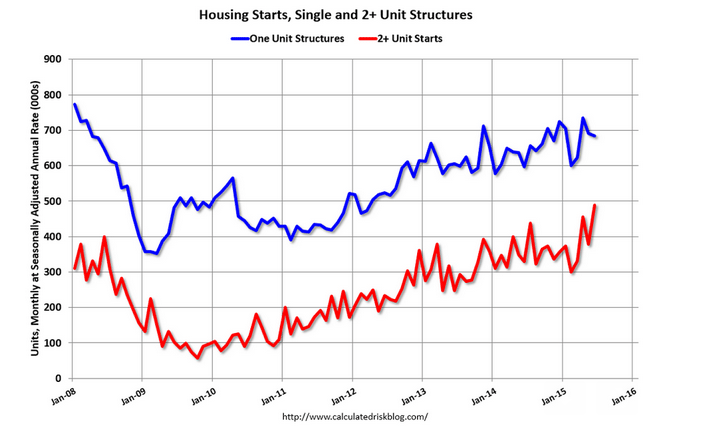
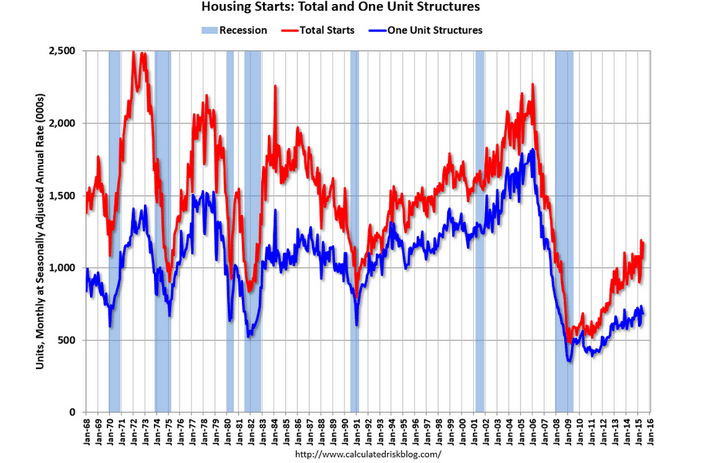
The increase is entirely a multi family story, and multi family dwellings are cheaper/smaller than single family:


er 7-17-1

Highlights

Strong demand for apartment units drove housing starts & permits data far beyond expectations, overshadowing less strength for the key single-family home category. Starts came in near the top of expectations, up 9.8 percent in June at a 1.174 million annual rate, but reflect a 29.4 percent surge in the multi-family component. The single-family component actually fell 0.9 percent. The same pattern appears for permits which jumped 7.4 percent overall to a much higher-than-expected 1.343 million rate but here too multi-family units rose 15.3 percent with single-family up far less but at a still very strong 0.9 percent.

Regional data, where the separation between single-family homes and multi-family units is not broken out, show special strength for the South which is by far the largest region for housing. Starts in the South rose 13.5 percent in June with permits up 10.4 percent. Permits in the West are also strong, up 9.5 percent, though starts in the region fell 6.0 percent. Also of note is an outsized 35.5 percent surge in Northeast starts.

The unusual rise for multi-family units reflects high levels of rent, evident in today’s CPI report. The single-family component is less strong though the 0.9 percent rise in permits does point to strong second-half activity for the new home sector. This report is very solid but just not as spectacular as the headlines suggest.

er 7-17-2

er 7-17-3

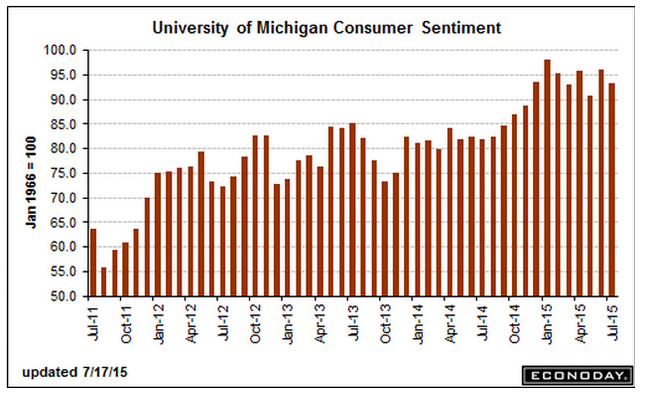
Negative surprise here:


er 7-17-4

Highlights

Consumer sentiment is softening this month, to 93.3 in the mid-month July reading which is below Econoday’s low estimate for 94.5. The current conditions component is down nearly 3 points to 106.0 in an early reading for July that points to another month of weakness for consumer activity. The expectations component fell a bit less to 85.2 which is still very respectable for this reading and points to confidence in the jobs outlook.

Inflation data, as Federal Reserve policy makers have been predicting, are inching higher with 1-year expectations at 2.8 percent and 5-year expectations at 2.7 percent, both up 1 tenth in the month.

Consumer sentiment has been running very strong most of this year and often well ahead of consumer spending readings which have been flat. But today’s report suggests that the best for confidence may already have passed.

er 7-17-5

Fed labor market index, ISM non manufacturing index, Bank lending, Greece

Prior month revised lower and this month lower
so Fed that much less likely to raise rates:

Labor Market Conditions Index
er-7-6-1
Highlights
Growth in the nation’s labor market remains subdued with the labor market conditions index at plus 0.8 in June vs a revised plus 0.9 in May. The reading is barely over zero and underscores last week’s soft employment report. The Fed won’t be any hurry to begin raising its overnight policy rate based on June’s employment data.

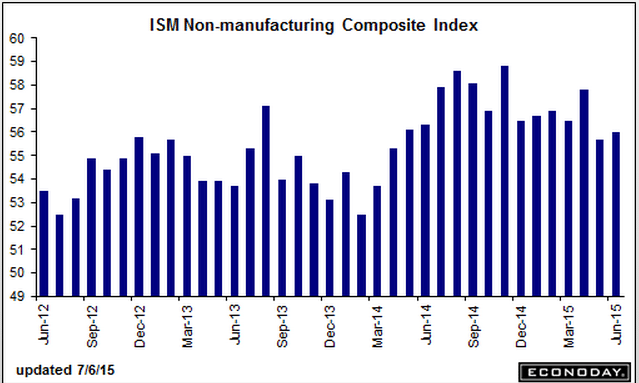
Ok, number but less than Q1, with export orders and employment growth slowing:

ISM Non-Mfg Index
er-7-6-2
Highlights
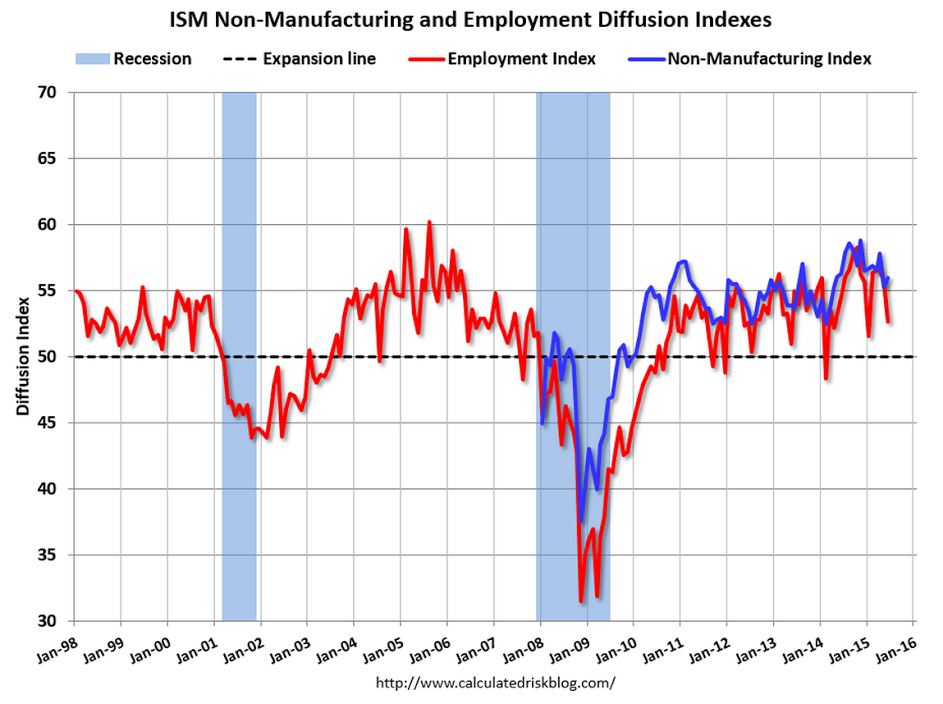
Rates of growth in ISM’s non-manufacturing report held steady and solid in June, at a composite index of 56.0 for a 3 tenths gain from May. New orders are strong, at 58.3 for a 4 tenths gain with backlogs back over 50 at 50.5 for a 2 point gain. Growth in export orders slowed but still held over 50 at 52.0 in a reminder that services exports, unlike goods exports, are in surplus.

Other readings include a strong reading for business activity, up 2.0 points to 61.5, a gain offset by slowing in employment to 52.7 from a strong four-month streak over the 55 level. The report’s price reading slowed slightly to 53.0, a soft level contrasting with inflationary signals in this morning’s PMI service report.

A strong signal in this report is wide breadth among 18 industries with 15 showing growth with two of the exceptions, however, including mining and construction. Contraction in the latter is a surprise given wide indications of growth in housing.

This report is solid but, together with the PMI services index, point to a lack of acceleration for the end of the second quarter.
er-7-6-3
er-7-6-4

To my point right after oil prices fell- banks will see large declines in the value of collateral backing their loans which could lead to capital write downs and institution specific lending restrictions, further dampening sales, output, and employment:

Banks Face Curbs on Oil, Gas Lending

By Gillian Tan, Ryan Tracy and Ryan Dezember

July 3 (WSJ) — U.S. regulators are sounding the alarm about banks’ exposure to oil-and-gas producers, a move that could limit their ability to lend to companies battered by a yearlong slump in prices.


The Federal Reserve, Office of the Comptroller of the Currency and Federal Deposit Insurance Corp. are telling banks that a large number of loans they have issued to these companies are substandard, said people familiar with the matter, as they issue preliminary results of a joint national examination of major loan portfolios.

The substandard designation indicates regulators doubt a borrower’s ability to repay or question the value of the assets that back a loan. The designation typically limits banks’ ability to extend additional credit to the borrowers.


The move could add an extra obstacle to companies struggling with high debt loads amid lower prices for the oil and natural gas they produce. Banks have been flexible with troubled energy companies to avoid triggering a flood of defaults and bankruptcy filings, but regulatory pressure could force them to tighten the purse strings.


This year’s Shared National Credit review process contrasts with those in prior years, when regulators didn’t broadly disagree with the banks’ own ratings of credit facilities known as reserve-based loans, the people said. But regulators are paying closer attention to these loans amid worries that a sustained slump in energy prices could lead to big losses for banks, they added.

Twice a year, banks themselves review the value of oil and gas deposits that companies have the right to extract and use as collateral for bank loans. Declines in commodity prices can prompt lenders to reduce their commitments to companies. The effects of such reductions can cascade through energy companies’ capital structures and require them to look elsewhere for funds.

Earlier this year, a number of energy producers sold bonds, took out term loans or sold new shares to replace shrinking reserve-based loans. While some of those moves were forced, others were pre-emptive.

Large energy lenders include Wells Fargo & Co., J.P. Morgan Chase & Co. and Bank of America Corp.

Regulators declined to discuss their conversations with specific banks but have been raising concerns about energy loans. On Tuesday, the OCC, in a semiannual report on emerging risks, said it is monitoring oil-and-gas production loans and said the “significant decline in oil prices in 2014 could put pressure on loan portfolios.” The report didn’t detail the examination of reserve-based loans.

The latest effort comes amid a broader crackdown on lending that regulators consider risky. In 2013, the Fed, OCC and FDIC issued guidance to deter banks from issuing leveraged loans that would increase the companies’ debt loads to levels they consider too high.

Bankers said they are concerned that this latest effort could push some struggling borrowers over the edge, which could, in turn, create more pain for the banks.

“They’re taking a broad brush to the entire sector and not really differentiating between secured and unsecured loans,” one senior leveraged-finance banker said of regulators’ treatment of reserve-based loans.

A number of energy companies already have filed for bankruptcy protection, and others are exploring options to raise capital or restructure their debt loads.

So far, the suffering hasn’t been as widespread as was initially feared when prices plummeted last year.

Bankers are selectively appealing some substandard ratings, especially for companies that can reduce spending and pay down some debt, said people familiar with the matter.


But for the companies that retain the negative rating, any issuance of new debt will likely need to reflect an improvement in creditworthiness, the people said. Options include the addition of loan terms known as covenants, which protect lenders but can increase a company’s risk of default.


Banks may turn to equity or bonds to supply additional financing to borrowers with the substandard designation, some of the people said, though both are costlier for companies than loans.

Analysts expect the oil slump to begin taking a greater toll on companies this fall, when banks review their reserve-based loans. In a note to clients this week, Wells Fargo Securities analysts said that only 30% of the expected oil output in 2016 from the companies they track has been presold at above-market prices, versus 56% of crude production that was hedged this year.


The analysts also said the prolonged period of lower revenue could push more companies closer to violating agreements with creditors to maintain certain profitability levels, and that they expect stock investors to be “more discerning” when offered new shares from heavily indebted companies.

The ECB has begun the move to remove the eligibility of Greek debt as collateral for ECB loans:

ECB maintains emergency assistance for Greek banks, but adjusts haircut on collateral

By Everett Rosenfeld and Matt Clinch

Now that the EU realizes it doesn’t need Greece, the terms are unlikely to be altered. With Greek leadership still committed to staying with the euro and the EU, they take on the role of beggars.

“Even if it came to a collapse of some individual banks, the risk of contagion is relatively small,” Schaeuble told Bild. “The markets have reacted with restraint in the last few days. That shows that the problem is manageable.”

Greek Leaders Says Goal Is to Secure Country’s Financing

By By Eleni Chrepa and Constantine Courcoulas

July 5 (Bloomberg) — Greek party leaders seek solution that secures country’s financing needs, reforms, growth plan and talks on Greek debt sustainability, according to joint statement sent by the Greek president’s office.
Immediate priority is to restore liquidity for Greek economy in cooperation with the ECB
Joint statement signed by Greek PM Alexis Tsipras, acting New Democracy leader Evangelos Meimarakis, Potami party leader Stavros Theodorakis and Pasok party leader Fofi Gennimata
NOTE: Earlier, Greek Showdown Looms With Europe Demanding Tsipras Make Move Link


*GREEK LEADERS: REFERENDUM GIVES NO MANDATE FOR RUPTURE

The call for humanitarian aide puts Greece in a category with other depressed nations seeing that kind of assistance, as Greece turns into a footnote:

European Parliament president: Need to urgently discuss humanitarian aid for Greece

July 5 (CNBC) — European institutions need to urgently discuss a humanitarian aid program for Greece, the …

Greece loses the gambit

It now looks to me like Greece has lost the wrestling match.
gw

The other EU members are very sensitive to market reactions.

The question was whether the EU economy needed Greece, and the answer is now looking more and more like ‘no’.

Not a good position for Greece to find itself after posturing as if it is needed.

That is, Greece forced a test of that question and appears to have the leverage the possibility that they were needed gave them.

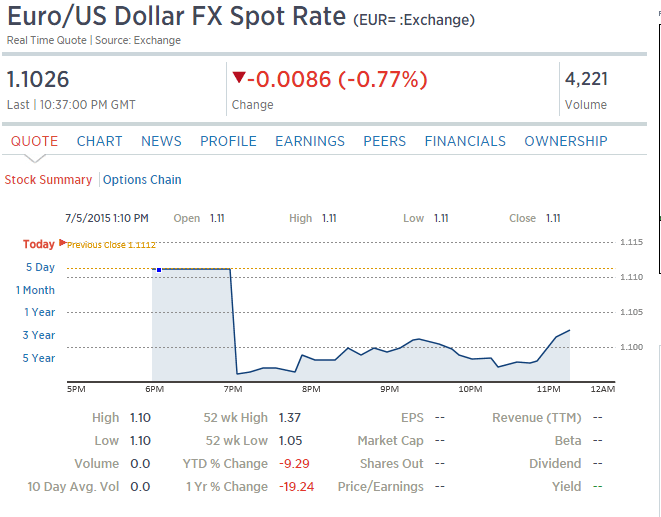
The euro did fall, which was extremely worrisome even though it did help exports. There is always the fear, particularly in Germany, of a currency collapse that brings inflation with it. At least so far, that hasn’t happened, with the euro holding about 5% above the lows and recovering from the initial knee jerk reaction from today’s referendum.
eur-usd-2
Real GDP forecasts remain positive, helped quite bit by the lower euro, and while high, unemployment has stabilized.

The camp claiming that Greece has been dragging down the entire EU economy is getting more support from the same data.

And so now while Greece isn’t being formally ousted, it will see it’s economy continue to deteriorate if it doesn’t agree to troika terms and return to ‘normal funding’ via securities sales at low rates under the ECB’s ‘do what it takes’ umbrella, and rejoin the rest of the members.

If the govt starts paying in IOU’s payments get made for a while, however they will be discounted ever more heavily with time, raising the cost of re entry to ‘normal’ funding, and the EU counts those as additions to deficit spending which could cause the terms of re entry to be that much steeper.

And any movement by Greece to use alternative funding will be taken as reason not to return Greece to ‘normal’ funding under the ECB umbrella.

NFIB employment, BOJ solvency, Non Farm Payrolls, Claims, Factory Orders

The cheer leaders didn’t bother to report on this they way they did when employment was increasing:

U.S. small business hiring takes a breather in June: NFIB

July 1 (Reuters) — The National Federation of Independent Business said its monthly survey of members found hiring was little changed last month. Fifty-two percent of small business owners reported hiring or trying to hire, with 44 percent of those reporting few or no qualified applicants for the positions they were trying to fill. Twenty-four percent reported job openings they could not fill, down from 29 percent in May, the NFIB said. The share of business owners looking to increase employment dropped six points, to 16 percent, while those planning reductions was up two points, at 6 percent.

Too stupid an article for me to pass up:

Is quantitative easing putting the Bank of Japan’s solvency at risk?

July 2 (Nikkei) — The BOJ’s holdings of long-term Japanese government bonds rose by 80 trillion yen a year, and its total assets expanded to 324 trillion yen at the end of fiscal 2014. The bank’s return on assets, that is, net profit divided by total assets, stood at 0.31%. If the interest rate goes up by 1 percentage point the bank’s unrealized losses are estimated to jump from 3.3 trillion yen at the end of March 2013 to 13.8 trillion yen at the end of March 2015. With the BOJ’s assets now equal to 64.7% of Japan’s GDP the credibility of the central bank is tied to the Japanese government’s fiscal discipline.

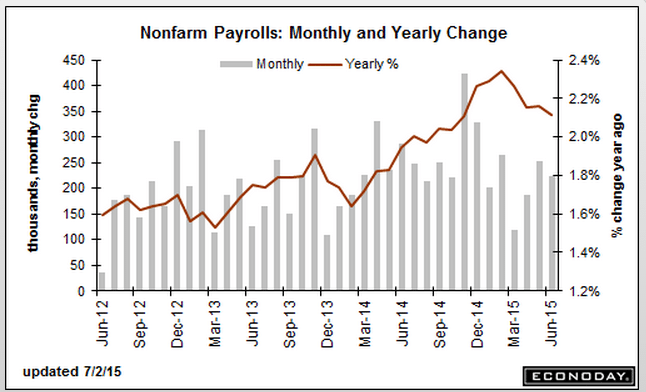
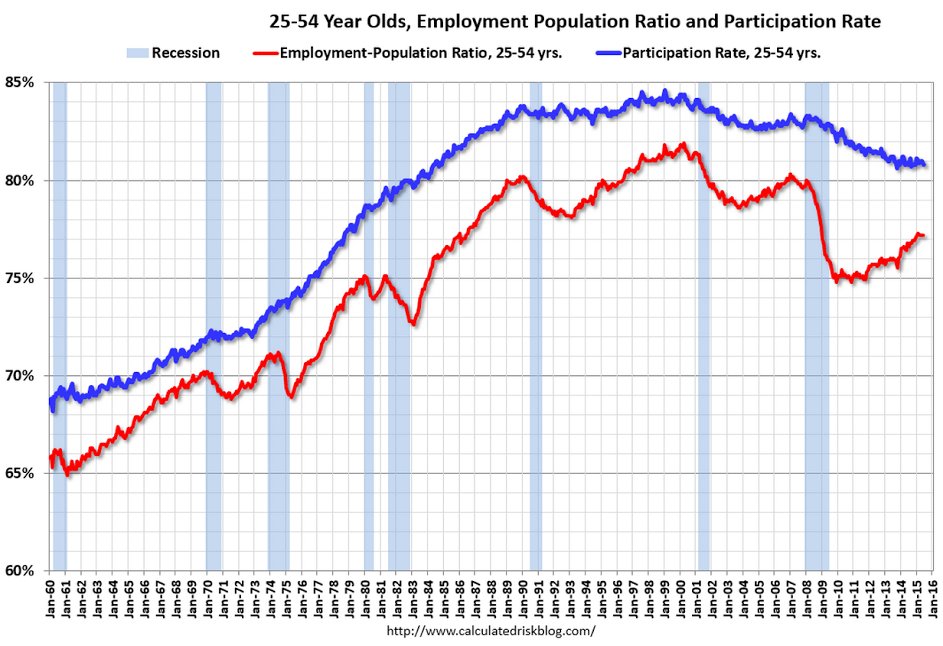
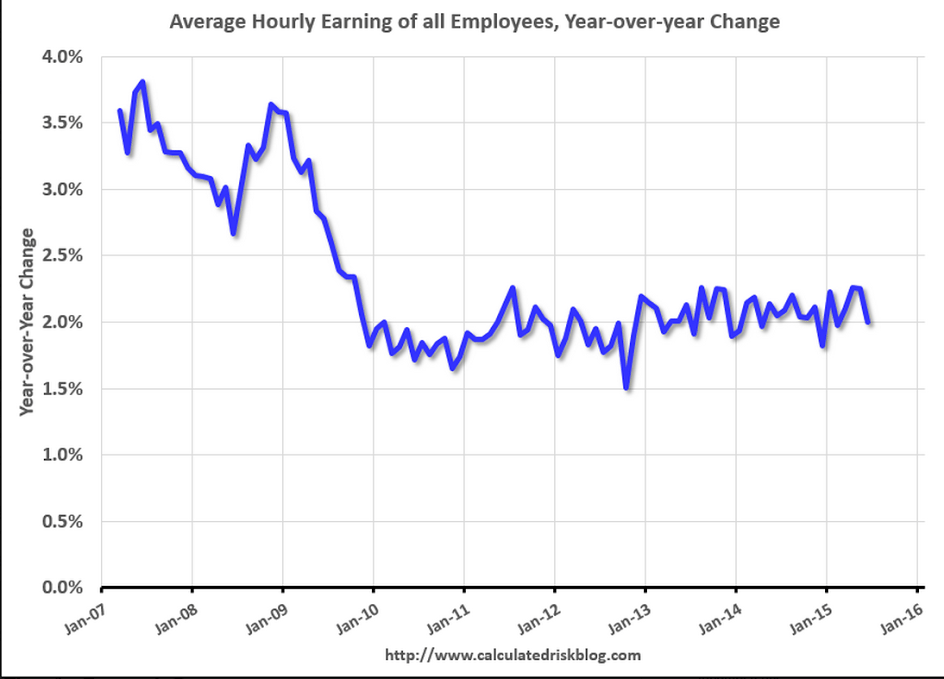
Not good, remember how they cheered the 280,000 new jobs in May, and downplayed the rise in unemployment and the increase in the participation rate? Now May is down to 254,000 and the participation rate fell way back, so they are playing up the drop in unemployment. And note the lack of comments over the deceleration of the year over year growth of employment since oil prices fell. And watch how they cling to their ‘wage inflation’ story even as growth rates again fall back:

NFP
er-7-2-1
Highlights
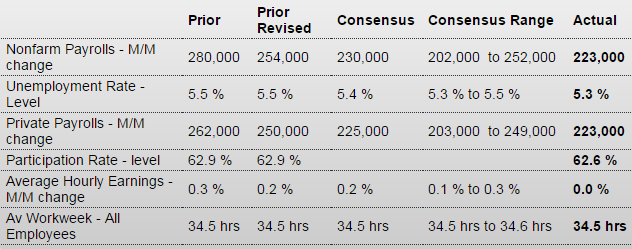
Push back that rate hike, at least that will be the initial reaction to June’s softer-than-expected employment report where nonfarm payroll growth came in at 223,000 vs Econoday expectations for 230,000 and include downward revisions totaling 60,000 to the two prior months (May revised to 254,000 from 280,000 and April to 187,000 from 221,000). Softness in payroll growth combines with softness in wage pressures with average hourly earnings unchanged in the month and the year-on-year rate moving down to 2.0 percent from 2.3 percent.

Timing distortions tied to the end of the school year, specifically new entrants to the labor market, appear to have pulled down the unemployment rate to 5.3 percent from 5.5 percent as the labor force in the household part of the report shrunk sharply, in turn pulling down the labor force participation rate by 3 tenths to an unusually low 62.6 percent. The U-6 unemployment rate, a favorite of Fed Chair Janet Yellen’s, fell 3 tenths to 10.5 percent.

Turning back to the establishment part of the report, private payrolls rose 223,000 vs a revised 250,000 in May. The average workweek was unchanged at 34.5 hours. Industries of note include a solid 33,000 rise in retail jobs and a 64,000 rise in professional & business service jobs. The latter reading includes a solid 20,000 rise in temporary help that hints at gains for permanent hiring ahead. Manufacturing and construction jobs were flat.

Focusing on trends, nonfarm payroll growth averaged 221,000 in the second quarter vs 195,000 in the first quarter which, despite the disappointment in today’s report, is solid improvement. The employment side of the labor market isn’t gangbusters but it is moving in the right direction while the unemployment side is increasingly favorable. This is a mixed report with special factors and isn’t likely to shake up the markets.
er-7-2-2

No demographics here- just a big fat lack of aggregate demand:
er-7-2-3
They call every zig up the start of ‘wage inflation’ even as they are all followed by zigs down:
er-7-2-4
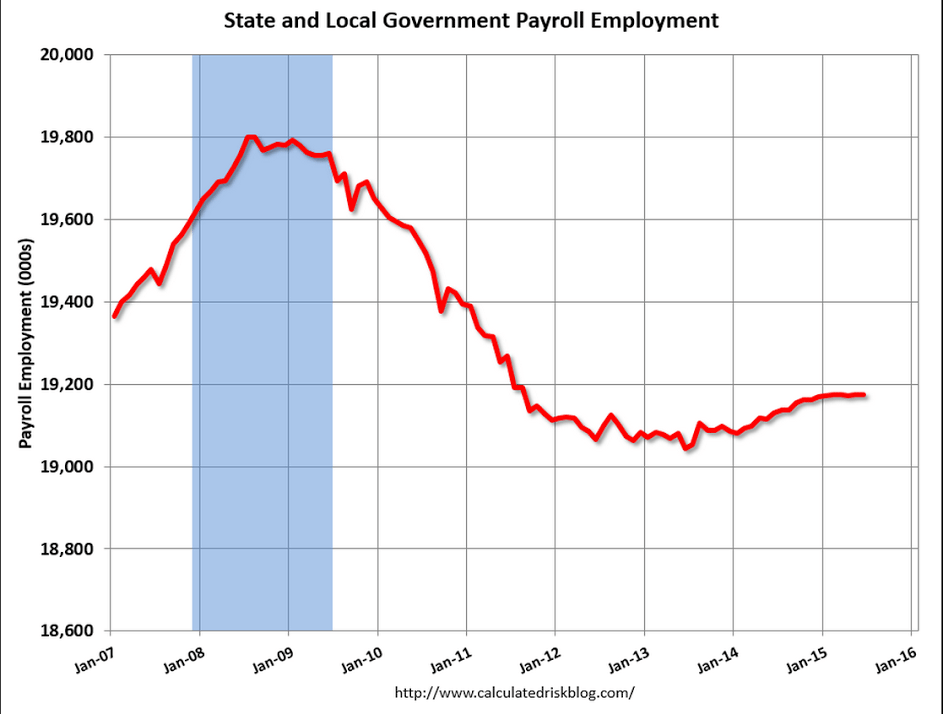
This too has leveled off after being touted for ‘lift off’ when it turned up a bit. And state and local deficits keep falling as tax revenues increase, which is an increase of fiscal drag:
er-7-2-5
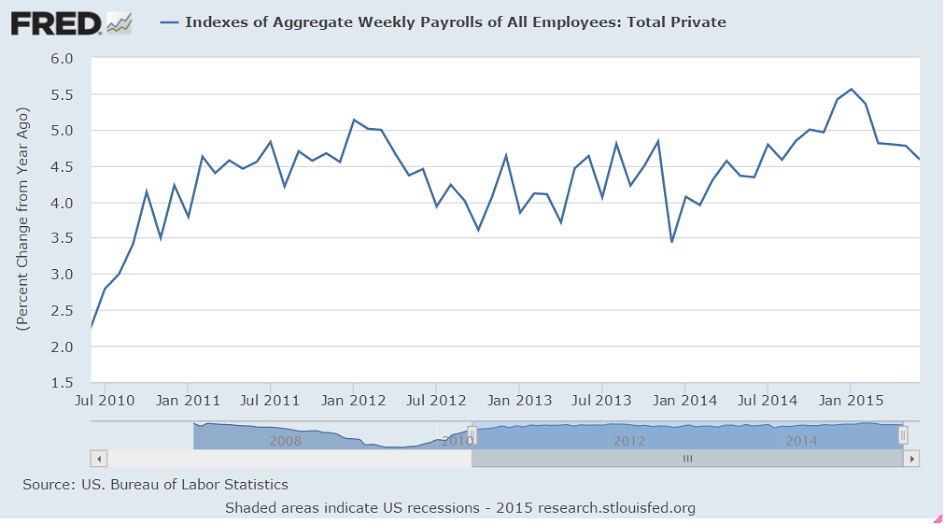
The rate of growth here had be on the rise but more recently has reversed:
er-7-2-6
er-7-2-7
Up a tad but still low historically:

United States : Jobless Claims
er-7-2-8
Highlights
Unemployment is very low right now, underscored by today’s 2 tenths drop in the unemployment rate to 5.3 percent and by the latest in jobless claims data where initial claims came in at 281,000 in the June 27 week. This is up 10,000 from the prior week but remains very low. The 4-week average inched 1,000 higher to a 274,750 level that is little changed from the month-ago comparison.

Continuing claims, where data lag by a week, rose 15,000 to 2.264 million in the June 20 week. The 4-week average is up 15,000 to 2.253 million. These readings, like those for initial claims, are also very low. The unemployment rate for insured workers is unchanged at 1.7 percent in another reading that is very low.

Another big negative ‘surprise’, and note the weak export comment, and how autos were weak despite higher May sales. Might be because of the high import content of those sales?

United States : Factory Orders
er-7-2-9
Highlights
The factory sector, hit by weak exports, continues to stumble with factory orders down 1.0 percent in May. This compares with Econoday expectations for minus 0.3 percent and is near the low-end estimate for minus 1.2 percent.

The durables component of the report, initially released last week, is now revised lower, to minus 2.2 percent from minus 1.8 percent. Durables in April have also been revised lower to minus 1.7 percent from minus 1.5 percent. The nondurables component, released with today’s report, helped limit the damage but not by much, up 0.2 percent on gains for petroleum and coal following a 0.3 percent gain for April.

But aircraft orders, always volatile, are to blame for much of the durables weakness, falling 49.4 percent in the month. Excluding transportation equipment, which is where aircraft orders are tracked, factory orders were unchanged in May which isn’t great but is much better than the minus 0.6 percent print for April.

Weakness in energy equipment is also a negative factor of the factory sector, down 22.2 percent in May following a 2.1 percent decline in April. Motor vehicle orders are also surprisingly weak, down 1.3 percent in May despite very strong sales. Orders for defense aircraft were also weak, down 6.4 percent.

Capital goods data had been showing some life but not much anymore with nondefense orders excluding aircraft down 0.4 percent following a 0.7 percent decline in April. These are especially disappointing readings. And core shipments of capital goods are dead flat, at minus 0.1 percent following only a 0.2 percent gain in April. These readings will likely pull down second-quarter GDP estimates.

Other disappointments include a steep 0.5 percent decline in total unfilled orders following April’s 0.2 percent decline. Declines in unfilled orders are not a good omen for employment. Total shipments fell 0.1 percent in the month. Inventories at least are stable, unchanged in the month as is the inventory-to-shipments ratio at 1.35.

First there was the unemployment report this morning and now this report, both of which may raise concern among the doves at the Fed that the second-quarter bounce back is not much of a bounce back at all.
er-7-2-10