Empire manufacturing, housing market index, EU merchandise trade

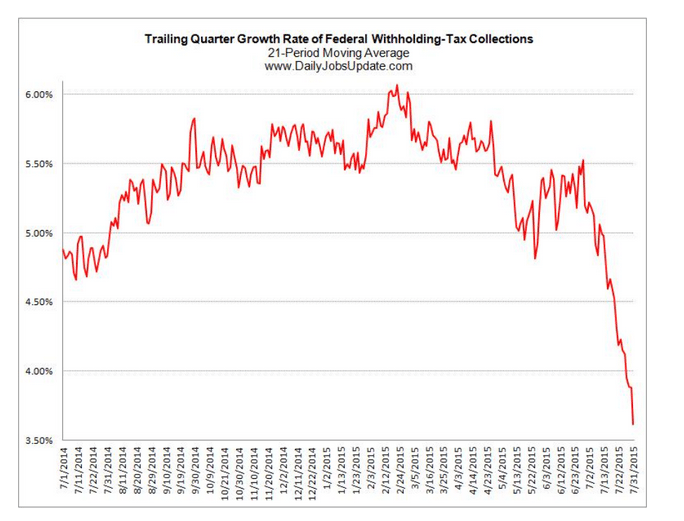
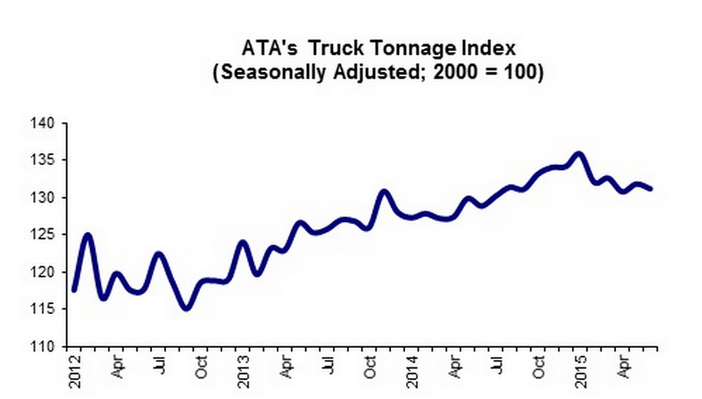
The lack of support from the lost oil capex continues to ripple out:

United States : Empire State Mfg Survey
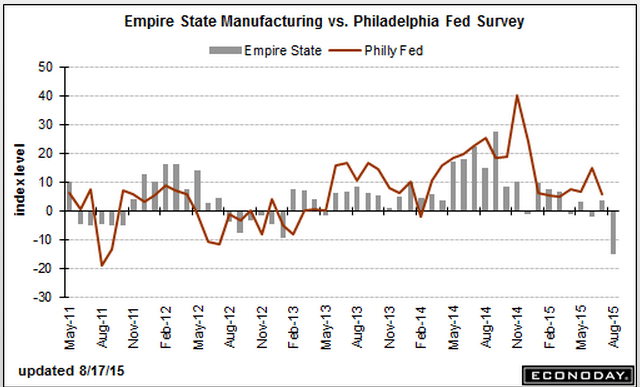
er-8-17-1
Highlights
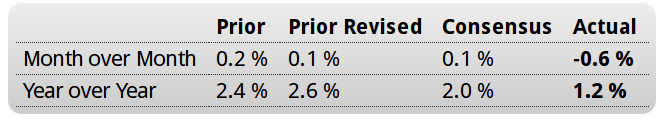
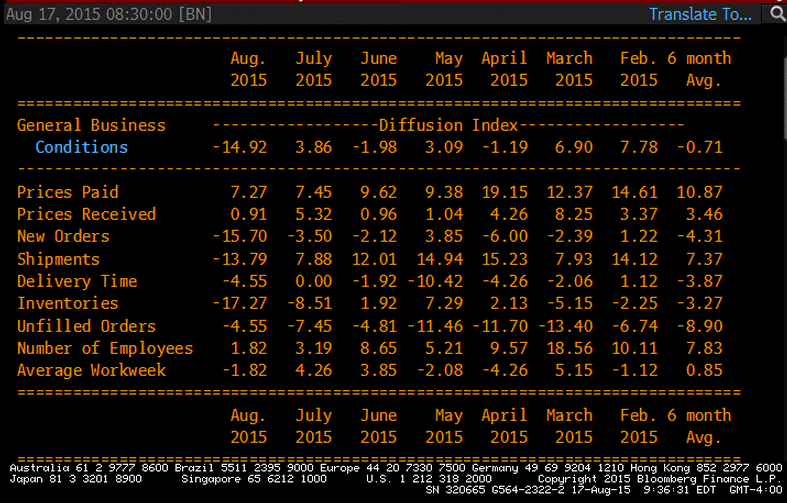
Out of the blue, the Empire State index has plunged deeply into negative column this month, to minus 14.92 in August vs plus 3.86 in July. This is by far the weakest reading of the recovery, since April 2009. New orders, which had already been weak in this report, fell from July’s minus 3.50 to minus 15.70 for the weakest reading since November 2010. Backlog orders, which had also been weak, came in at minus 4.55 from minus 7.45. Shipments, in the weakest reading since March 2009, fell to minus 13.79 from positive 7.99.

Last week’s industrial production report, boosted by the auto sector, offered hope but today’s report is a reminder that weak exports and weakness in the energy sector are stubborn negatives for the factory sector. Today’s results scramble the outlook for Thursday’s Philly Fed report which was expected to show moderate strength.
er-8-17-2
er-8-17-3

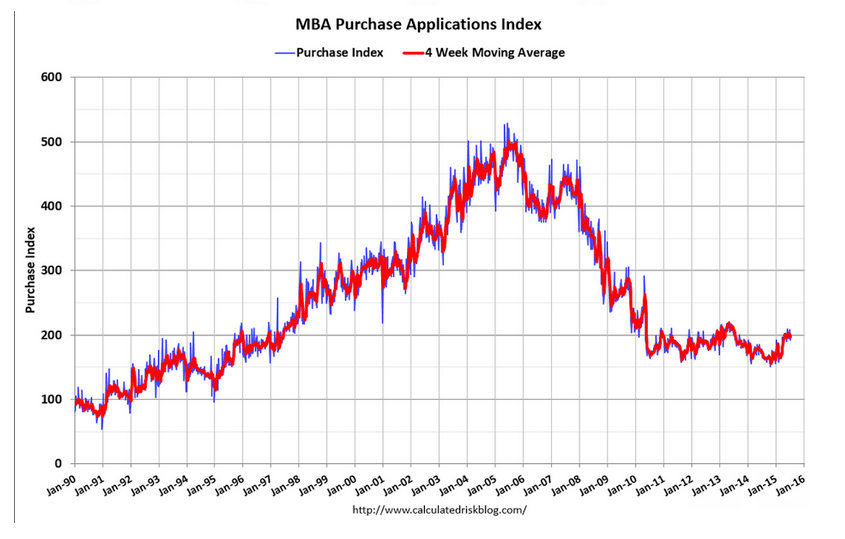
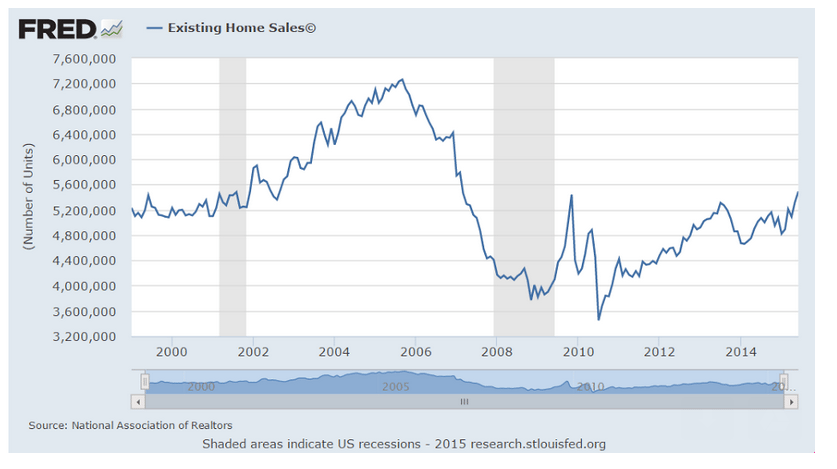
Home builders remain optimistic:

United States : Housing Market Index
er-8-17-4
Highlights
The new home sector is increasingly a central source of strength for the economy and builders are increasingly optimistic. The housing market index rose 1 point to a very strong 61 in August with the future sales component leading the way at 70. Current sales are at 66 with traffic continuing to lag but less so, at 45 for a 2 point gain in the month. By region, the South and West show the greatest composite strength at 63 each followed by the Midwest at 58 and the Northeast, which is the smallest region for new homes, still showing contraction at a sub-50 reading of 46.

Strength in the labor market is the driving force behind strength for new homes where lack of supply continues to motivate builders. Today’s report points to another strong housing starts report for tomorrow.

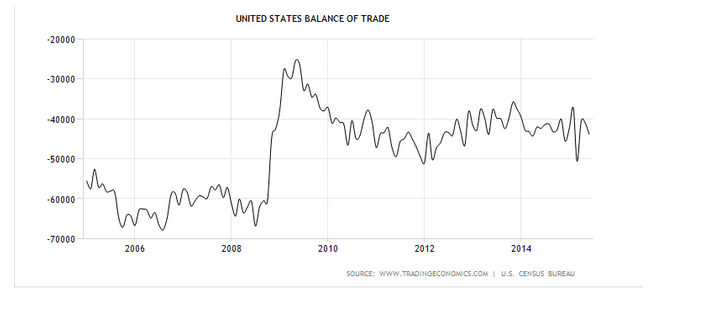
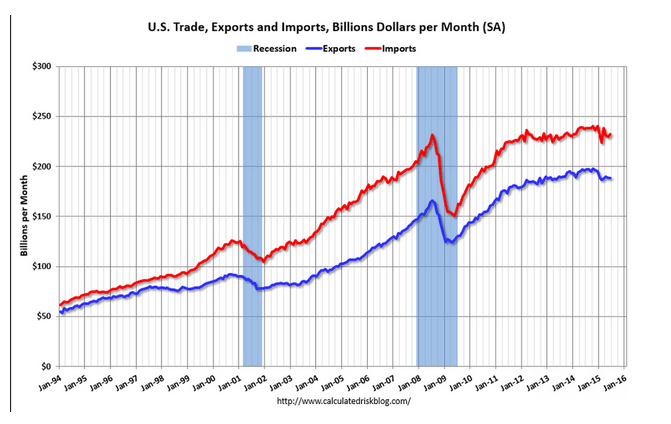
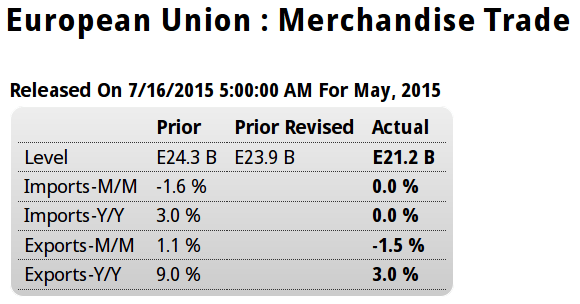
Never yet seen a positive trade balance and a weak currency, without an inflation problem. The euro is down only because of portfolio shifting, particularly CB’s, which may have run its course, and the general outlook remains deflationary. While this includes the (minority) non euro members, the trend is the same for just the ‘euro area’ which is also reported separately:

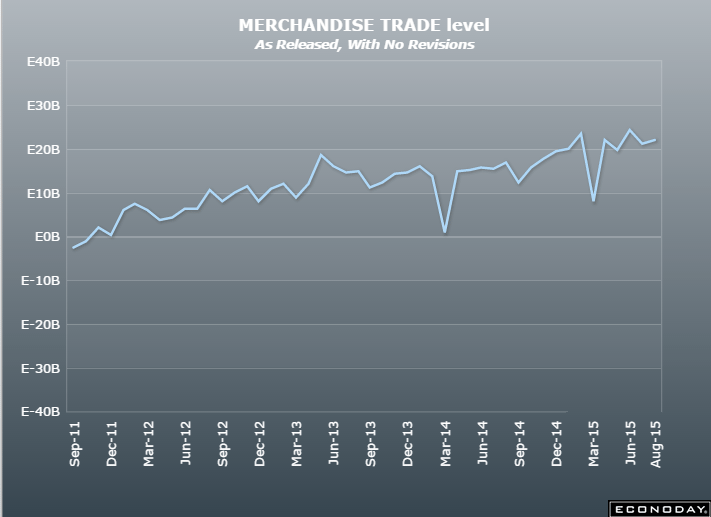
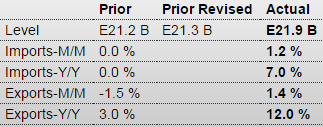
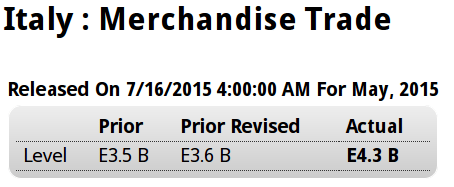
European Union : Merchandise Trade
er-8-17-5
Highlights
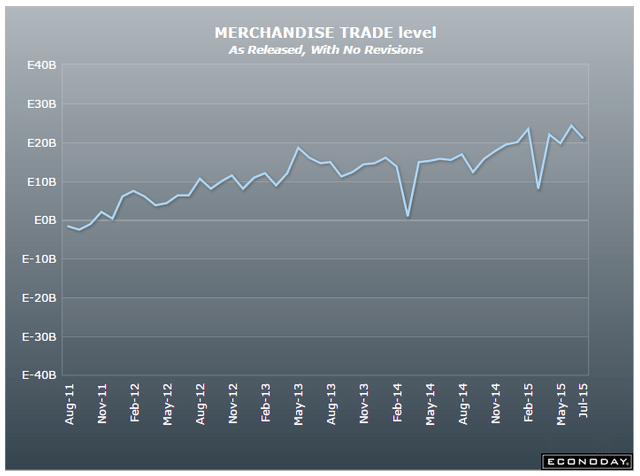
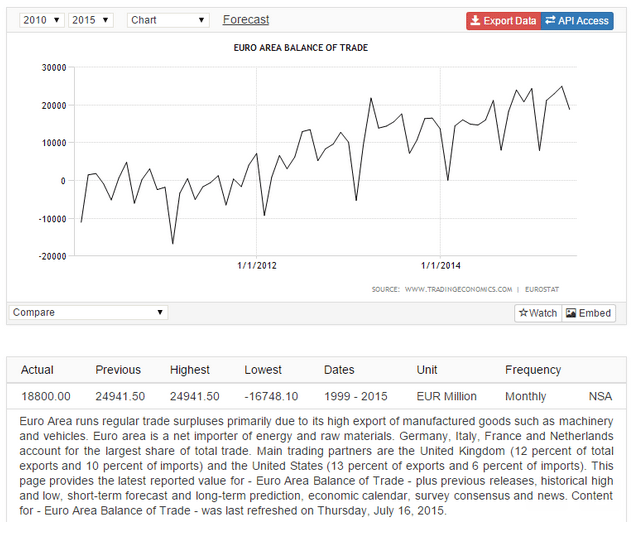
The seasonally adjusted trade balance was E21.9 billion, up from a revised E21.3 billion in May. Exports of goods to the rest of the world were €182.7 billion, an increase of 12 percent from a year ago. Imports from the rest of the world were E156.4 billion, 7 percent higher from a year ago. Intra-euro area trade rose to E151.2 billion in June 2015, up 10 percent compared with June 2014.

For the six months to June 2015, euro area exports of goods to the rest of the world rose 6 percent compared with January to June 2014), while imports were up 3 percent compared with the year earlier period.

Apart from the weakness of the oil market, the current soft level of the euro should help to ensure continued strong trade data over the rest of 2015.
er-8-17-6

Retail Sales, Jobless Claims, Import Export Prices, Business Inventories, Japan Machine Orders, Freight Transportation, Gas Prices


This is being touted as a strong report, but, again, looks to me like it’s dropped since year end and at best is moving sideways from there, and not to forget that a large share of auto sales are imports.

But I do agree the Fed is heck bent on raising rates in Sept, even without ‘some’ improvement, and will do so unless there’s a stock market decline severe enough to hold them back. So far that’s not happening.

Retail Sales
er-8-13-1

Highlights
Big upward revisions underscore a very solid and very important retail sales report. Retail sales rose 0.6 percent in July with June revised to unchanged from an initial reading of minus 0.3 percent and with May revised to a jump of 1.2 percent from 1.0 percent. The revisions to June and May point to an upward revision for second-quarter GDP.

Vehicle sales, as expected, were the standout in July, jumping 1.4 percent to nearly reverse June’s 1.5 percent slide and nearly matching May’s historic 1.9 percent surge. But even outside vehicles, retail sales were strong with the ex-auto reading rising a solid 0.4 percent. Restaurants, in another strong signal of consumer strength, rose an outsized 0.7 percent following June’s 0.5 percent gain. These are very strong gains for this component. Excluding both vehicles and gasoline, retail sales rose 0.4 percent, again another solid reading.

Strength in both vehicles and restaurants point to the health of the US consumer and will likely give the hawks the courage, despite all the troubles in China, to push for a rate increase at the September FOMC.

er-8-13-4

er-8-13-5

er-8-13-6

er-8-13-7

er-8-13-8

er-8-13-9

Tough times for department store sales continue, which explains some of the weakness in construction:

er-8-13-10

‘Some’ deterioration:

Jobless Claims
er-8-13-11

‘Some’ deterioration for Fed hopes of higher inflation. It’s been failing to hit its target for longer than I can remember…

er-8-13-12


Excess inventory building in June helps Q2 GDP but the likely subsequent production cuts will hurt Q3. The now persistently too high inventory to sales ratio is overdue for a correction:

United States : Business Inventories
er-8-13-13

Highlights
Inventories rose relative to sales in June but the news isn’t that bad given that the build was centered in autos. Business inventories rose 0.8 percent in June which was well ahead of a 0.2 percent rise in sales. The mismatch lifts the inventory-to-sales ratio to 1.37 from 1.36.

But retail inventories at auto dealers were to blame, up 1.4 percent in June and contributing to a 0.7 percent rise for the retail component. Inventories at manufacturers and wholesalers, the two other components of the business inventory report, also rose, up 0.6 and 0.9 percent respectively.

Inventories are on the heavy side but the concentration in autos is welcome given how strong sales are, evidenced by the 1.4 percent surge for the motor vehicle component of the July retail sales report released earlier this morning. Note that this report, along with the retail sales report, are likely to lift revision estimates for second-quarter GDP.

er-8-13-14

Global weakness continues:

Japan : Machine Orders
er-8-13-15

Highlights
June seasonally adjusted machine orders (excluding volatile items) declined for the first time since February. They dropped a larger than anticipated 7.9 percent on the month and were up 14.7 percent on the year. Core orders were up 16.6 percent based on the original series. This was in contrast to expectations of a 17.5 percent increase.

Core machine orders are considered a proxy for private capital expenditures. The downward move followed a 0.6 percent gain a month before. The government repeated its assessment that machine orders would advance in the third quarter.

Nonmanufacturing orders excluding volatile items were up 5.0 percent while manufacturing orders dropped 14.0 percent. All orders including volatile items dropped 6.2 percent on the month. Manufacturing orders likely softened on continued weaker export demand while the sluggish domestic economy weighs on nonmanufacturers.”

Another weak looking index:

er-8-13-16


And I’d call this ‘some’ deterioration in the ‘labor market’. Looks like it was weakening before the 2014 oil capex boom supported it, and then has fallen off since the oil price collapse:

er-8-13-17


This is to the point I’ve been making that surveys are one man one vote, not one dollar one vote, so optimism remained high even as retail sales, for example, were fading. Yes, a lot more people saved $10 per week on gas but an equal amount of income was reduced for sellers of oil, including those earning royalties and holding leases, and investors of all sorts, and seems the spending cuts on domestic product by that group outweighed the additional spending from pump savings.

Fueled by low pump prices, U.S. motorists to drive more in August – survey

By Jarrett Renshaw

August 11 (Reuters)

U.S. motorists are paying an average of $2.58 per gallon, nearly a dollar less than a year ago, according to AAA, the nation’s largest motorist advocacy group. And a quarter of respondents expected prices to continue to decline, up from 10 percent a month ago.

The survey found that nearly 80 percent of people say gas prices influence how they feel about the economy. And with gas prices down nearly $1 from a year ago, U.S. motorists are feeling positive about the direction of the economy, the survey found.

“There is good news for retailers as consumer optimism picks up during peak vacation season,” said NACS Vice President of Strategic Industry Initiatives Jeff Lenard.

Jobs, Atlanta Fed, Rail Traffic

The Fed is looking for ‘some improvement’ in the jobs market. But looks like deterioration to me? The number of jobs fell for the second straight month, the year over year growth rate continued to fall, the unemployment rate and the participation rate were unchanged, earnings growth remains very low. All that went up was hours worked, by less than a tenth.

Employment Situation
er-8-8-1

Highlights
The numbers aren’t spectacular but they’re solid enough to keep a September rate hike in play. Non-farm payrolls rose just about as expected, up 215,000 in July with upward revisions adding 14,000 to the prior two months. The unemployment rate is unchanged at 5.3 percent. Wages show some traction, up 0.2 percent in the month with the year-on-year rate over 2 percent at 2.1 percent. The average workweek is up, rising to 34.6 hours from a long run at 34.5. The labor force participation rate, which dropped sharply in June, held at 62.6 percent.

Other details look surprisingly solid with payrolls rising 60,000 in trade & transportation, for a third straight strong gain, and professional & business services rising 40,000 to extend their long healthy run. Retailers continue to add jobs, up 36,000 for their third straight strong gain with the motor vehicle subset up 13,000 and reflecting the strength of car sales. Manufacturing, which is usually weak, rose a notable 15,000 in the month with construction, where lack of skilled labor is being reported, showing a modest gain of 6,000.

Another plus in the report is a decline in Janet Yellen’s favorite reading, the broadly defined U-6 unemployment rate which is down a notch to 10.4 percent. If the August employment report a month from now looks this good, a rate hike at the September FOMC will be a lock.

Improvement? Looks more like deterioration?

er-8-8-2

er-8-8-3

er-8-8-4

er-8-8-5

Slow start to Q3 here:

Latest forecast

August 6 (GDPNow)

The first GDPNow model forecast for real GDP growth (seasonally adjusted annual rate) in the third quarter of 2015 was 1.0 percent on August 6. The model projects that lower inventory investment will subtract 1.7 percentage points from third quarter real GDP growth. Real GDP grew 2.3 percent in the second quarter according to the advance estimate from the U.S. Bureau of Economic Analysis.
er-8-8-6

Rail Week Ending 01 August 2015: Traffic Down 1.8% in July

By Steven Hansen

August 7 (Econointersect)

Econintersect: Week 30 of 2015 shows same week total rail traffic (from same week one year ago) contracted according to the Association of American Railroads (AAR) traffic data. Intermodal traffic contracted year-over-year, which accounts for approximately half of movements. and weekly railcar counts continued in contraction.

Mortgage Purchase Apps, EU Retail Sales, Payroll Tax, ADP, Trade, Equity Comment

While still historically very low, purchase apps are now way up over last year’s particularly depressed levels. Some are replacing all cash buyers, but the increase is also in line with increased existing home sales.

While new home sales were soft, turnover of existing homes has been increasing, and while not directly increasing GDP, existing home sales are generally associated with purchases of furniture, appliances, and other home improvements, and of course real estate commissions.

MBA Mortgage Applications
er-8-5-1

Highlights
A drop in rates helped boost mortgage activity in the July 31 week both for home purchases, up 3.0 percent in the week, and for refinancing which rose 6.0 percent. The strength in purchase applications, which are up 23 percent vs this time last year, is a positive indication for home sales. The average 30-year fixed mortgage for conforming loans ($417,000 or less) fell 4 basis points in the week to 4.13 percent.

er-8-5-2

EU retail sales

European Union : Retail Sales
er-8-5-3

Highlights
Retail sales were surprisingly weak in June. A 0.6 percent monthly fall was the first decline since March and followed a slightly smaller revised 0.1 percent rise in May. Annual workday adjusted growth of purchases was 1.2 percent, down from 2.6 percent in both mid-quarter and April.

June’s setback was primarily attributable to a 0.8 percent monthly drop in sales of food, drink and tobacco. Non-food products, excluding auto fuel, were off only 0.2 percent, although even this was enough to wipe out May’s entire rise. Fuel purchases were flat on the month after a 0.2 percent dip last time.

Regionally, headline weakness was dominated by a 2.3 percent monthly slump in Germany although Spain (minus 0.4 percent) also struggled. More promisingly, France (0.1 percent) saw sales increase for a third consecutive period and there were decent gains in Austria (1.3 percent), Belgium, Latvia and Lithuania (all 0.8 percent) and Estonia (0.7 percent).

The June data make for a second quarter increase in Eurozone retail sales of only 0.3 percent, less than a third of the rate achieved in the previous period and just half of the fourth quarter pace. This does not bode well for real GDP growth. Moreover, the EU Commission’s economic sentiment survey found consumer sentiment falling in July so it may be that the third quarter got off to a less than robust start too. That said, Greek developments are clearly having some impact and a more concrete resolution of the crisis there might be enough to get households happy to spend again.

Big drop in Federal withholding:

er-8-5-4

Lower than expected, and June revised down a bit as well, all in line with many recent surveys:

ADP Employment Report
er-8-5-5

Mark Zandi, chief economist of Moody’s Analytics, said, “Job growth is strong, but it has moderated since the beginning of the year. Layoffs in the energy industry and weaker job gains in manufacturing are behind the slowdown. Nonetheless, even at this slower pace of growth, the labor market is fast approaching full employment.”
Read more at Calculated Risk Blog

About as expected with last month’s revision:

United States : International Trade
er-8-5-6

Seems the drop in oil prices has been offset by non oil imports, as the trade deficit is looking somewhat wider:

er-8-5-7

Both exports and imports are down which indicates a weakening global economy:

er-8-5-8

The chart shows the trend of the non petroleum deficit has resumed it’s increase:

The blue line is the total deficit, and the black line is the petroleum deficit, and the red line is the trade deficit ex-petroleum products (wild swings earlier this year were due to West Coast port slowdown).
Read more at Calculated Risk Blog
er-8-5-9


Didn’t know we exported any consumer goods!
;)

Exports (Exhibits 3, 6, and 7) Exports of goods decreased $0.2 billion to $127.6 billion in June. Exports of goods on a Census basis decreased $0.5 billion. • Capital goods decreased $0.8 billion. o Telecommunications equipment decreased $0.3 billion. • Industrial supplies and materials decreased $0.6 billion. o Finished metal shapes decreased $0.3 billion. Consumer goods increased $0.8 billion.

Stocks up because jobs were weak and a fed spokesman thought the economy was too weak for a rate hike. ;)

Futures jump on ADP miss, Powell comments

By Jenny Cosgrave

August 5 (CNBC)

er-8-5-10

GDP Income, Saudi Oil Output, Restaurant Index

BEA Reports 2nd Quarter 2015 GDP Growing at 2.32%:

By Rick Davis

July 30 (Consumer Metrics)

Real annualized per capita disposable income was reported to be $37,846, some -$364 per year less than the previously reported $38,210 per annum. All of that downside came as a result of revisions to the prior quarter’s data, which was revised downward by -$437 (over a full percent). Meanwhile, the household savings rate plunged to 4.8% — down -0.7% from the previously reported 5.5%.

For this revision the BEA assumed an annualized deflator of 2.04%. During the same quarter (April 2015 through June 2015) the inflation recorded by BLS in their CPI-U index was 3.52%. Under estimating inflation results in optimistic growth rates, and if the BEA’s “nominal” data was deflated using CPI-U inflation information the headline number would show a more modest +0.89% growth rate.

Especially hard hit in the revisions were the real per-capita disposable income numbers. The cumulative compound annualized growth rate for real disposable income has been only +0.45% since the second quarter of 2008. And these figures represent mean incomes that are skewed by disproportionate growth at the upper end. According to Sentier Research, median incomes during the same time span have contracted by roughly 4%.

And household savings rates have been weaker than previously suspected, confirming the lower incomes.

Demand for Saudi oil firm and up a bit:

er-8-2-1

Even this is sagging:

Restaurant Performance Index declined in June

By Bill McBride

July 31 (Calculated Risk Blog)

Here is a minor indicator I follow from the National Restaurant Association: Dampened Outlook Causes Restaurant Performance Index Decline in June

As a result of a somewhat dampened outlook among restaurant operators, the National Restaurant Association’s Restaurant Performance Index (RPI) declined in June for the second consecutive month. The RPI – a monthly composite index that tracks the health of and outlook for the U.S. restaurant industry – stood at 102.0 in June, down 0.4 percent from May and its lowest level in nine months. Despite the decline, June represented the 28th consecutive month in which the RPI stood above 100, which signifies continued expansion in the index of key industry indicators.

“Although same-store sales and customer traffic levels remained positive in June, the overall RPI declined as a result of dampened optimism among restaurant operators,” said Hudson Riehle, Senior Vice President of the Research and Knowledge Group for the Association. “The proportion of restaurant operators expecting sales growth fell to its lowest level in nine months, while operators’ outlook for the economy turned negative for the first time in nearly two years.”

er-8-2-2

The index decreased to 102.0 in June, down from 102.4 in May. (above 100 indicates expansion).

Restaurant spending is discretionary, so even though this is “D-list” data, I like to check it every month. Even with the decline in the index, this is a solid reading.

Read more at Calculated Risk Blog

Chicago Fed, KC Fed, Japan Exports

Note the details and the conclusion:

source: Econoday

er-7-23-1

Highlights

June proved to be a slightly stronger month for the economy than expected, based on the national activity index which came in at plus 0.08 vs Econoday expectations for a 0.05 dip. The 3-month average is still in the negative column though just barely at minus 0.01.

Production indicators showed the most improvement in June, at minus 0.01 vs minus 0.08 in May. The gain here reflects strength in the utilities and mining components of the industrial production report where, however, manufacturing remained flat. Employment also improved, to plus 0.12 from May’s plus 0.06, here reflecting the 2 tenth downtick in the unemployment rate to 5.3 percent. This dip, however, was tied to a decrease in those looking for work which is not a sign of job strength. Personal consumption & housing, at minus 0.07, was little changed as was the sales/orders/inventories component at plus 0.03.

This report is a bit of a head fake, not reflecting the weakness in manufacturing and the special factor behind the decline in the unemployment rate. In sum, growth in the economy is no better than the historical average which is a disappointment, showing little bounce from the weak first quarter.

Unambiguously negative, again:


source: Econoday
er-7-23-2

Highlights

Deep continuing contraction is the score for the Kansas City manufacturing report where the headline index is little changed at minus 7. Order readings point to more trouble ahead with new orders at minus 6 and backlog orders at minus 14. Weakness in export orders, at minus 10, is a central negative for the report, as is hiring, at minus 19 and the workweek at minus 18. Price readings are steady and mute. This region’s manufacturing sector, hurt by both exports and the energy sector, is badly depressed as is the Dallas manufacturing sector. Regional July reports from Dallas and Richmond will be posted early next week to round out the view for what looks to be another weak month for manufacturing.

er-7-23-3

More signs the US trade deficit will be larger for Q2.
From Japan:

Exports to Asia were up 10.1 percent on the year while those to China were 5.9 percent higher. Exports to the European Union added 10.8 percent. It was the seventh consecutive increase. Exports to the U.S. climbed for the tenth straight month, this time by 17.6 percent.

Truck Tonnage, MTG Purchase Apps, Gas Prices Not Helping, Existing Home Sales, Architectural Index

er-7-22-1

er-7-22-2

er-7-22-3

Who would’ve thought…

er-7-22-4

Up some but still depressed and not part of GDP in any case:

er-7-22-5

Up a bit but note the details:

“The June numbers are likely showing some catch-up from slow growth earlier this year. This is the first month in 2015 that all regions are reporting positive business conditions and aside from the multi-family housing sector, all design project categories appear to be in good shape,” said AIA Chief Economist Kermit Baker, Hon. AIA, PhD. “The demand for new apartments and condominiums may have crested with index scores going down each month this year and reaching the lowest point since 2011.”

Sector index breakdown: institutional (59.1), mixed practice (54.7), commercial / industrial (51.6) multi-family residential (47.0)
emphasis added

Read more at Calculated Risk Blog

LA Port Traffic, Greek Banks, Recession Without Financial Crisis

Another weak export report. No mention of the drop in oil prices reduced foreign incomes.

LA area Port Traffic: Weakness in June

by Bill McBride on 7/20/2015 09:57:00 AM

Note: There were some large swings in LA area port traffic earlier this year due to labor issues that were settled on February 21st. Port traffic surged in March as the waiting ships were unloaded (the trade deficit increased in March too), and port traffic declined in April. Perhaps traffic in June is closer to normal.

Container traffic gives us an idea about the volume of goods being exported and imported – and usually some hints about the trade report since LA area ports handle about 40% of the nation’s container port traffic.

The following graphs are for inbound and outbound traffic at the ports of Los Angeles and Long Beach in TEUs (TEUs: 20-foot equivalent units or 20-foot-long cargo container).

To remove the strong seasonal component for inbound traffic, the first graph shows the rolling 12 month average.

er 7-20-1

On a rolling 12 month basis, inbound traffic was down 0.4% compared to the rolling 12 months ending in May. Outbound traffic was down 0.9% compared to 12 months ending in May.

The recent downturn in exports might be due to the strong dollar and weakness in China.

Read more at Calculated Risk Blog

Reads like they still don’t have a clue about how banking works:

The Greek government ordered banks to open on Monday, three weeks after they were shut down to prevent the system collapsing under a flood of withdrawals,

That doesn’t cause collapse. Depositors might have to wait for their Euro. That’s all. No reason for the govt. to close the banks. Reads to me like the govt. thinks that Euro needed to run the economy, pay taxes, etc. would leave the country, or something like that. Makes no sense.

As Prime Minister Alexis Tsipras looked to the start of new bailout talks next week.

The first action of the new cabinet was to sign off on a decree to reopen banks on Monday with slightly more flexible withdrawal limits that allow a maximum of 420 euros a week in place of the strict limit of 60 euros a day currently in place.

But restrictions on transfers abroad and other capital controls remain in place.

It’s up to the banks to set their limits based on how much liquidity they have available.

Also:

Three week shutdown of Greece banks cost the economy an estimated €3B, not counting lost tourism revenue – press – Athens Chamber of Commerce and Industry (EBEA) says some 4,500 containers with raw materials and finished products are blocked at customs.

Additionally, €6B in business transactions were frozen by the bank shutdown.- Retailers lost about €600M in business, with apparel taking the main blow. Exporters lost €240M.

Source: TradeTheNews.com

Yes, negative growth and recession sometimes happens without a domestic financial
crisis, and without any financial crisis globally as well.

Lots of things can cause deficit spending- both non government (private sector) and government together- from being insufficient to offset agents desiring to spend less than their incomes.

Sometimes it’s a sudden obstruction to lending and sometimes it’s not.

Sometimes the agents spending more than their incomes just fade away. For a government allowing the deficit to get too small is a political choice, sometimes well informed but most often misguided.

For the private sector it could be insufficient income, or any reason it simply doesn’t want to borrow to spend or spend from savings.

And the private sector tends to be pro cyclical. That is, should GDP growth decline, private sector borrowing to spend tends to taper as well, as credit worthiness deteriorates, causing the slowdown to get worse. This downward process continues until some agent starts spending more than its income, which historically is government, as tax revenues fall and transfer payments increase with rising unemployment from the downward spiral.

So looks to me like it was the oil capex that was keeping up with the demand leakages, and when that collapsed as prices fell the demand leakages got the upper hand. And so far no sign of anything else stepping up its spending enough to move the GDP needle.

Atlanta Fed, 2004 vs 2015 US data, EU trade

The Atlanta Fed forecast as of July 14 is was +2.3% annualized for Q2, which is far below initial estimates of most professional forecasters, and below their current forecasts as well, and likely to be lowered further due to recent data.

The first government estimate for Q2 GDP will be released on July 30th. June trade numbers will not be released until August, and it looks to me like May was a zig that could zag in June and could cause a downward revision to Q2 GDP.

Inventories also look high to me which means a correction would further reduce Q2 GDP, and the low productivity numbers and decelerating employment reports tell me business is overstaffed for the current pace of sales and likely to adjust accordingly as well.


er 7-16-7

The economy before the 2004 rate hikes vs now:


er 7-16-8

Another strong surplus:


er 7-16-9

Highlights

The seasonally adjusted trade balance returned another healthy surplus in May. At E21.2 billion the black ink was short of April’s slightly downwardly revised E23.9 billion but still above the E20 billion mark for the fourth time so far this year.

The deterioration in the headline reflected a 1.5 percent monthly fall in exports, their first drop since January. Imports were flat. Annual growth of the former was 3.0 percent and of the latter 0.0 percent.

At E2.6 billion the average surplus in April/May was 6.4 percent above its first quarter mean which points to a probable small positive contribution from total net exports to second quarter real GDP growth. Quite apart from the weakness of the oil market, the current soft level of the euro should help to ensure continued strong trade data over the rest of 2015.

er 7-16-10

This is just the euro area, also in surplus:


er 7-16-11

Italy in surplus as well:


er 7-16-12

Highlights

The seasonally adjusted trade balance was in a E4.3 billion surplus in May following a marginally larger revised E3.6 billion excess in April.

The headline gain was mainly attributable to stronger exports which rose 1.5 percent from April, their third increase in the last four months. Much of this came courtesy of a 28.4 percent jump in the energy sector excluding which exports were up only 0.6 percent. Consumer goods (2.2 percent) had a good period but intermediates were only flat and capital goods were weak (minus 0.3 percent). Compared with May 2015 exports were 2.0 percent stronger.

Imports fell a monthly 0.3 percent, largely due to a 5.3 percent slump in energy although capital goods also struggled (minus 0.9 percent). Annual import growth was 0.5 percent.

Fed Testimony

Semiannual Monetary Policy Report to the Congress

By Janet Yellen

Looking forward, prospects are favorable for further improvement in the U.S. labor market and the economy more broadly. Low oil prices

Still seems to leave out the fact that a dollar saved by the buyer of oil is a dollar lost by the seller.

And ongoing employment gains should continue to bolster consumer spending, financial conditions generally remain supportive of growth,

Yes, but the growth rate of lending has only been relatively modest and stable

And the highly accommodative monetary policies abroad should work to strengthen global growth.

Low and negative rates and quantitative easing now have a very long history of not resulting in increased aggregate demand.

In addition, some of the headwinds restraining economic growth, including the effects of dollar appreciation on net exports and the effect of lower oil prices on capital spending, should diminish over time.

Yes, but the question is what will replace the lost capital spending? Without that incremental capital expenditure, growth, at best, stagnates and likely goes negative as the ‘demand leakages’ continue to grow.

Also, the weakness in U.S. exports is partially the consequence of lower oil prices as reduced U.S. expense for imported oil = reduced income available to non residents to import U.S. goods and services. And the decline in global oil capital expenditures works against global growth and U.S. exports as well.

As a result, the FOMC expects U.S. GDP growth to strengthen over the remainder of this year and the unemployment rate to decline gradually. As always, however, there are some uncertainties in the economic outlook. Foreign developments, in particular, pose some risks to U.S. growth. Most notably, although the recovery in the Euro area appears to have gained a firmer footing,

That’s due to the weak Euro helping their exports. You can’t have it both ways- if the dollar becomes less of a headwind for the U.S., the Euro will become less of a tailwind for the EU.

The situation in Greece remains difficult. And China continues to grapple with the challenges posed by high debt, weak property markets, and volatile financial conditions. But economic growth abroad could also pick up more quickly than observers generally anticipate, providing additional support for U.S. economic activity.

This again assumes lower rates and quantitative easing are accommodative, particularly in the EU and China

The U.S. economy also might snap back more quickly as the transitory influences holding down first-half growth fade and the boost to consumer spending from low oil prices shows through more definitively.

Again, still assumes lower oil prices are a net positive.