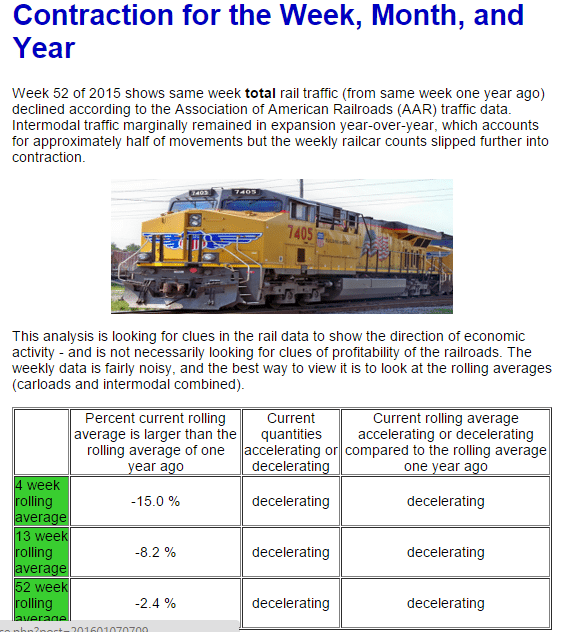
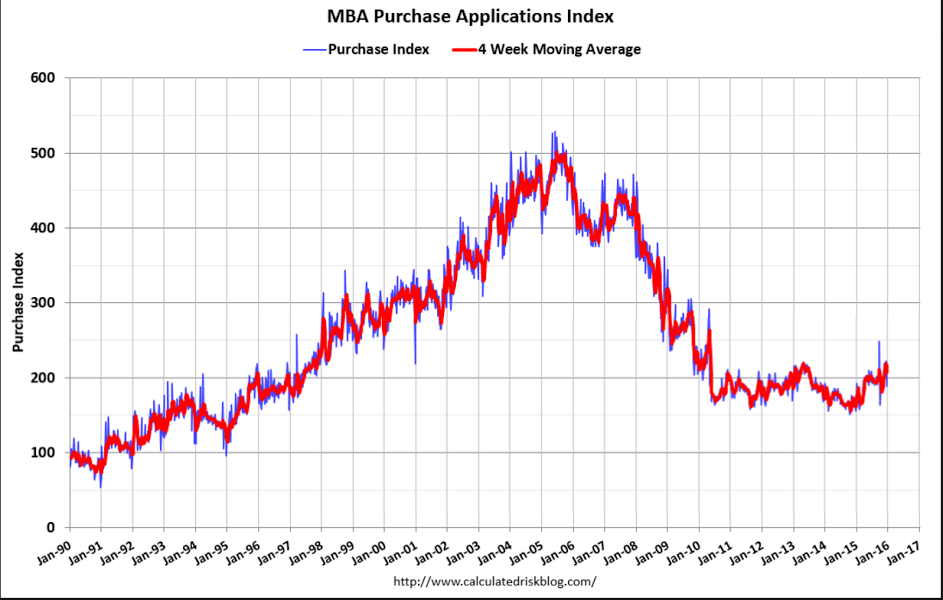
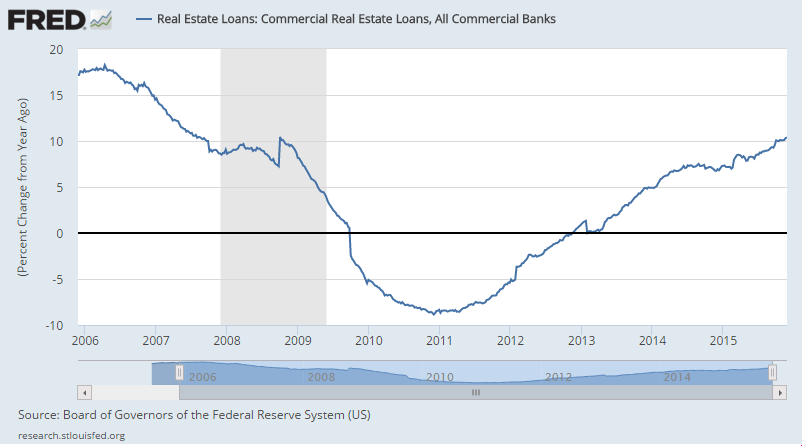
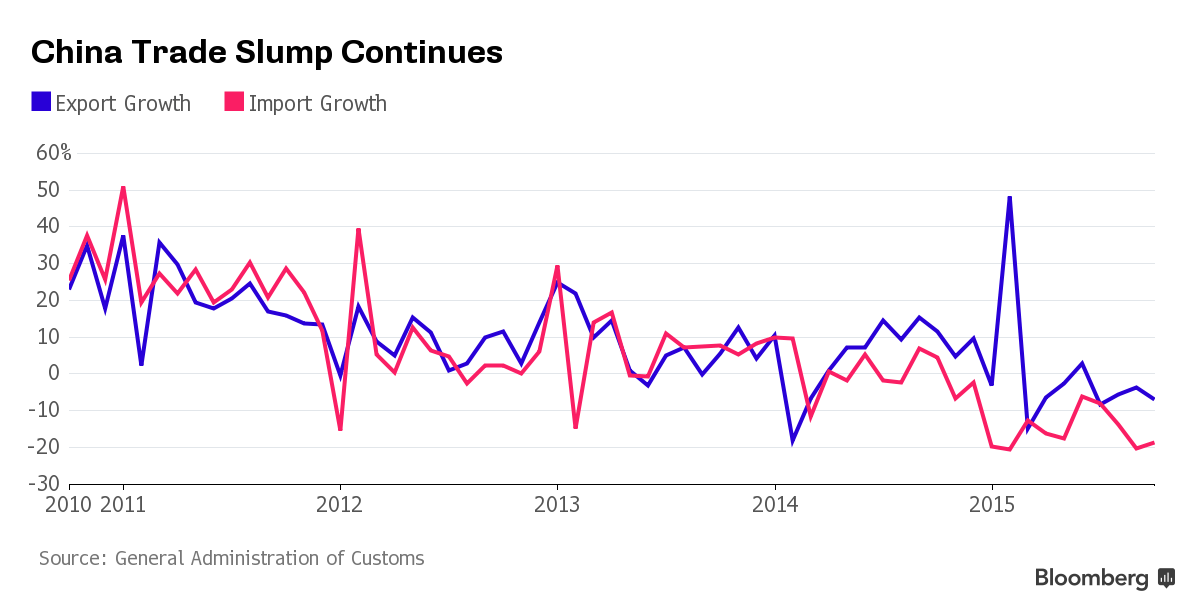
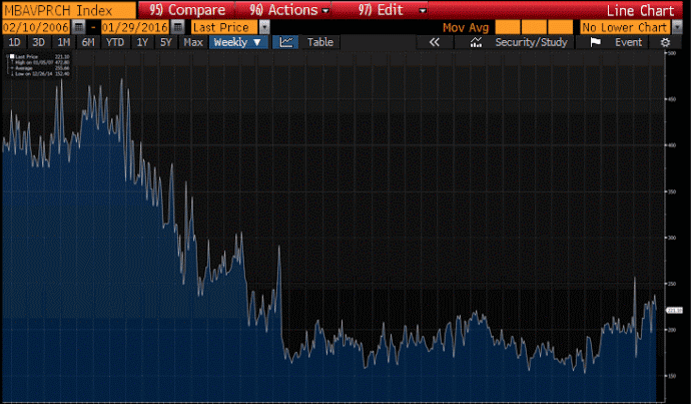
Up last week now back down as this sector remains in prolonged depression:
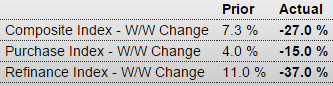
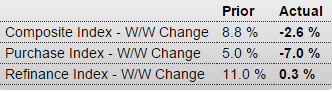
MBA Mortgage Applications
Highlights
The purchase index has been posting outsized gains this year but not in the January 29 week, falling 7.0 percent. The refinance index, however, did post a gain in the week, up 0.3 percent. Low interest rates have triggered strong demand for mortgage applications. The average 30-year fixed loan for conforming mortgages ($417,000 or less) fell 5 basis points and is back under 4.00 percent for the first time since October, at 3.97 percent.
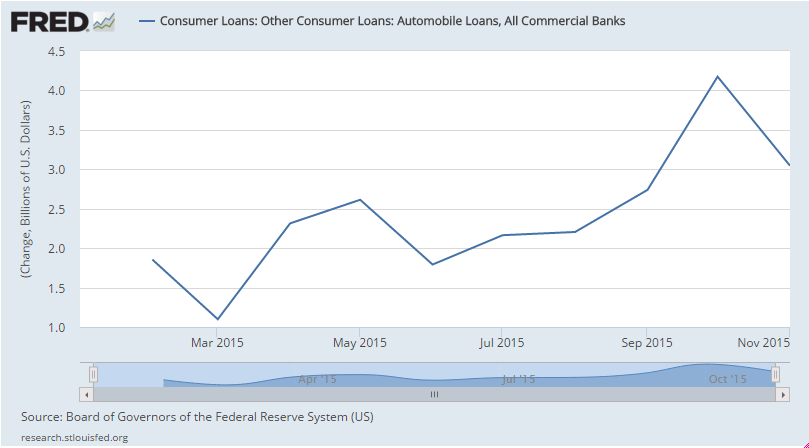
Winter Weather Dings U.S. Auto Sales
Feb 2 (WSJ) — Overall, auto sales were flat for the month, declining less than 1% to 1.15 million vehicles, according to researcher Autodata Corp. January’s selling pace was an annualized 17.58 million compared with 17.34 million in December. Incentive spending jumped 13% last month to $2,932 a vehicle, according to TrueCar Inc.WardsAuto, which the U.S. government uses for economic analysis, said the annualized rate was 17.46 million and that monthly sales fell 0.4 percent from a year ago. WardsAuto said U.S. sales hit a record 17.39 million vehicles in 2015.
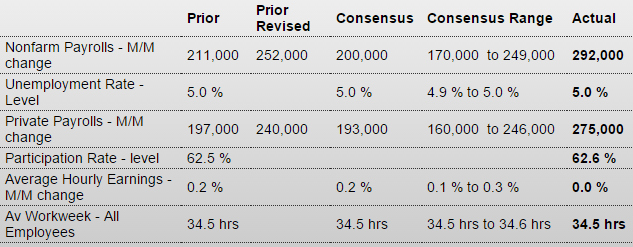
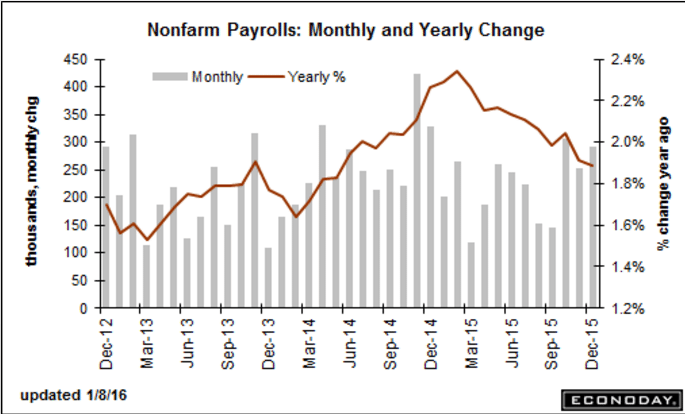
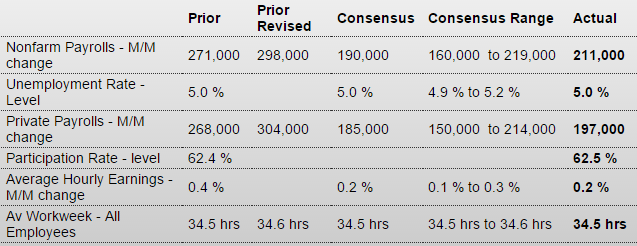
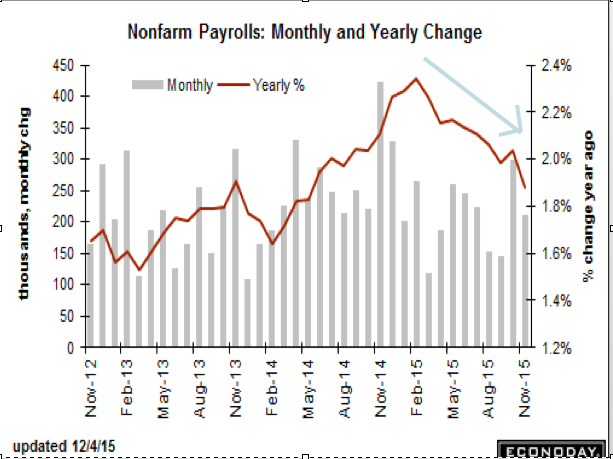
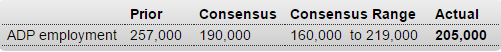
This is a forecast for Friday’s payroll number:
ADP Employment Report
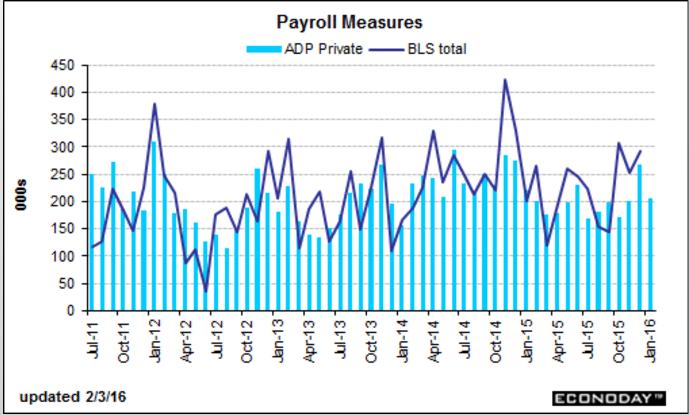
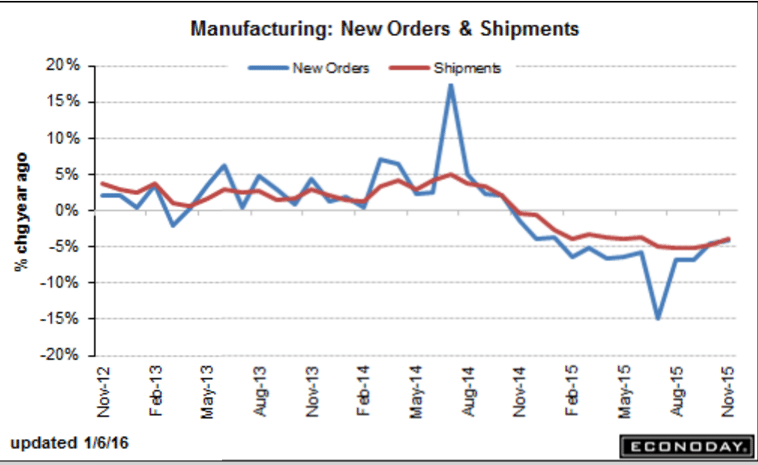
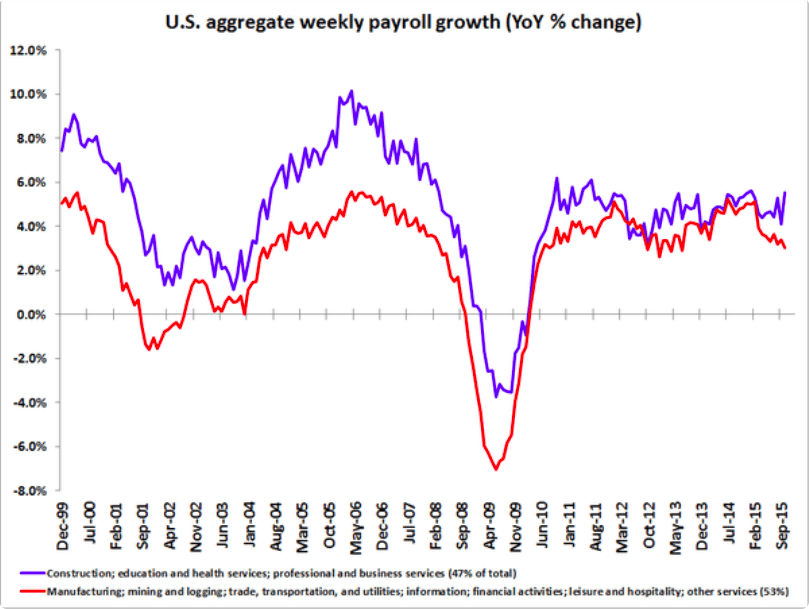
So with manufacturing having gone negative, which is about 15% of the economy, stands to reason some of those people are probably customers of the service sector? Skip to the charts which clearly indicate the direction it’s all going.
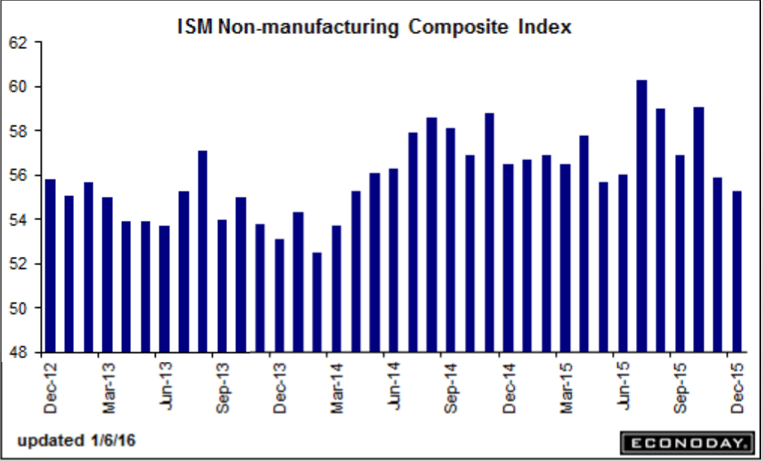
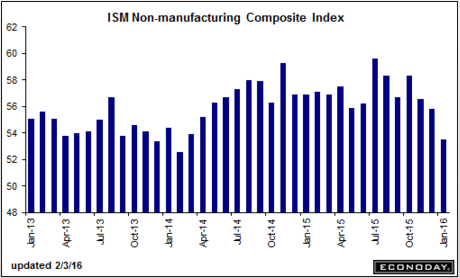
ISM Non-Mfg Index
Highlights
Monthly growth is slowing noticeably in ISM’s non-manufacturing sample. The composite index for January fell a sharp 2.3 points to 53.5 from December’s revised 55.8 which is 2 points below the Econoday consensus. Slowing is most apparent in output (as measured by the business activity component) with employment growth also slowing sharply, to 52.1 for a 4.2 point dip. However new orders, at 56.5, remain solidly above breakeven 50 though here to there is slowing, from December’s 58.9. Supplier deliveries, the fourth component of the composite, slowed in the month in a sign of congestion in the supply chain in what is an offsetting positive for the month.
Other readings include a solid 52.0 for backlog orders which are extending a long string of monthly expansion that contrasts sharply with a long string of contraction in the rival PMI services report. Inventories in ISM’s sample continue to rise but at only a marginal pace. Weakness is signaled by both contraction in import orders, which points to business caution among U.S. businesses, and also for export orders, the result of weak foreign markets and the negative effects of the strong dollar. Input prices, which have been subdued, fell in the month.
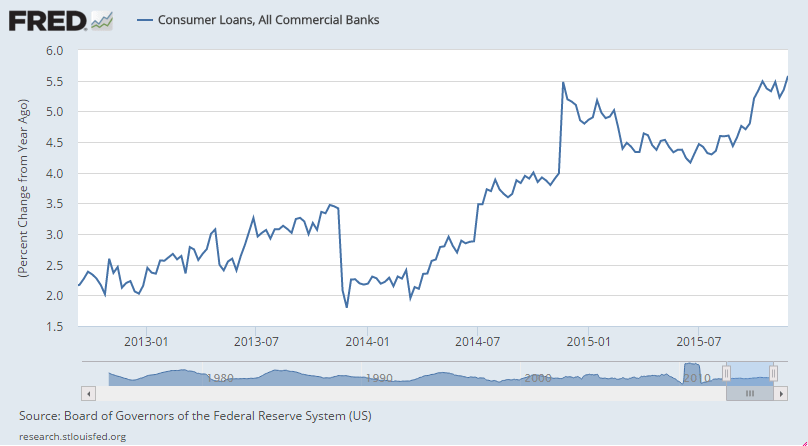
A negative in the report is narrow breadth among industries with 10 reporting composite growth in the month vs 8 reporting contraction, with the latter led by continued weakness for mining. Strength is led by both finance and real estate and includes construction.
Through much of last year, this report was among the most resilient, consistently pointing to steady strength that for the most part proved correct. Today’s declines, along with the dip in the PMI services report released earlier this morning, unfortunately hint at soft growth for the first quarter while this report’s employment index, hitting its lowest point since January last year, points to modest disappointment for Friday’s employment report.

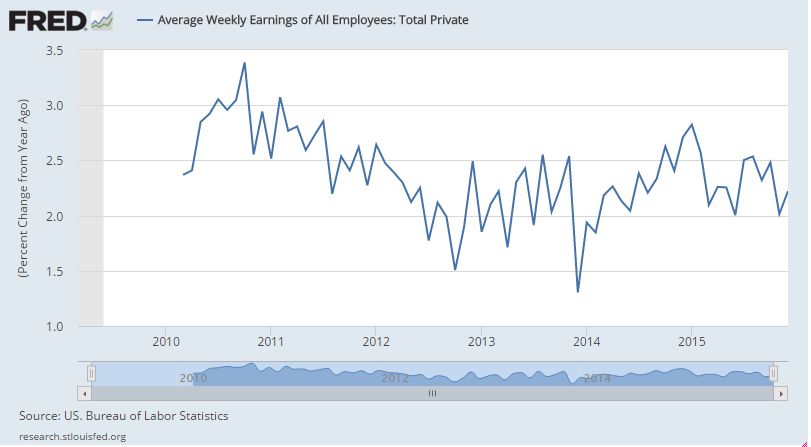
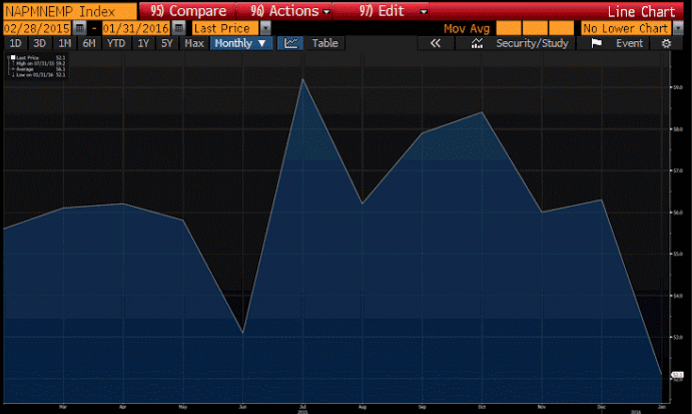
Still looks to me like it’s been falling back ever since the July spike:
This is the ISM non manufacturing employment index for the last year:
Exxon slashes spending after smallest profit in years
Feb 2 (Reuters) — Exxon said it will cut 2016 spending by one-quarter and suspend share repurchases. Exxon forecast capital spending at around $23.2 billion this year, a 25 percent drop from 2015. Exxon suspended its share buyback plan meant to return cash to investors in the first quarter. Exxon reported that fourth-quarter profit tumbled to $2.78 billion, or 67 cents per share, from $6.57 billion, or $1.56 per share, in the same period a year earlier. Exxon said its oil and gas output rose 4.8 percent in the fourth quarter as it pumped more crude oil.
To again quote the carpenter with his piece of wood- “no matter how much I cut off it’s still too short”:
BOJ Kuroda says ready to use more policy options to boost inflation
Feb 2 (Reuters) — “If we judge that existing measures in the toolkit are not enough to achieve (our) goal, what we have to do is to devise new tools,” BOJ Governor Haruhiko Kuroda said in a speech. “I am convinced that there is no limit to measures for monetary easing,” he said. Kuroda countered criticism that the BOJ was running out of ammunition to accelerate inflation, saying negative rates won’t hamper the bank’s efforts to gobble up government bonds. “If judged necessary, it is possible to further cut the interest rate from the current level of minus 0.1 percent,” he said.