Saudi price setting

Yes, they use the specs for cover and get away with it

They announce their posted prices will be a spread off of ‘market prices’
And then raise their posted prices lock step with higher prices from specs.

If instead the simply left their posted prices alone the price would quickly come back to their posted prices.

It seems to me impossible they don’t know this and are playing us for complete fools

WikiLeaks: Saudis often warned U.S. about oil speculators

dollar short squeeze update

Looks like it’s happening as suggested if might just as crude started breaking down after the Ben Laden assassination.

And the Saudi investor prince’s proclamation that the Saudis thought $70-80 for crude was their target might at least indicate that they aren’t in price hiking mode.

Another point up in the dollar index might bring the beginning of short covering by trend followers.

But still looks to me like it’s only the beginning of what should trigger the end of the looming inflation that never was and a return to deflationary psychology in general.

The fallout of the dollar reversal will continue to be lower term rates, weaker stocks, weaker commodities, and in general a reversal of the ‘the fed’s printing money’ hysteria. And I also suspect Congress and the President will come through with a deficit reduction package that will further exacerbate the dollar shortage and add a bit of drag to the world economy.

Nor is any of this is good for the euro zone which continues to fight the fact that the only way it all works is if the ECB writes the check, provided, of course, they all recognize capital requirements for the ECB are nothing more than a self imposed constraint.
(And yes, I know that’s asking a lot.)

Commodities, China and 2012

From Art Patten, Symmetry Capital Management, LLC

A brief overview of our current thinking on the financial market and economic outlook—please see important disclosures at the bottom of this email:


Yesterday’s rally provided a reprieve from strong selling pressures, but was low-conviction judging by trading volumes and bond market behavior. I suspect it will prove temporary and that the current trend will remain negative. Normally we could ascribe that to seasonal dynamics—for example, the old “sell in May and go away” adage—but there are some really strange forces at work, and almost all of them are bearish. They may not cause much damage in the coming quarters, but at some point they will. Our current guess is 2012, but it could start earlier.

  • Recent commodity market volatility indicates to us that the trade is highly levered on the bullish side, and thus increasingly fragile. As long as there’s real demand, the investment (speculative!?) demand from developed world investors can do OK (and then some, in recent quarters). But there are now rumors of commodity supplies being used in China in much the same way that houses were used in some western countries 2005-2007, tech stocks 1998-2000, and so on here), and monetary and credit indicators from China do not bode well for commodity prices right now.
  • There are similarly fragile dynamics in Europe, where continental banks levered up on the debt of countries that now can’t pay their bills, as they surrendered monetary autonomy to join a union with no fiscal authority (and a real anti-fiscal fetish, as embodied in the Maastricht Treaty). Money and credit indicators out of Europe look absolutely horrific at the moment.
  • Either of those fragile equilibria could break hard in 2011, with the usual contagion to financial markets and asset prices. If they are not managed proactively (a serious possibility given (1) the zero-bound on central banks’ interest rate targets and (2) the prevailing deficit and debt phobias around the world) it will spread to the global economy yet again, against a backdrop of already-high unemployment and painful relative price shocks from food and fuel.
  • On a relative basis, the U.S. looks attractive. However, in 2011-2012, the proportion of young adults in the U.S. economy turns negative here), something that is strongly associated with recessions.
  • Fiscal austerity will only worsen things. In fact, we’re not surprised by the softness in U.S. leading indicators, given announcements that federal tax receipts were better than expected. Remember—today, the federal budget deficit is what gold mines were in the 19th century. In an over-levered economy slowly recovering from recession, it would have been very hard to produce too much new gold (money) back then, and the last thing you would have done is re-bury whatever gold was produced. But ‘fiscal discipline’ today amounts to the very same thing! Granted, it’s rational to worry that larger deficits will mean higher tax rates, as few politicians—and far too few economists!—grasp the reality of our monetary system and how it interacts with fiscal policy.
  • The current trajectory of the debt ceiling negotiations is depressing. The GOP believes that government spending crowds out private investment, as though money comes from somewhere ‘out there’ or is still dug out of the ground. The Dems can’t get over their beloved ‘Clinton surpluses,’ ignoring the fact that they, like every other significant federal budget surplus, were followed by a recession. For the last few weeks, a few members of the GOP have been pointing out (correctly) that the U.S. will not default. It will direct revenues to Treasury debt holders first, and be forced to make severe spending cuts elsewhere. This will further undermine an already anemic level of overall demand. In fact, fiscal authorities in most parts of the world are doing all they can to undermine global aggregate demand. The U.S. Congress is just now joining the party.
  • U.S. equity markets aren’t indicating an imminent recession, but keep in mind that they were more of a coincident than a leading indicator when the last one started in December 2007. I expect a similar dynamic this time around, with a sideways trend eventually giving way to one or more financial shocks and the eventual realization that we’ve driven ourselves into the ditch yet again.
  • Longer-term, we’re heading into an environment in which the relative impotence of monetary policy will become a new meme, a 180-degree turn from the last four or five decades. And it will probably take at least a decade for macro policy to adjust (Japan’s policymakers still haven’t, over 20 years later). More lost decades ahead? We’re starting to think it’s a wise bet.
  • The only factors that look benign at the moment are in U.S. credit markets. They imply that the employment picture should continue to improve and that the U.S. economy is not nearing recession. If we had to guess, we’d predict one or two financial market shocks ahead, but depending on their timing, there could be something of an equity market rally after the usual summer doldrums. But it might involve significant sector rotation, and our outlook for 2012 is rather pessimistic at the moment.

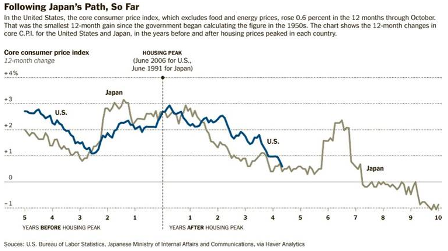
Finally, here’s a chart that the NYT ran in January that makes a compelling case that a 1970s-style inflation is off the table. If time allows, I’ll pen an Idle Speculator piece this summer on why that is. In the meantime:

Symmetry Capital Management, LLC (SCM) is a Pennsylvania-registered investment advisor that offers discretionary investment management to individuals and institutions. This publication is for informational, educational, and entertainment purposes only. It is not an offer to sell or a solicitation to buy securities, nor is it a recommendation to engage in any investment strategy. This material does not take into account your personal investment objectives, financial situation and needs, or personal tolerance for risk. Thus, any investment strategies or securities discussed herein may not be suitable for you. You should be aware of the real risk of loss that accompanies any investment activity, and it is strongly recommended that you consider seeking advice from your own investment advisor(s) when considering any investment strategy or security. SCM does not guarantee any specific outcome from any strategy or security discussed herein. The opinions expressed are based on information believed to be reliable, but SCM does not warrant its completeness or accuracy, and you should not rely on it as such.

Beware of ‘Debt Bomb’ and $70-$80 crude : Prince Alwaleed

So how would the fact that even the world’s largest investors don’t even begin to understand the monetary system
fit into the various theories about markets efficiently allocating capital, etc?

And note that he also did just say on CNBC the Saudi’s objective is $70-80 for crude.
So even though he’s probably not the decision maker, seems he does understand how a monopolist sets price.

Raise Ceiling but Beware of ‘Debt Bomb’: Prince Alwaleed

By Jeff Cox

May 20 (CNBC) &#8212 Saudi Prince Alwaleed bin Talal called on US lawmakers to raise the debt ceiling, while also warning that steps must be taken to control government spending.

The renowned investor and philanthropist, and nephew of King Abdullah, also rejected the notion that the US could delay payments on its bonds for several days as has been suggested by Rep. Paul Ryan and hedge fund manager Stanley Druckenmiller.

“We in the outside world, outside the United States, believe the United States is not giving much care and attention to this time bomb that you have right now here,” bin Talal said in a CNBC interview.

“You need some structural changes in the United States,” he added. “You can’t go forever with $1 trillion in arrears. That’s the thing.”

Saudi Arabia Worried About Speculators’ Interest in Oil

Is this a signal for lower prices?
Or just talk to disguise the fact that they are the price setters?

Trying to figure out what they are going to do next is much like Fed watching.

Saudi Arabia Worried About Speculators’ Interest in Oil

By Jackie DeAngelis

May 19 (CNBC) — Saudi Arabia will take a cautious approach to opening up its stock markets to international investors, and the country is concerned about speculative interest in oil markets, finance minister Ibrahim Al-Assaf told CNBC.

Al-Assaf said in an interview that the Kingdom worries about high oil prices, and that he believes that speculators are currently propping up the market.

monopoly pricing in copper

Though it can’t ‘prove’ anything, the looks to me to be supportive of my suspicion that the two remaining copper producers are not competing, but instead are colluding to set price and let quantity adjust.

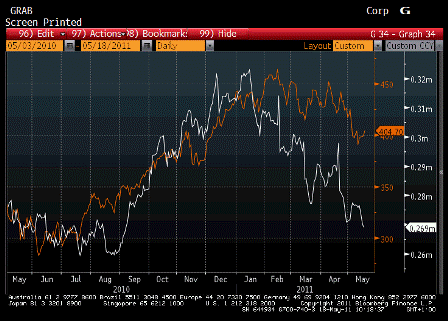
On your post regarding the recent commodity decline, the attached graph shows the generic copper future price and the open interest.

There has been a substantial drop in open interest since Feb11 to current. The copper price has declined but not nearly as much. Is this fair to signal a more heavier decline in price? (accompanied by increase in OI)

I did read on your post you mentioned longs selling to other longs which would indicate no change in OI and so perhaps trend reversal, but we are beyond this point now in commodities?

I presume commodity prices for example copper should be heading back to pre QE2 level (03/11/2010) if not lower with a slowing US economy. And this will be the same for equities

Warren’s latest presentation

Attached is a copy of a presentation that Warren delivered yesterday in Montreal.

We were extremely well received and Warren was a huge hit, mixing a concoction of high dose monetary economic realities with real life experiences and anecdotes from his long and lustrous career as a market wizard. The presentation was scheduled for 45 minutes but turned into 1hr20 minutes including Q&A.

Presentation link here.

Bullish Funds Slash Commodity Bets by $17 Billion

And the question is, who did they sell to?

Yes, with futures and forwards for every long there is a short, but that doesn’t mean the short is a speculator.

It is more likely that there is a long inventory position, directly or indirectly, behind most short futures positions.

So the short in the futures and forward market is either a producer or another long with a physical inventory position.

So would producers cover based on last week’s action? Probably not.
Would the holder of the long cash and carry position unwind?
Only if the spread sufficiently changed in his favor.

So the most likely explanation is that the longs sold to different longs.
And not necessarily ‘strong hands’ like end users and central banks.

And if actual supply did get ahead of demand, prices adjust to get them back in line.
And producers don’t stop producing until prices at least get to their marginal cost of production.

And after watching what happened in Pakistan, and signs of weak demand and expanded supply down the road, the Saudis may have decided that lower crude prices might be in their best interest?
Impossible to say, but their posted prices are being reset lower as the spot prices fall.

Which could mean what is all, in the grand scheme of things, dollar short covering as previously described, has only just begun.

Bullish Funds Slash Commodity Bets by $17 Billion

May 14 (Reuters) —Big hedge funds and speculators cut their bullish bets on commodity markets by $17 billion in the week through Tuesday, the biggest bear turn since at least 2009, regulatory data showed on Friday.

The so-called “managed money” funds cut their overall net long holdings in 22 U.S. futures markets by over 222,000 contracts or 13 percent in the five days ended May 10, according to Reuters calculations based on the Commodity Futures Trading Commission’s weekly Commitment of Traders.

The data, based on both futures and options positions, confirm that some big hedge funds, commodity trading advisors (CTAs) and other major speculators dramatically pared back long positions during a week in which prices abruptly collapsed before staging a modest rebound.

But it also shows that in some markets, such as oil, the story was more complicated.

The one-week cut in holdings was the largest since 2010, when available data begins. Total fund length still stood at its highest since mid-March at 1.5 million contracts.

“I would view this as a bearish situation. We have a confirmed flow of selling with substantial remaining net long positions that can fuel an ongoing flow of that selling,” said Tim Evans, energy analyst at Citi Futures Perspective.

The value of total fund holdings fell to $116.8 billion, less than a third of the total amount of investor capital estimated to be allocated to commodity markets worldwide. Some of that money is in over-the-counter contracts or invested via banks, which are part of a different CFTC group.

Although it is an imperfect gauge, the CFTC data offers the best clues yet as to how traders positioned during the most volatile week in two years.

Crude oil collapsed by $10 on May 5 in a rout that traders are still struggling to explain, taking commodities with them, but then rebounded Monday and Tuesday.

Oil Longs Slash $6.5 Billion


The biggest decline in the value of net long positions occurred in the crude oil market, where prices dropped by about 6.5 percent. The New York Mercantile Exchange’s U.S. crude oil futures and the IntercontinentalExchange’s look-alike contract saw speculators’ net long position drop by $6.5 billion.

The notional figure is calculated by Reuters based on the change in the net position from a week ago, multiplied by the contract’s value at the end of the period. Because most investors trade commodities on margin, the drop in the value of positions is not directly equivalent to total divestment.

Bullish bets on oil fell to the lowest since late February, when traders were beginning to factor in more geopolitical risk from Middle East instability and war in Libya.

But the drop occurred even as the total open interest — the number of outstanding futures contracts that haven’t been settled — rose to a record, indicating that more traders were opening positions than were closing them during the week.

While bullish speculators sold long positions actively during the week, bearish speculators also added new short positions, increasing the short interest to the highest since late February.

The “swap dealers” category, generally big banks, covered some of their large net short position.

Gold, Silver Liquidation

Precious metals also saw heavy selling during the week, although this was more the result of pure long liquidation than traders taking up new short positions.

Long holdings in COMEX gold fell by nearly 20,000 contracts or 10 percent on the week, a reduction equivalent to roughly $3 billion, the biggest drop since last November. Gold futures fell by about 1.5 percent that week.

Big hedge funds had actually begun paring positions weeks before prices reached an all-time high of nearly $50 an ounce.

At about 19,000 contracts, speculative net length is at its second-lowest since early 2010.

The Chicago corn saw similar positioning dominated by fund managers taking profits.

Bullish funds cut their length by some $950 million to take positions to their lowest in six weeks, and near the lowest since the middle of last year.

Prices fell by a more modest 1.8 percent.

“They still have a sizable amount and if things don’t go their way, there could be more liquidation to come,” said grains analyst Mark Schultz at Northstar Commodity Investments Co. in Minneapolis.

QE2: Captain, your ship is sinking

So imagine the corn crop report comes out and it surprises on the upside at up 30%
What happens? The price of corn probably starts to fall. Commercial buyers back off, farmers rush to hedge, and, overall, players of all ilks try to reduce positions, get short, etc.

A few weeks later it’s further confirmed that the farmers are producing a massive bumper crop.

What happens? The same adjustments continue.

But what if that crop report was wrong? What if, in actual fact, there had been a crop failure? And market participants never do get that information?

What happens? Prices go down for a while as described above, but at some point they reverse, as sellers dry up, and as consumption overtakes actual supply price work their way higher, and then accelerate higher, even if no one ever actually figures out there was a crop failure.

QE is, in fact, a ‘crop failure’ for the dollar. The Fed’s shifting of securities out of the economy and replacing them with clearing balances removes interest income. And the lower rates from Fed policy also reduces interest paid to the economy by the US Treasury, which is a net payer of interest.

But the global markets mistakenly believed QE was producing a bumper crop for the dollar. They all believed, and some to the of panic, that the Fed was ‘printing money’ and flooding the world with dollars.

So what happened? The tripped overthemselves to rid them selves of dollars in every possible manner. Buying gold, silver, and the other commodities, buying stocks, selling dollars for most every other currency, selling tsy securities, etc. etc. etc. in what was, in most ways, all the same trade.

This went on for months, continually reinforced by the pervasive rhetoric that QE was ‘money printing’, and that the Fed was playing with fire and risking hyperinflation, with the US on the verge of suddenly/instantly becoming the next Greece and getting its funding cut off.

Not to mention Congress with it’s deficit reduction phobia.

So what’s happening now? While everyone still believes QE is a bumper crop phenomena, QE (and 0 rate policy in general) is none the less an ongoing crop failure, continuously removing $US net financial assets from the economy.

And so now that the speculators and portfolio shifters have run up prices of all they tripped over each other to buy, the anticipated growth in spending power-underlying aggregate demand growth needed to support those prices- isn’t there. And, to throw more water on the fire, the higher prices triggered supply side repsonse that have increased net supply along with a bit of ‘demand destruction’ as well.

Last week I suggested that higher crude prices were the last thing holding down the dollar, and that as crude started to fall I suggested its was all starting to reverse.

It’s now looking like it’s underway in earnest.