CPI, commodity charts

Quite a few price increases, which the media now calls ‘inflation’ even though inflation is a continuous increase in the price level:

The annual inflation rate in the US surged to 6.2% in October of 2021, the highest since November of 1990 and above forecasts of 5.8%. Upward pressure was broad-based, with energy costs recording the biggest gain (30% vs 24.8% in September), namely gasoline (49.6%). Inflation also increased for shelter (3.5% vs 3.2%); food (5.3% vs 4.6%, the highest since January of 2009), namely food at home (5.4% vs 4.5%); new vehicles (9.8% vs 8.7%); used cars and trucks (26.4% percent vs 24.4%); transportation services (4.5% vs 4.4%); apparel (4.3% vs 3.4%); and medical care services (1.7% vs 0.9%). The monthly rate increased to 0.9% from 0.4% in September, also higher than forecasts of 0.6%, boosted by higher cost of energy, shelter, food, used cars and trucks, and new vehicles. source: U.S. Bureau of Labor Statistics

The longer term chart show how so far it’s just a one time blip up:


Quite a few commodities are also looking like it’s been a one time blip up:

Oil prices, however are set by Saudi Arabia working closely with Russia,
so at least for the medium term the price is an entirely political decision:

https://www.dtnpf.com/agriculture/web/AG/news/world-policy/article/2021/11/08/oil-futures-gain-saudi-osp-hike-us

NY Mfg survey, Home builder’s index, oil losses, Japan, China trade, euro trade

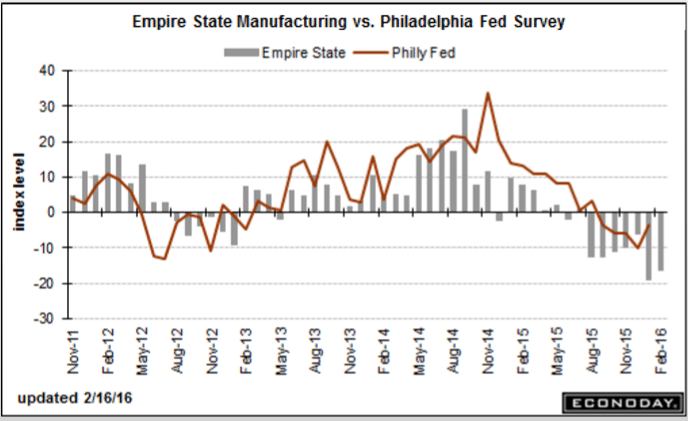
A lot worse than expected and still deep in contraction:

Empire State Mfg Survey
er-2-16-1
Highlights
For the seventh straight month, the Empire State report is signaling significant contraction for the manufacturing sector. The general business conditions index for February came in below low-end expectations, at minus 16.64 vs even deeper contraction of minus 19.37 in January. New orders, at minus 11.63, are in contraction for a ninth month in a row while employment, though improving to minus 0.99 from minus 13.00, is in contraction for an eighth month in a row.

Shipments are in contraction at minus 11.56 with unfilled orders at minus 6.93. The workweek is at minus 5.94. One reading in the plus column is the six-month outlook, up nearly 5 points to 14.48 which, however, is unusually low for this reading which usually tracks in the 30s and 40s. Price data show marginal improvement for inputs but contraction for finished goods.

This report is showing its weakest run by far of the recovery and, unfortunately, points to extended weakness for the nation’s factory which is getting hit by weak exports and weak energy markets at home.
er-2-16-2
This is going the wrong way for what’s been promoted as the ‘driver’ of the economy for the year:

Housing Market Index
er-2-16-3
Highlights
Optimism among home builders is cooling noticeably, based on the housing market index for February which is down 3 points to 58 for the lowest reading since May last year. But 58 is still well over breakeven 50 with the future sales component actually rising 1 point to 65. The current sales component, however, is down 3 points to 65 which points to expected slowing for tomorrow’s starts & permits data. The traffic component has been holding down this report throughout the whole recovery and continues to do so, down a steep 5 points to 39 and the lowest reading since also May last year. Weakness here reflects lack of first-time buyers and also perhaps the major snowstorm that hit the East Coast at mid-month.

Details show step backwards for all four regions with the West, a key region for the new home sector, down 5 points to a still standout composite score of 68. The South and Midwest are both at 57 with the Northeast continuing to trail far behind, down 2 points to 45.

Builders are citing scarcity of both labor and available lots as negatives right now. Momentum in the housing sector was bumpy last year and, based on this report, looks to remain so, at least through the early part of this year.

As previously discussed, not good for bank, either:

High risk of bankruptcy for one-third of oil firms: Deloitte

Feb 16 (Reuters) — Roughly a third of oil producers are at high risk of slipping into bankruptcy this year as low commodity prices crimp their access to cash and ability to cut debt, according to a study by Deloitte. The report is based on a review of more than 500 publicly traded oil and natural gas exploration and production companies across the globe. The roughly 175 companies at risk of bankruptcy have more than $150 billion in debt, with the slipping value of secondary stock offerings and asset sales further hindering their ability to generate cash, Deloitte said in the report.

Pro active currency depreciation tends to have these kinds of consequences:

Japan’s household spending falls 2.7% in 2015

Feb 16 (Kyodo) — Japan’s average monthly household spending in 2015 fell 2.7 percent in price-adjusted real terms from the previous year to 247,126 yen for the second straight year of decrease. The drop followed a demand surge in the January to March period in 2014 before the consumption tax increase in April as well as weak sales of clothing due to an unusually warm winter, according to an official of the Internal Affairs and Communications Ministry. The decline compares with a 3.2 percent drop in 2014. Household spending figures are a key indicator of private spending, which accounts for around 60 percent of the nation’s gross domestic product.

Two things. First, weak exports tend to reflect weak global demand. Second, reduced imports tend to reflect weak domestic demand.

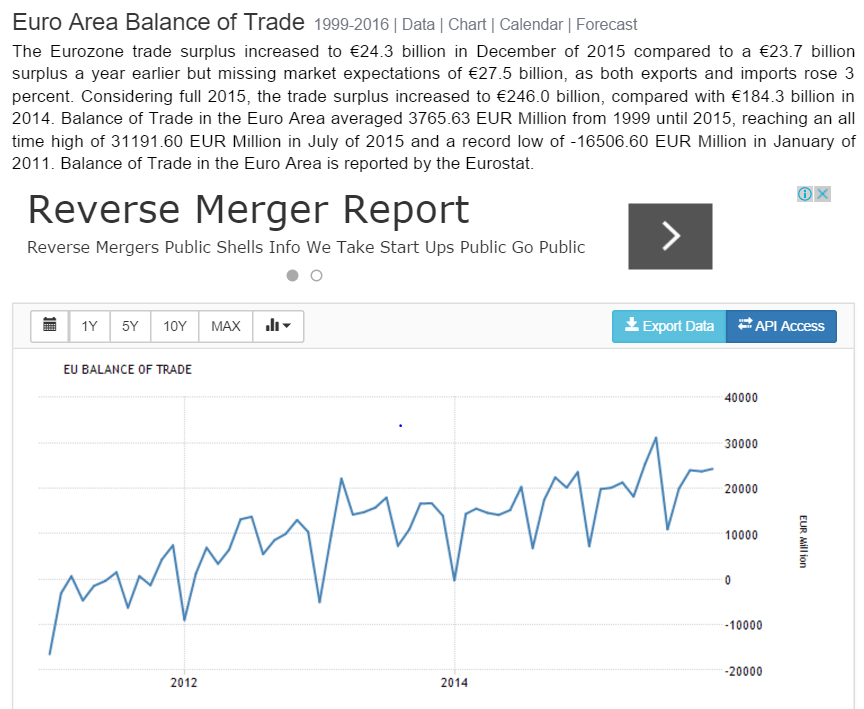
And the ‘solid’ -;)- trade surplus is a fundamental force that works to support the currency:

China Trade Surplus Hits Fresh Record High in January

China trade surplus stood at USD63.29 billion in January of 2016, widening from USD60.03 billion reported a year earlier and beating market consensus. It is the largest trade surplus on record, as exports and imports fell far worse than expected. In January, exports plunged by 11.2 percent year-on-year to USD177.48 billion, following a 1.4 percent fall in December 2015.Imports tumbled by 18.8 percent year-on-year to USD114.19 billion, following a 7.6 percent decline in the preceding month, the 14th straight month of contraction, as a result of declining commodity prices and weak demand.
Same for the euro:
er-2-16-4

Copper, Japan, Corp tax policy

They must have found a way for their workers to live on fewer calories…

Copper Miners’ Pain Doesn’t Stop Buildup

Nov 23 (WSJ) —Global copper production is on track to hit an all-time high of 18.7 million metric tons this year, according to BMO Capital Markets. The cost of producing a pound of copper at Freeport’s Grasberg mine in Indonesia will drop to 61 cents next year, from an estimated $1.05 cents in 2015, according to BMO. Next year, four new mines will increase the world’s copper production by 5.1%, says Barclays. This year, rains, drought, earthquakes and labor strikes cut 9% from planned global mine output, versus typical annual losses of 4% to 5%, said Citigroup.

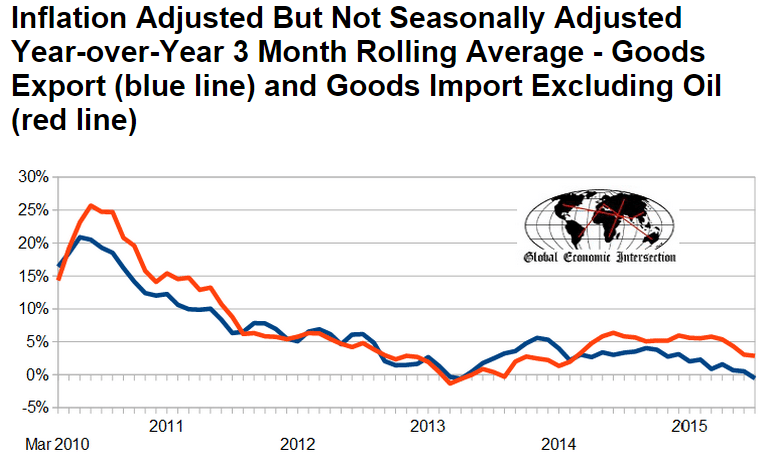
Capital Expenditure is one of the channels whereby agents spend more than their incomes which offsets those spending less than their incomes:
Japan Inc. tightens purse strings at home

Nov 24 (Nikkei) — Capital spending in Japan shrank an annualized 4.8% from the previous quarter in the April-June period and fell an annualized 5% in the three months ended in September. Aggregate pretax profit of listed companies in Japan is seen climbing to a record for the second consecutive year in fiscal 2015. Japanese companies M&A spending overseas topped 10 trillion yen ($80.6 billion) for the first time this year, according to M&A advisory Recof. R&D spending will be included in GDP data from the end of next year, but at this point, its omission makes corporate spending look even smaller than the reality.

The progressive response is to eliminate all corporate taxes, as they merely get passed through to consumers. But don’t count on either side picking up on that. Or that in no case should health care be a marginal cost of production, unless the work itself causes health problems, etc. etc. etc.

phizer

Brent Spot Chart, China, Atlanta Fed

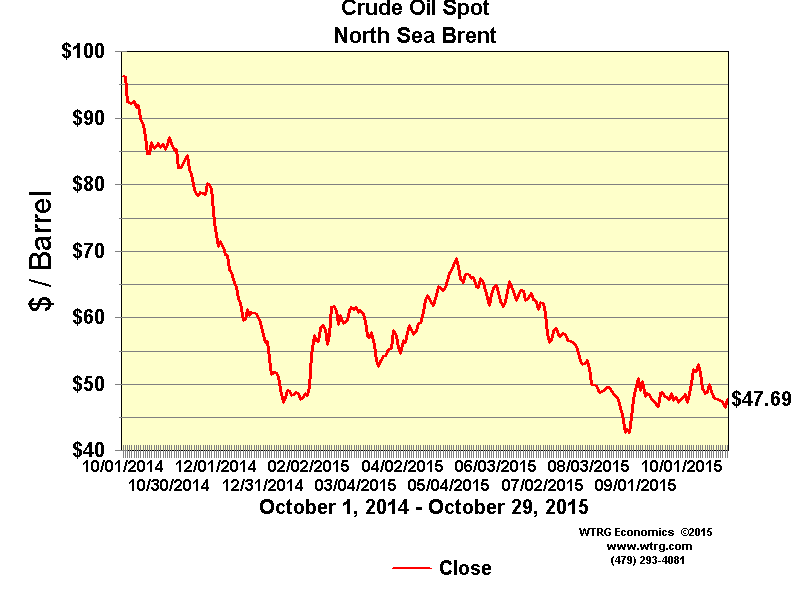
Looks a lot more negative since the October 5 Saudi price cuts than the futures markets. These price are more indicative of prices of physical oil vs financial portfolio activities:
er-11-1
Note the lack of results of ‘monetary policy’:

China’s October factory, services surveys show economy still wobbly

Nov 1 (Reuters) — Activity in China’s manufacturing sector unexpectedly contracted in October for a third straight month, an official survey showed on Sunday, fuelling fears the economy may still be losing momentum in the fourth quarter despite a raft of stimulus measures.

Adding to those concerns, China’s services sector, which has been one of the few bright spots in the economy, also showed signs of cooling last month, expanding at its slowest pace in nearly seven years.

“As deflation risks intensify, a further RRR cut before end of this year is still possible,” ANZ said, referring to reducing the amount of reserves that banks must hold in order to free up more funds for new loans.

The official Purchasing Managers’ Index(PMI) was at 49.8 in October, the same pace as in previous month and lagging market expectations of 50.0, according to the National Bureau of Statistics(NBS). A reading below 50 points suggests an contraction.

New export orders contracted for a 13th straight month, though the sub-index for new orders – a proxy for both domestic and foreign demand – edged up marginally to 50.3, compared with September’s 50.2.

Faced with persistently weak demand, factory owners continued to lay off workers and at a slightly faster pace than in September.

As for the services sector, whose growth has helped offset persistent weakness in manufacturing, the official non-manufacturing PMI fell to 53.1 in October from September’s 53.4. Though still a solid pace of expansion, it was the lowest reading since late 2008 during the global financial crisis, a similar survey showed.

SMALL FIRMS FACING BIGGER STRESSES

Activity in small and mid-sized firms continued to contract in October, with more small firms seeing fund shortages compared to big ones, the official survey showed. Small companies account for up to 80 percent of urban employment and 60 percent of China’s GDP.

The government has cut interest rates six times since November and lowered the amount of cash that banks must hold as reserves four times this year. The latest cut in interest rates and banks’ reserve requirement came on Oct 23.

Beijing has also quickened spending on infrastructure and eased curbs on the ailing property sector. The latter have helped revive weak home sales and prices but have not yet reversed a sharp decline in property investment.

Many economists had expected economic growth would bottom out in the third quarter, with a modest improvement late this year and into early 2016 as additional stimulus measures gradually take effect.

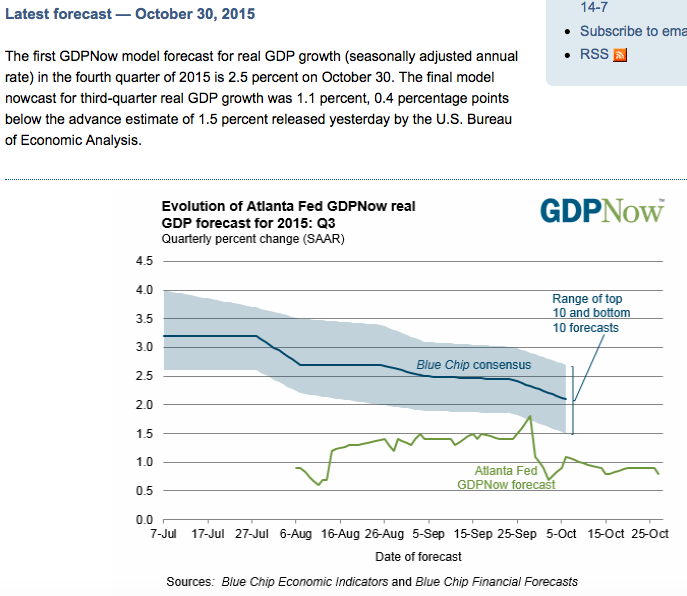
Starting out at 2.5% this quarter. We’ll see how it evolves as numbers are released:
er-11-2

Atlanta Fed, Oil inventory, Chemical Index, Mtg Purchase Apps

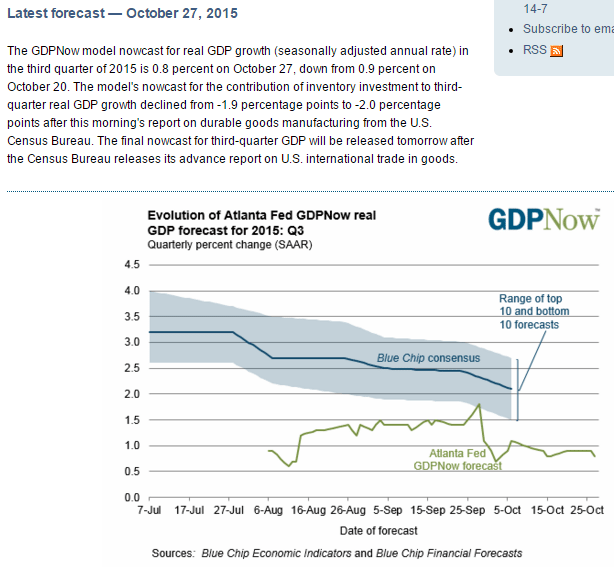
Down to .8:
er-10-28-1

Crude inventory that used to pile up from high cost shale production is coming down as drilling is way down and existing well output declines some 70% in its first two years. Meanwhile, US imports increase as domestic production decreases:

Crude stocks at the Cushing delivery hub fell by 748,000 barrels, data from the industry group, the American Petroleum Institute, showed late on Tuesday.

Iraq’s southern oil exports have reached 3.10 million barrels so far this month, indicating continued high output from the larger members of the Organization of the Petroleum Exporting Countries.

The premium for crude for delivery in 12 months’ time over that for December delivery, or contango, rose to its highest in six weeks, often a sign that investors expect supply to be far more plentiful in the near term. LCOc12

On the physical market, the contango in the North Sea derivatives market, which underpins Brent futures, rose to its highest since early September this week, reflecting how excess barrels are weighing on near-term prices.

“The global glut is still very much weighing on investors minds at the moment,” said Ben le Brun, a market analyst at OptionsXpress in Sydney.

“Some of the major corporates such as BP are talking about sluggish prices through 2016,” he added.

BP (BP.L) on Tuesday announced further spending cuts and more asset sales over the coming years to tackle an extended period of low oil prices and help pay for its $54 billion U.S. oil spill settlement.

September 2015 Chemical Activity Barometer Continues to Decline

The Chemical Activity Barometer (CAB) dropped 0.3 percent in October, following a upwardly revised 0.3 percent decline in September and 0.1 percent decline in August.

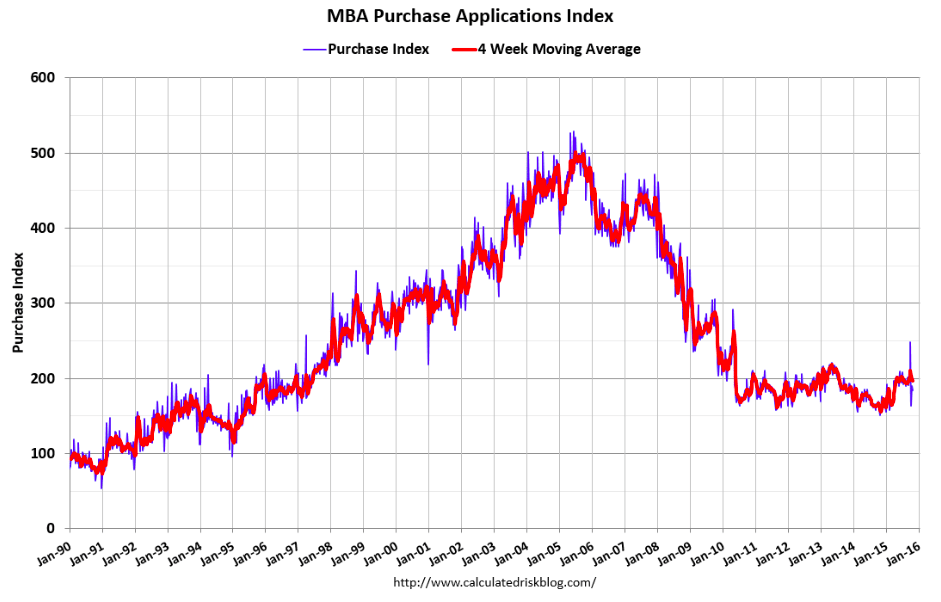
After a few wiggles due to govt changes purchase apps have settled back down and remain low and depressed:

The Refinance Index decreased 4 percent from the previous week. The seasonally adjusted Purchase Index decreased 3 percent from one week earlier. The unadjusted Purchase Index increased 7 percent compared with the previous week and was 23 percent higher than the same week one year ago.
er-10-28-2

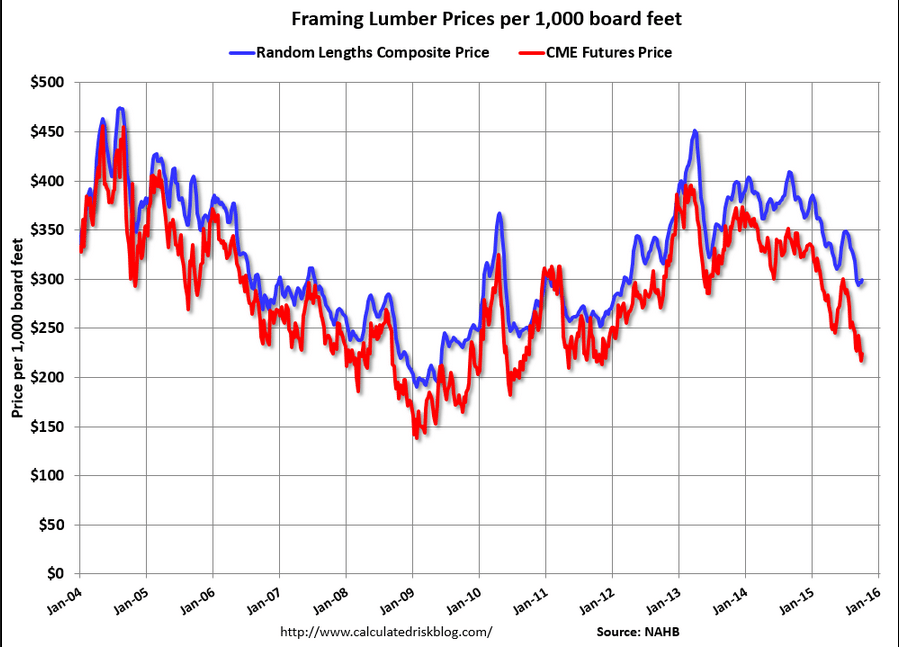
Lux GDP, Iowa, PC shipments, Lumber Prices, Oil Prices

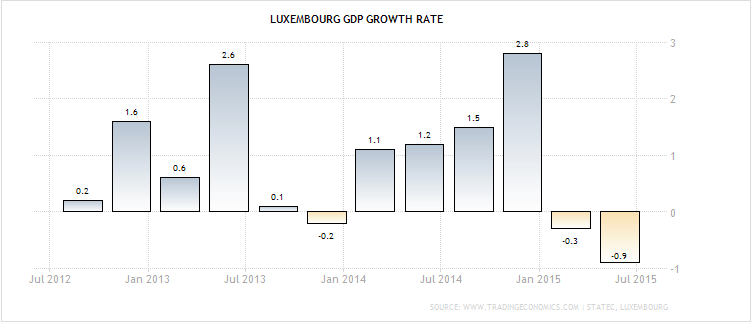
Even Luxembourg peaked after oil prices collapsed:
er-10-12-1

Ag slowdown imperils state revenue

By Donnelle Eller

Oct 12 (Des Moines Register) — Money coming into Iowa’s government coffers was flat the first quarter of this fiscal year, raising concern about how big an effect the slowing farm economy could have on the state budget.

State revenues — income tax paid by workers and corporations, along with sales tax paid at malls, restaurants and bars, among other sources — hit $1.77 billion since the start of the fiscal year July 1. It’s about even with revenue received this time last year.

But the state’s $7.17 billion budget is built around getting 6 percent more revenue this fiscal year than last year.

Gov. Terry Branstad and state budget and legislative leaders say they’re closely watching receipts but add that it is too soon to be alarmed.

PC Shipments Continue to Slump

By Anne Steele

Oct 8 (WSJ) — International Data Corp. said shipments fell a larger-than-anticipated 11% to 71 million units in the third quarter, while rival researcher Gartner Inc. said shipments totaled 73.7 million units, down 7.7% from a year ago. Both firms said Thursday that many users opted to upgrade existing PCs with the Windows launch rather than purchase new hardware. Gartner added that it expects the Windows 10 rollout to bolster holiday sales, while IDC said the new software and chips “may represent the most compelling reason we’ve had in years for consumers to upgrade their PCs.”

Remember when this was associated with housing?
;)
er-10-12-2
The Saudis did increase their discounts substantially for November delivery, which, all else equal, should bring price down fast until the change course. It took a few days for markets to react, but it may have started today:
er-10-12-3

Credit Check, Atlanta Fed, ECRI, Rail Traffic, Oil Comment

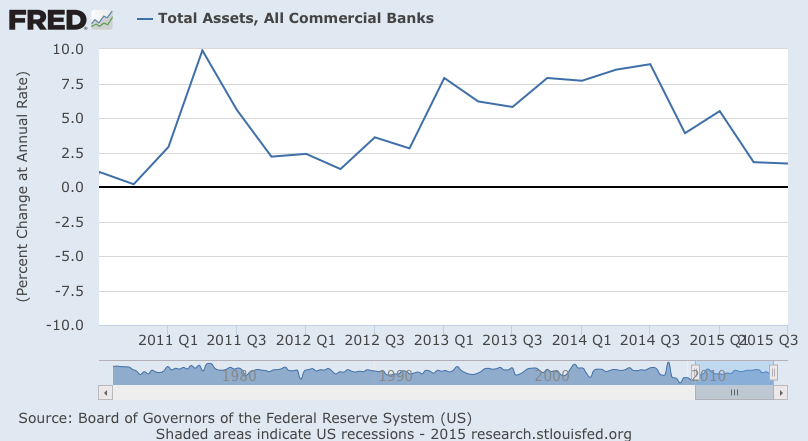
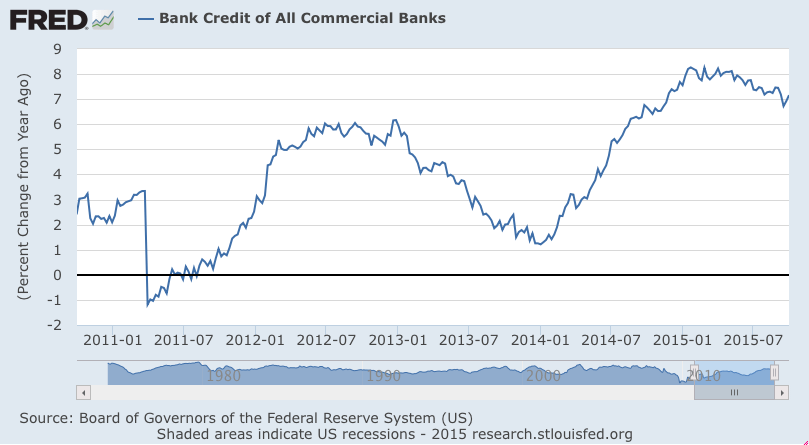
Growth rates still trending lower:

cc-10-10-1
cc-10-10-2
cc-10-10-3
cc-10-10-4
cc-10-10-5
Growth rate edging higher from very low levels:
cc-10-10-6
cc-10-10-7
cc-10-10-8

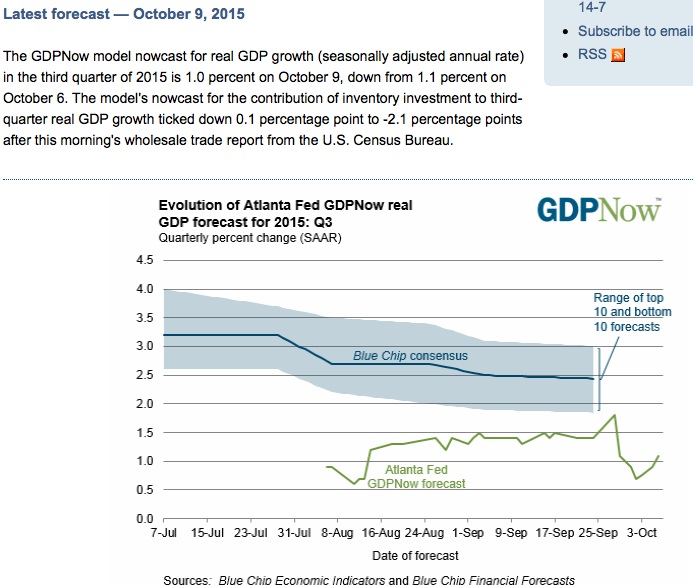
Back down to 1% for Q3:
cc-10-10-9
cc-10-10-10
cc-10-10-11

On October 5th Saudi price cuts were announced, as they increased discounts to various benchmark prices by substantial amounts. If the reports were accurate, the discount increases create a downward price spiral dynamic as previously described.

However, since that announcement oil prices have increased approximately 10% driven by buyers reacting to various news reports ranging from reduced US output to issues surrounding the mid east conflicts. And at the same time the rising oil prices led to a lower $US, higher prices for global equities, and term structures of interest rates moving higher in yield.

The risk here is that if the Saudi discounts are in fact in place, oil prices will reverse and head lower until the Saudis alter their pricing structure. And with traders and managers having previously gone ‘the wrong way’ the sell off in oil and equities will be all the more dramatic.

France PMI, Germany PMI, EU PMI, EU Retail Sales, UK service PMI, US Trade, ISM Non Manufacturing, Saudi Pricing

France : PMI Composite
er-9-4-1
Highlights
French private sector activity in August expanded at a significantly slower pace than indicated in the flash report according to the final PMI data for the month. At just 50.2, a 7-month low, the key composite output index was revised down an unusually large 1.1 points versus its preliminary reading to stand 1.3 points below its final July mark and close enough to 50 to signal a period of virtual stagnation in economic activity.

The flash service sector PMI was reduced by 1.2 points to 50.6, also a 7-month trough. As previously indicated, what growth there was reflected stronger new orders and rising backlogs although the growth rate of both hit multi-month lows. Certainly firms were not confident enough to add to headcount although, rather surprisingly, business expectations still climbed to their highest level since March 2012.

Meantime, another increase in input costs saw margins squeezed still further as service provider charges continued to fall.

The final PMI figures suggest that the French economy was really struggling last month. Total output was only flat in the April-June period and the survey data so far suggest little better this quarter.

Germany : PMI Composite
er-9-4-2
Highlights
August’s flash composite output index was revised up a full point to 55.0 in the final data for the month. The new level was 1.3 points above July’s final reading, a 5-month high and strong enough to indicate a solid performance by the economy in mid-quarter.

The adjustment to the composite output gauge came courtesy of the service sector for which the preliminary PMI was revised some 1.3 points firmer to 54.9, also its best reading in five months. New orders rose strongly, backlogs were up and employment posted its largest gain since February. Against this backdrop, business expectations for the year ahead climbed to a 4-month peak.

What little progress they continue to make will evaporate with a strong euro, which I see as inevitable given their trade surplus:

European Union : PMI Composite
er-9-4-3
Highlights
The final composite output index for August weighed in at 54.3, a couple of ticks stronger than its flash estimate and 0.4 points above its final July mark.

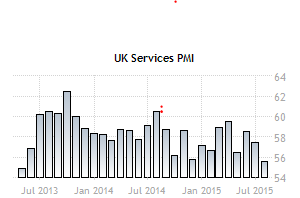
The flash services PMI was nudged just 0.1 points higher but, at 54.4, now matches June’s 4-year high. Increased output was supported by rising new orders and a sizeable increase in backlogs which, in turn, helped to ensure that employment growth remained respectably buoyant. Firms also became more optimistic about the economic outlook and business expectations for the year ahead climbed higher following July’s 7-month low. Meantime, inflation developments were mixed. Hence, although higher wages and salaries prompted another rise in input costs, margins were squeezed further as service provider charges declined for a remarkable forty-fifth consecutive month.

Regionally, the best performer in terms of the composite output measure was Ireland (59.7) ahead of Spain (58.8) and Italy (55.0 and a 53-month high). Germany (55.0) also had a good month but France (50.2 and a 7-month low) all but stagnated and remains a real problem for Eurozone economic growth.

The final PMI figures suggest that the Eurozone economy is on course for something close to a 0.4 percent quarterly growth rate in the current period, a slight improvement on the second quarter’s 0.3 percent rate. While this would be good news, faster rates of expansion will likely be needed if inflation is to meet the ECB’s near-2 percent target over the central bank’s 2-year policy horizon.

European Union : Retail Sales
er-9-4-4
Highlights
Retail sales were slightly weaker than expected in August but with July’s decline more than halved, annual growth of purchases still comfortably exceeded the market consensus. Volumes were 0.4 percent firmer on the month after a 0.2 percent drop in June for a workday adjusted yearly rise of 2.7 percent, up from 1.7 percent last time.

July’s monthly rebound was led by a 0.8 percent jump in purchases of auto fuel and without this, non-food sales were just 0.1 percent higher having only stagnated in June. Food recorded a 0.2 percent advance. As a result, overall sales in July were 0.3 percent above their average level in the second quarter when they also increased 0.3 percent.

Regionally the advance was dominated by a 1.4 percent monthly jump in Germany. Spain (0.6 percent) also made a positive contribution but France (minus 0.2 percent) saw its first decline since March. Elsewhere, there were solid gains in Estonia (2.5 percent), Malta and Portugal (both 1.1 percent) but Slovakia (minus 0.2 percent) struggled.

Growth of retail sales has slowed in recent months, in keeping with signs that consumer confidence may have peaked, at least for now. According to the latest EU Commission survey, household morale improved slightly in August but still registered its second weakest reading since January. Consumption may continue to rise over coming months but the signs are that its contribution to real GDP growth will be only limited.
er-9-4-5

I’ve been suggesting exports would slow more than what’s been reported so far, though year over year numbers are in decline. It may show up in revisions down the road:
er-9-4-6

er-9-4-7

International Trade
er-9-4-9

Highlights
The nation’s trade gap narrowed to a nearly as expected $41.9 billion in July following an upward revised gap of $45.2 billion in June (initially $43.8 billion). The improvement reflects a monthly rise of 0.4 percent in exports, which were led by autos, and a 1.1 percent contraction in imports that reflected a decline in pharmaceutical preparations and cell phones which helped offset a monthly rise in imports of oil where prices were higher in July.

Aside from autos, exports of industrial supplies, specifically nonmonetary gold, were strong in July while exports of capital goods also expanded. This helped offset a monthly decline in exports of civilian aircraft and consumer goods. Turning again to imports, other details include a rise in capital goods in what is the latest sign of life for business investment.

By nation, the gap with China widened slightly, to an unadjusted $31.6 billion in the month, while the gap with the EU widened more substantially to $15.2 billion, again unadjusted which makes month-to-month conclusions difficult. Gaps with Mexico and Canada both narrowed.

This report is another positive start to the quarter and will lift early third-quarter GDP estimates. But these will be cautious estimates as recent market turbulence pushes back conclusions and will make August’s trade data especially revealing.

Lower but still indicating ok expansion:
er-9-4-1

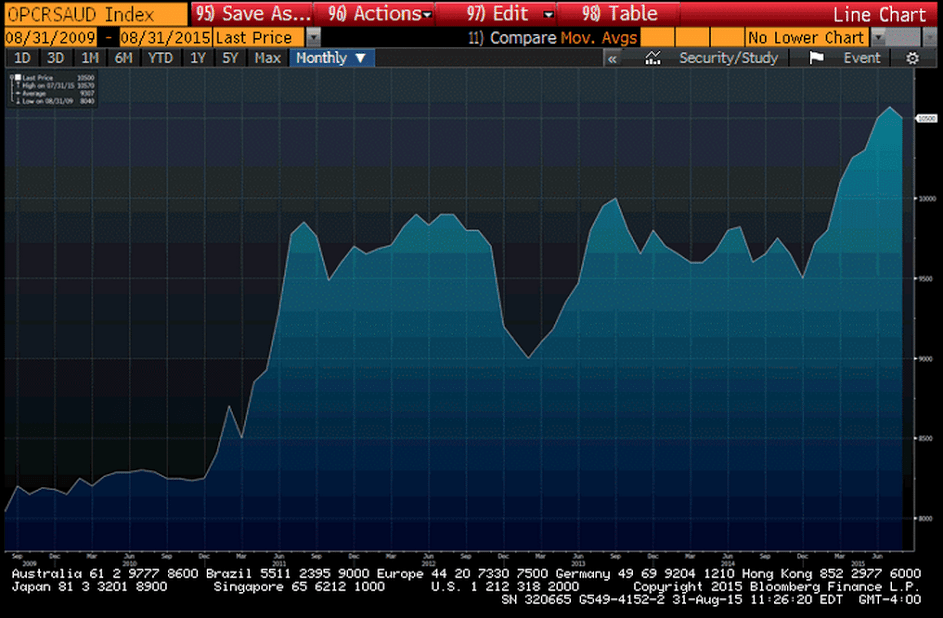
Saudi price setting adjustment:

Aramco Cuts All October Crude Pricing to U.S., Northwest Europe

By Anthony DiPaola

Sept 3 (Bloomberg) — Saudi Arabia, the world’s largest crude exporter, cut pricing for all October oil sales to the U.S. and Northwest Europe and reduced the premium on its main Light grade to Asia by 30 cents a barrel.

State-owned Saudi Arabian Oil Co. cut its official selling price for October sales to Asia of Arab Light crude to 10 cents a barrel more than the regional benchmark, the company said in an e-mailed statement. The discount for Medium grade crude for buyers in Asia widened 50 cents to $1.30 a barrel less than the benchmark.

Brent, a global oil benchmark, fell almost 50 percent last year as Saudi Arabia and other OPEC members chose to protect market share over cutting output to boost prices. Brent fell from over $100 a barrel in July 2014 to less than half that six months later. It traded at about $50 on Thursday.

The Organization of Petroleum Exporting Countries led by Saudi Arabia decided on June 5 to keep its production target unchanged to force higher-cost producers such as U.S. shale companies to cut back. The producer group has exceeded its target of 30 million barrels a day since May 2014.

Saudi Arabia reduced production in August to 10.5 million barrels a day, the first decline this year, according to data compiled by Bloomberg.

China, Saudi Output, Credit Check

This monetarist stuff doesn’t work:

China removes regulation on loan-to-deposit ratio

Aug 28 (Xinhua) — China’s top legislature on Saturday adopted an amendment to the Law on Commercial Banks, removing a 75-percent loan-to-deposit ratio stipulation. China has kept the 75-percent ratio since the law was enacted and put into effect in 1995. “The ratio was set to prevent overly quick expansion of commercial banks’ credit scale and control liquidity risk, but it has become improper for current needs,” said Shang Fulin, chairman of the China Banking Regulatory Commission. Such an outdated ratio is now hindering the already market-oriented banks to better support the real economy, Shang said.

And this kind of stuff will further slow things down:

Obama

By Carlos Tejada

Aug 30 (WSJ) — China Places Cap on Local Government Debt () Chinese lawmakers have placed a 16-trillion-yuan cap on local government debt. The Standing Committee of China’s National People’s Congress imposed a 600 billion yuan limit on the direct debt local governments are allowed to run up this year. That would be on top of 15.4 trillion yuan on debt owed by local governments as of the end of 2014. The caps don’t include indirect liabilities, which officials said totaled 8.6 trillion yuan. The latest government estimate put China’s local debt load at 17.9 trillion yuan as of the middle of 2013, up from negligible levels just six years before, including debt held indirectly.

Saudi output fell only a small amount, indicating that demand held reasonably steady at that level at their posted prices, and that they remain comfortably control of price:
er-9-1-1
Growth still slowing:
er-9-1-2
er-9-1-3
er-9-1-4
er-9-1-5

This one’s showing steady growth, though low still very low:
er-9-1-6
er-9-1-7
er-9-1-8

Personal Income and Outlays, Consumer Sentiment, Japan Household Spending, China Profits

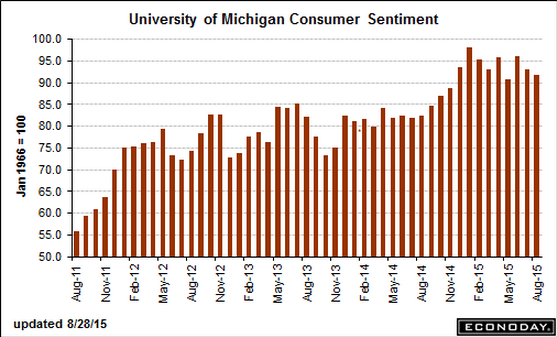
Everything pretty much as expected and the same, helped by vehicle sales which are both volatile and leveling off:

United States : Personal Income and Outlays
er-8-28-1
Highlights
There’s no hurry for a rate hike based on the July personal income and outlays report where inflation readings are very quiet. Core PCE prices rose only 0.1 percent in the month with the year-on-year rate moving backwards, not forwards, to a very quiet plus 1.2 percent. Total prices are also quiet, also at plus 0.1 percent for the monthly rate and at only plus 0.3 percent the yearly rate.

On the consumer, the data are very solid led by a 0.4 percent rise in income that includes a 0.5 percent rise in wages & salaries which is the largest since November last year. Other income details, led by transfer receipts, also gained in the month. Spending rose 0.3 percent led by a 1.1 gain in durables that’s tied to vehicle sales. The savings rate is also healthy, up 2 tenths to 4.9 percent.

The growth side of this report is very favorable and marks a good beginning for the third quarter. This at the same time that inflation pressures remain stubbornly dormant. And remember this report next month will reflect the August downturn in fuel prices. With the core PCE index out of the way, next week’s August employment report looks to be the last big question mark going into the September 17 FOMC.

First the recession then the tax hikes and sequesters ratchet down after tax income, and the growth rate is both low and never enough to ‘catch up’:
er-8-28-2
And over the last year you can see how the drop in oil capex after the price fell did the same thing though on a smaller scale, at least so far:
er-8-28-3

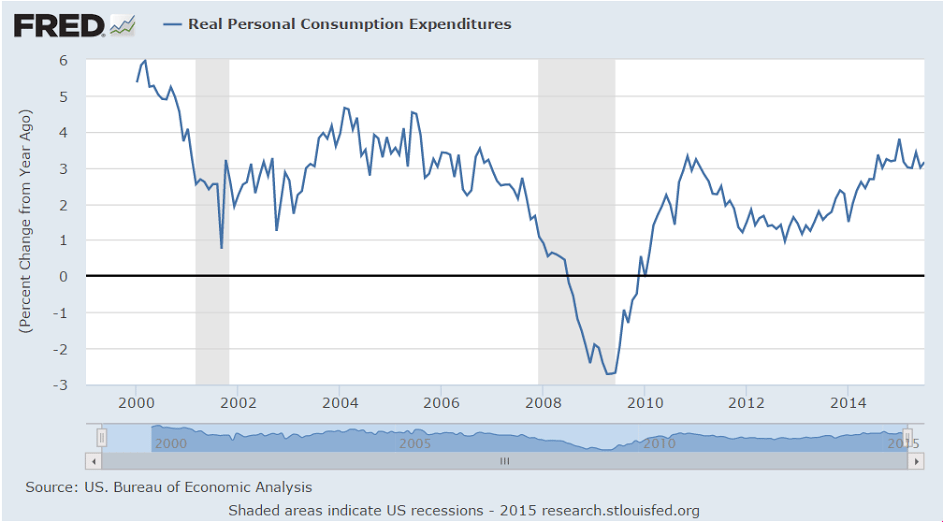
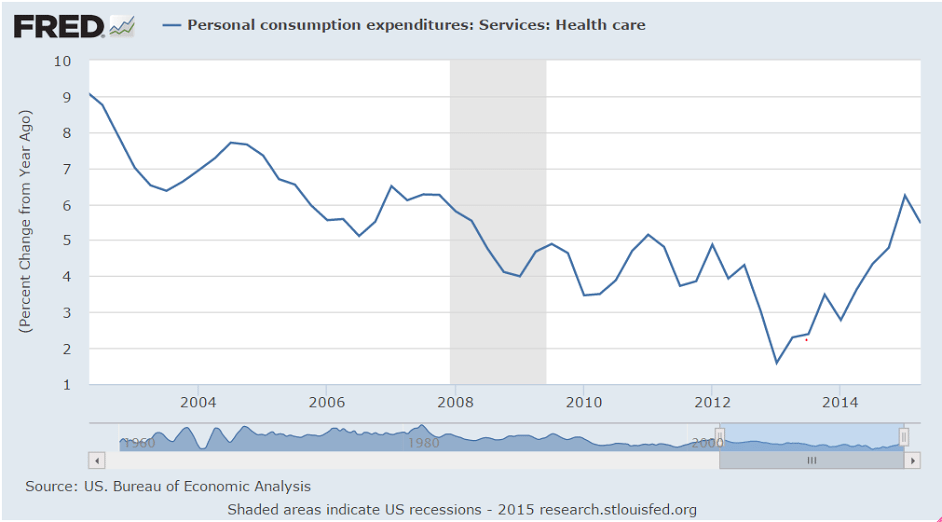
This is further decelerating from already weak numbers, not to forget health care premiums count as consumption expenditures, with a one time adjustment in progress as previously uninsured people become insured and begin paying premiums:
er-8-28-4

This is a quarterly number updated yesterday. The ‘one time’ increase may be cresting:
er-8-28-5
Starting to decelerate, even with low gas prices:
er-8-28-6

Japan : Household Spending
er-8-28-7

China’s industrial profits fell faster in July

Aug 28 (Xinhua) — Profits of China’s major industrial firms fell 2.9 percent year on year in July, sharply down from the 0.3-percent decline posted in June. The NBS attributed the poor performance to weak domestic demand and a continuous fall in factory gate prices, which have suffered 41 consecutive months of declines. Profits at industrial companies with annual revenues of more than 20 million yuan (about 3.1 million U.S. dollars) totaled 471.6 billion yuan in July. During the first seven months, industrial profits dropped one percent from a year earlier, compared with a fall of 0.7 percent registered in the first half of the year, the NBS said.