China, Germany, Productivity, NFIB Index, Redbook, Wholesale Trade


A few thoughts:

China’s US Tsy holding had been falling perhaps because they were selling $ to buy Yuan to keep it within in the prior band.

Pretty much all exporting nation’s currencies have already weakened vs the $, including the Yen and Euro, so this is a bit of a ‘catch up.’

In a weakening global economy from a lack of demand (sales) and ‘western educated, monetarist, export led growth’ kids now in charge globally, the path of least resistance is a global race to the bottom to be ‘competitive’. And the alternative to currency depreciation, domestic wage cuts, tends to be less politically attractive, as the EU continues to demonstrate.

The tool for currency depreciation is intervention in the FX markets, as China just did, after they tried ‘monetary easing’ which failed, of course. Japan did it via giving the nod to their pension funds and insurance companies to buy unswapped FX denominated securities, after they tried ‘monetary easing’ as well.

The Euro zone did it by frightening China and other CB’s and global and domestic portfolio managers into selling their Euro reserves, by playing on their inflationary fears of ‘monetary easing’-negative rates and QE- they learned in school.

The US used only ‘monetary easing’ and not any form of direct intervention, and so the $ remains strong vs all the rest.

I expect the Euro to now move ever higher until its trade surplus goes away, as global fears of an inflationary currency collapse are reversed and Euro buying resumes as part of global export strategies to export to the Euro zone. And, like the US, the EU won’t use direct intervention, just more ‘monetary easing’.

Ironically, ‘monetary easing’ is in fact ‘fiscal tightening’ as, with govts net payers of interest, it works to remove interest income from the global economy. So the more they do the worse it gets.

‘No matter how much I cut off it’s still too short’ said the hairdresser to the client…

The devaluations shift income from workers who see their purchasing power go down, to exporters who see their margins increase.
To the extent exporters then reduce prices and those price reductions increase their volume of exports, output increases, as does domestic employment. But if wages then go up, the ‘competitiveness’ gained by the devaluation is lost, etc., so that’s not meant to happen.

Also, the additional export volumes are likewise reductions in exports of other nations, who, having been educated at the same elite schools, respond with devaluations of their own, etc. etc. in a global ‘race to the bottom’ for real wages. Hence China letting their currency depreciate rather than spend their $ reserves supporting it.

The elite schools they all went to contrive models that show you can leave national deficit spending at 0, and use ‘monetary policy’ to drive investment and net exports that ‘offset’ domestic savings. It doesn’t work, of course, but they all believe it and keep at it even as it all falls apart around them.

But as long as the US and EU don’t have use of the tools for currency depreciation, the rest of the world can increase it’s exports to these regions via currency depreciation to lower their $ and Euro export prices, all of which is a contractionary/deflationary bias for the US and EU.

Of further irony is that the ‘right’ policy response for the US and EU would be a fiscal adjustment -tax cut or spending increase- large enough to sustain high enough levels of domestic spending for full employment. Unfortunately, that’s not what they learned in school…

The drop in expectations is ominous, particularly as the euro firms:

Germany : ZEW Survey
er-8-11-1

Highlights
ZEW’s August survey was mixed with a slightly more optimistic assessment of the current state of the economy contrasting with a fifth consecutive decline in expectations.

The current conditions gauge was up 1.8 points at 65.7, a 3-month high. However, expectations dipped a further 4.7 points to 25.0, their lowest mark since November 2014.


The drop in unit labor costs and downward revision of the prior increase gives the Fed cause to hold off on rate hike aspirations:

United States : Productivity and Costs
er-8-11-2

Highlights
A bounce back for output gave first-quarter productivity a lift, up a quarter-to-quarter 1.3 percent vs a revised decline of 1.1 percent in the first quarter. The bounce in output also held down unit labor costs which rose 0.5 percent vs 2.3 percent in the first quarter.

Output in the second quarter rose 2.8 percent vs a depressed 0.5 percent in the first quarter. Compensation rose 1.8 percent, up from 1.1 percent in the first quarter, while hours worked were little changed, up 1.5 percent vs 1.6 in the first quarter.

Looking at year-on-year rates, growth in productivity is very slight at only plus 0.3 percent while costs do show some pressure, up 2.1 percent in a reading, along with the rise in compensation, that will be welcome by Federal Reserve officials who are hoping that gains in wages will help offset weakness in commodity costs and help give inflation a needed boost.


Up a touch but the trend remains negative:

er-8-11-3


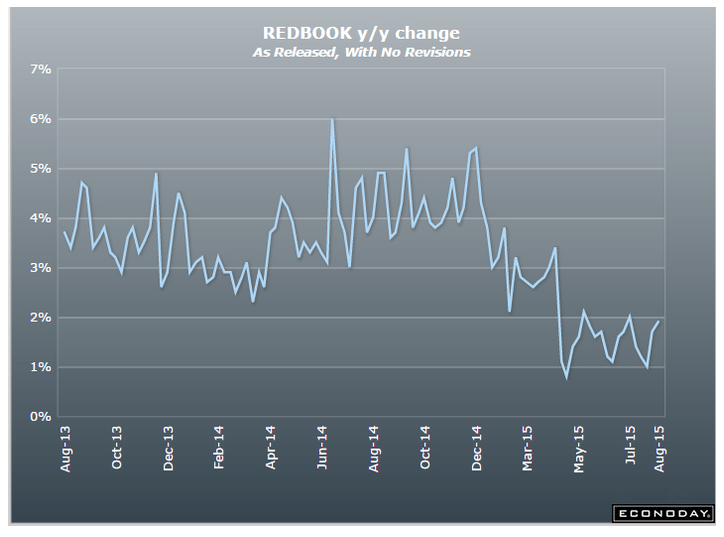
Redbook retail sales report still bumping along the bottom:

er-8-11-4


A decline in sales growth and rise in inventories is yet another negative:

United States : Wholesale Trade
er-8-11-5

Highlights
A build in auto inventories as well as for machinery drove wholesale inventories up a much higher-than-expected 0.9 percent in June. Sales at the wholesale level rose only 0.1 percent in the month, in turn driving the stock-to-sales ratio up 1 notch to a less-than-lean 1.30. This ratio was at 1.19 in June last year.

Fed Labor Indicator, NY Fed Consumer Expectations, Lumber Prices, China Trade

This Fed indicator, whatever it means, just went down some:

Labor Market Conditions Index
er-8-10-2

Highlights
If the Fed relied exclusively on its labor market conditions index, no one would be in much hurry for the rate hike. The index for July came in slightly below expectations at 1.1 vs a revised 1.4 in June. The index, based on a broad set of 19 components, has been hovering near zero all year, well off its 5.4 average of last year. Unemployment may be down but hiring has been soft and the 2015 trend for this index is the weakest of the recovery.
er-8-10-1

Remember when this was taken as an indication of falling demand for housing?

er-8-10-6

Another indication of a weaker global economy, and a good reason for China to allocate more reserves to Euro:

China : Merchandise Trade Balance
er-8-10-5

Highlights
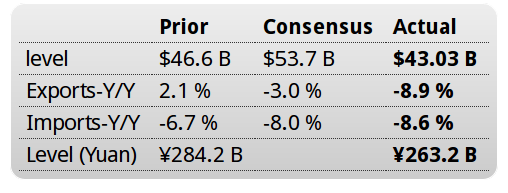
China’s trade figures shocked analysts. July’s unadjusted merchandise trade surplus was $43.0 billion, down from $45.7 billion in June. Exports plunged 8.3 percent against expectations of a 3.0 percent drop. Imports sank 8.1 percent against expectations of a 8 percent drop. The year to date trade balance was $305.2 billion compared with $212.9 billion in the same period a year ago. For the seven months through July, exports were down 0.8 percent on the year while imports dropped 14.6 percent. On a seasonally adjusted basis, exports slid 3.4 percent on the month after increasing 1.5 percent in June while imports declined 3.8 percent after jumping 6.9 percent in June. On the year, seasonally adjusted exports dropped 7.9 percent while imports were 8.4 percent lower.

China’s top government body, the State Council, said last month that it would give high priority to the nation’s trade sector, providing tax breaks and cutting red tape while reducing import duties. The government has also accelerated a range of infrastructure projects to boost demand at home. Meanwhile, the central bank has cut interest rates four times since November in an effort to help struggling domestic companies.

Adding to the problems for exporters is the relatively strong Chinese currency, which has held steady against a buoyant dollar. That has carried the yuan more than 10% higher against the Euro, providing a drag on exports to some key European markets.

Challenger Layoffs, Claims, Trade Comments, Saudi Price Setting, Construction Detail

Not to worry, just the army announcing layoffs:

Challenger Job-Cut Report
er-8-6-1

Highlights
A major Army cutback made for an outsized 105,696 layoff count in July. The Army said it is cutting 57,000 jobs over the next two years (note that Challenger counts layoffs at the time of announcement, not when layoffs actually occur). Heavy layoffs, at 18,891, were also announced in computer & electronics.

These remain at historically low levels:

US weekly jobless claims total 270,000 vs 273,000 estimate

By Robert Galbraith

August 6 (Reuters)

U.S. Trade Gap Expands 7% in June

By Josh Mitchell

July 1 (Wall Street Journal)

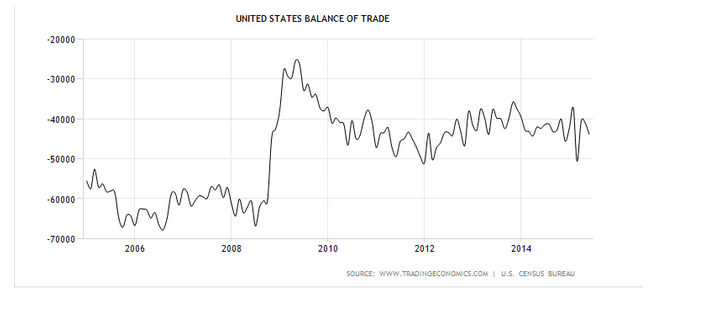
The U.S. trade gap with other countries grew 7% in June to $43.8 billion, as imports climbed steadily while exports continued to slip. The U.S. trade gap with the European Union reached an all-time high in June as imports from Europe rose. The trade gap with Mexico also set a record. The U.S. trade deficit with China grew 9.8% in the first six months of 2015 compared with the same period last year,Wednesday’s report showed. The deficit with Japan grew 4.1%. The rise in U.S. imports was due to higher demand for consumer goods, particularly pharmaceutical items, and industrial supplies, including crude oil. Auto imports were the highest on record.

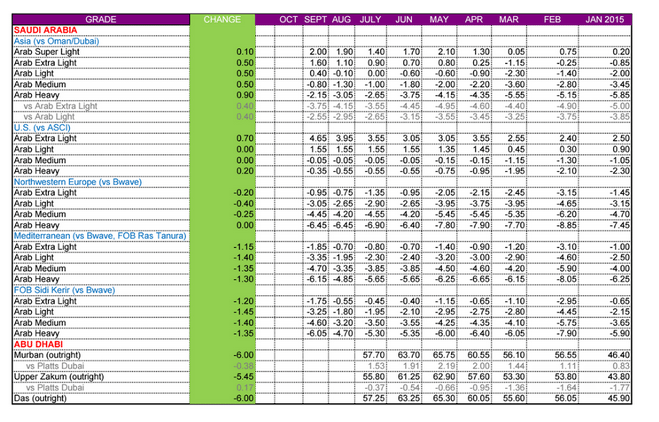
This is how the Saudis set price via altering their posted spreads to various benchmarks:

er-8-6-2


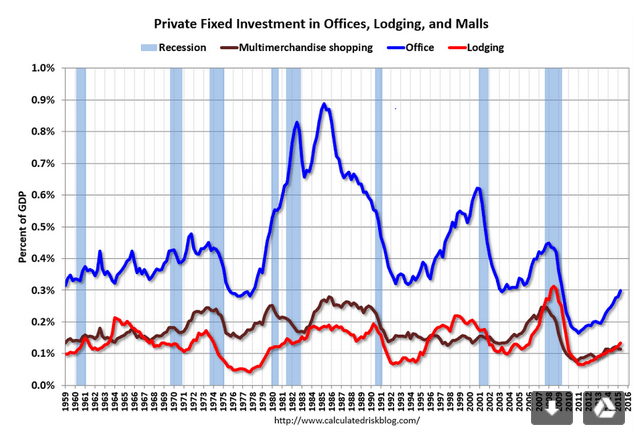
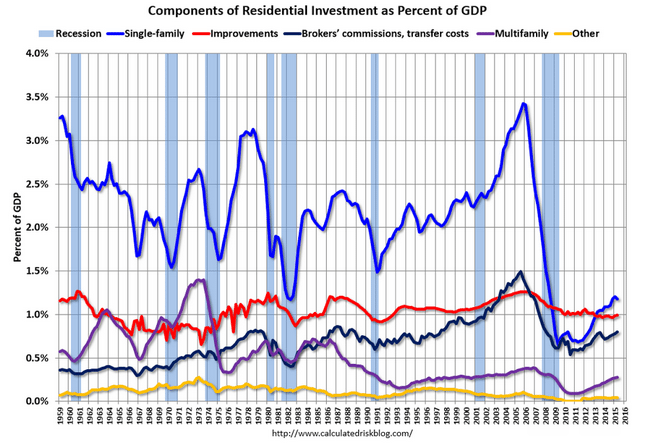
Historically low levels and still growing at lower rates than prior cycles, so adding a lot less to GDP.
My narrative is that it’s all about a lack of income from a shortfall of private and/or public deficit spending:

er-8-6-3

er-8-6-4

ISM, Employment, Trade

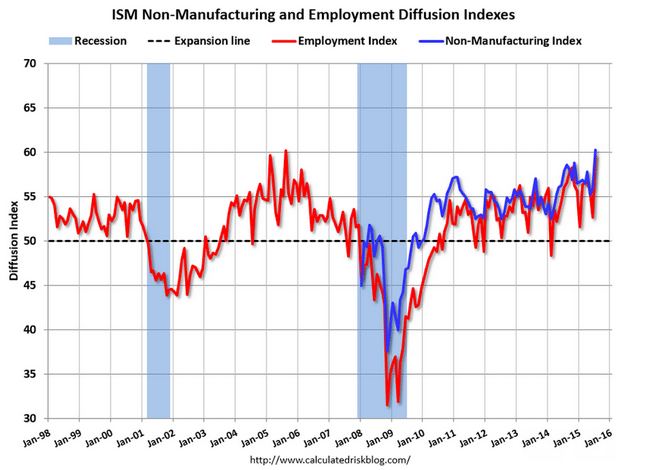
Nice jump up here to 2005 highs. First unambiguous positive indicator I’ve seen in quite a while.

United States ISM Non Manufacturing PMI

July 5 (Trading Economics)

The ISM Non-manufacturing PMI index registered 60.3 percent in July, 4.3 percentage points higher than the June reading of 56 percent. It is the highest reading since August of 2005 as 15 out of 17 services industries reported growth. Non Manufacturing PMI in the United States averaged 54.15 percent from 1997 until 2015, reaching an all time high of 62 percent in August of 1997 and a record low of 37.60 percent in November of 2008. Non Manufacturing PMI in the United States is reported by the Institute for Supply Management.

er-8-5-11

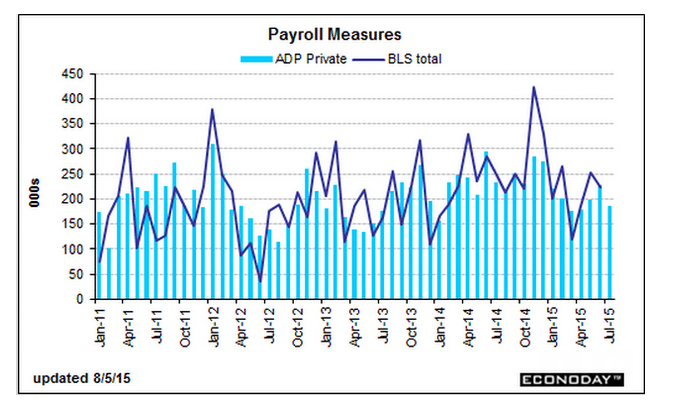
Another payroll chart:

er-8-5-12

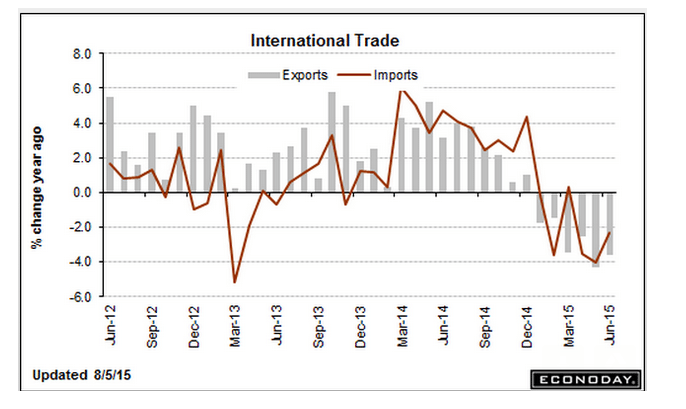
Another trade chart:
er-8-5-13

Mortgage Purchase Apps, EU Retail Sales, Payroll Tax, ADP, Trade, Equity Comment

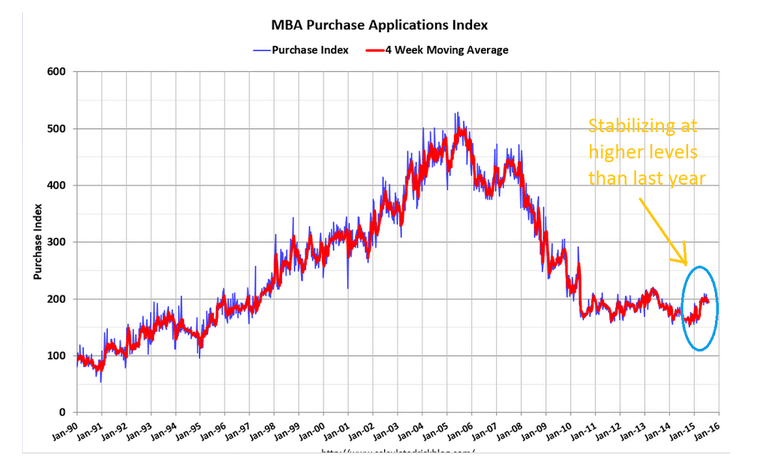
While still historically very low, purchase apps are now way up over last year’s particularly depressed levels. Some are replacing all cash buyers, but the increase is also in line with increased existing home sales.

While new home sales were soft, turnover of existing homes has been increasing, and while not directly increasing GDP, existing home sales are generally associated with purchases of furniture, appliances, and other home improvements, and of course real estate commissions.

MBA Mortgage Applications
er-8-5-1

Highlights
A drop in rates helped boost mortgage activity in the July 31 week both for home purchases, up 3.0 percent in the week, and for refinancing which rose 6.0 percent. The strength in purchase applications, which are up 23 percent vs this time last year, is a positive indication for home sales. The average 30-year fixed mortgage for conforming loans ($417,000 or less) fell 4 basis points in the week to 4.13 percent.

er-8-5-2

EU retail sales

European Union : Retail Sales
er-8-5-3

Highlights
Retail sales were surprisingly weak in June. A 0.6 percent monthly fall was the first decline since March and followed a slightly smaller revised 0.1 percent rise in May. Annual workday adjusted growth of purchases was 1.2 percent, down from 2.6 percent in both mid-quarter and April.

June’s setback was primarily attributable to a 0.8 percent monthly drop in sales of food, drink and tobacco. Non-food products, excluding auto fuel, were off only 0.2 percent, although even this was enough to wipe out May’s entire rise. Fuel purchases were flat on the month after a 0.2 percent dip last time.

Regionally, headline weakness was dominated by a 2.3 percent monthly slump in Germany although Spain (minus 0.4 percent) also struggled. More promisingly, France (0.1 percent) saw sales increase for a third consecutive period and there were decent gains in Austria (1.3 percent), Belgium, Latvia and Lithuania (all 0.8 percent) and Estonia (0.7 percent).

The June data make for a second quarter increase in Eurozone retail sales of only 0.3 percent, less than a third of the rate achieved in the previous period and just half of the fourth quarter pace. This does not bode well for real GDP growth. Moreover, the EU Commission’s economic sentiment survey found consumer sentiment falling in July so it may be that the third quarter got off to a less than robust start too. That said, Greek developments are clearly having some impact and a more concrete resolution of the crisis there might be enough to get households happy to spend again.

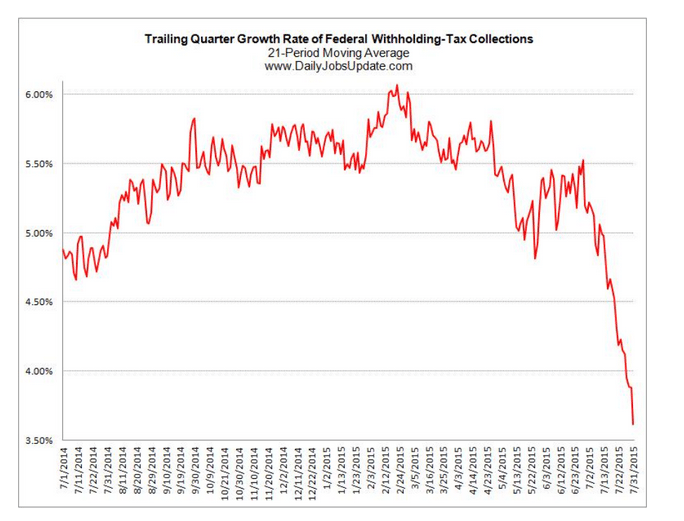
Big drop in Federal withholding:

er-8-5-4

Lower than expected, and June revised down a bit as well, all in line with many recent surveys:

ADP Employment Report
er-8-5-5

Mark Zandi, chief economist of Moody’s Analytics, said, “Job growth is strong, but it has moderated since the beginning of the year. Layoffs in the energy industry and weaker job gains in manufacturing are behind the slowdown. Nonetheless, even at this slower pace of growth, the labor market is fast approaching full employment.”
Read more at Calculated Risk Blog

About as expected with last month’s revision:

United States : International Trade
er-8-5-6

Seems the drop in oil prices has been offset by non oil imports, as the trade deficit is looking somewhat wider:

er-8-5-7

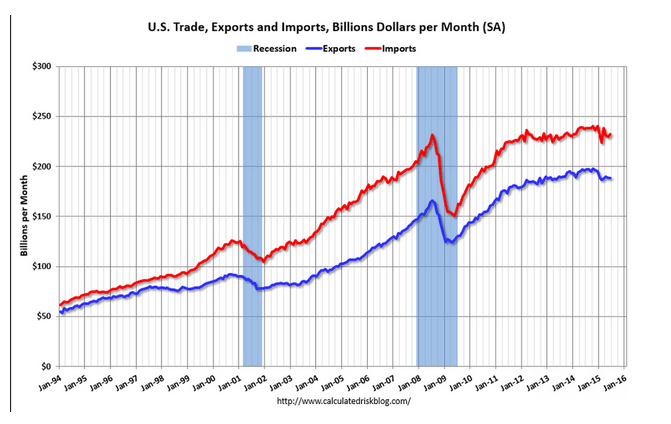
Both exports and imports are down which indicates a weakening global economy:

er-8-5-8

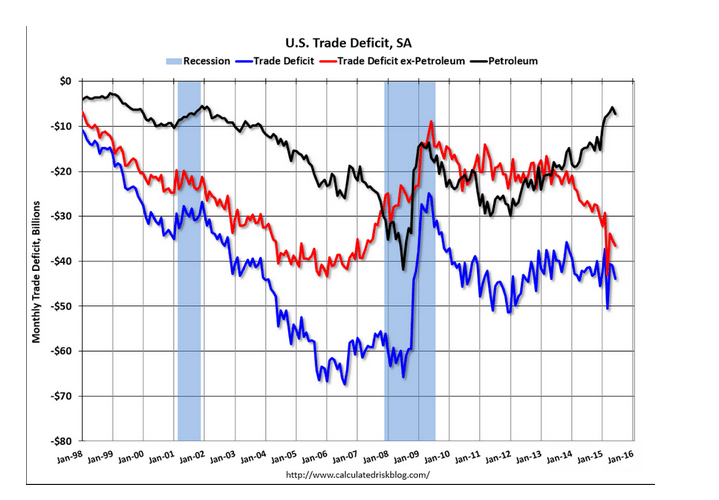
The chart shows the trend of the non petroleum deficit has resumed it’s increase:

The blue line is the total deficit, and the black line is the petroleum deficit, and the red line is the trade deficit ex-petroleum products (wild swings earlier this year were due to West Coast port slowdown).
Read more at Calculated Risk Blog
er-8-5-9


Didn’t know we exported any consumer goods!
;)

Exports (Exhibits 3, 6, and 7) Exports of goods decreased $0.2 billion to $127.6 billion in June. Exports of goods on a Census basis decreased $0.5 billion. • Capital goods decreased $0.8 billion. o Telecommunications equipment decreased $0.3 billion. • Industrial supplies and materials decreased $0.6 billion. o Finished metal shapes decreased $0.3 billion. Consumer goods increased $0.8 billion.

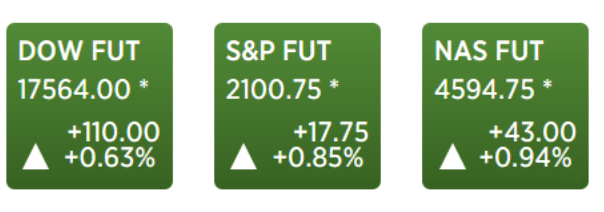
Stocks up because jobs were weak and a fed spokesman thought the economy was too weak for a rate hike. ;)

Futures jump on ADP miss, Powell comments

By Jenny Cosgrave

August 5 (CNBC)

er-8-5-10

LA Port Traffic, Greek Banks, Recession Without Financial Crisis

Another weak export report. No mention of the drop in oil prices reduced foreign incomes.

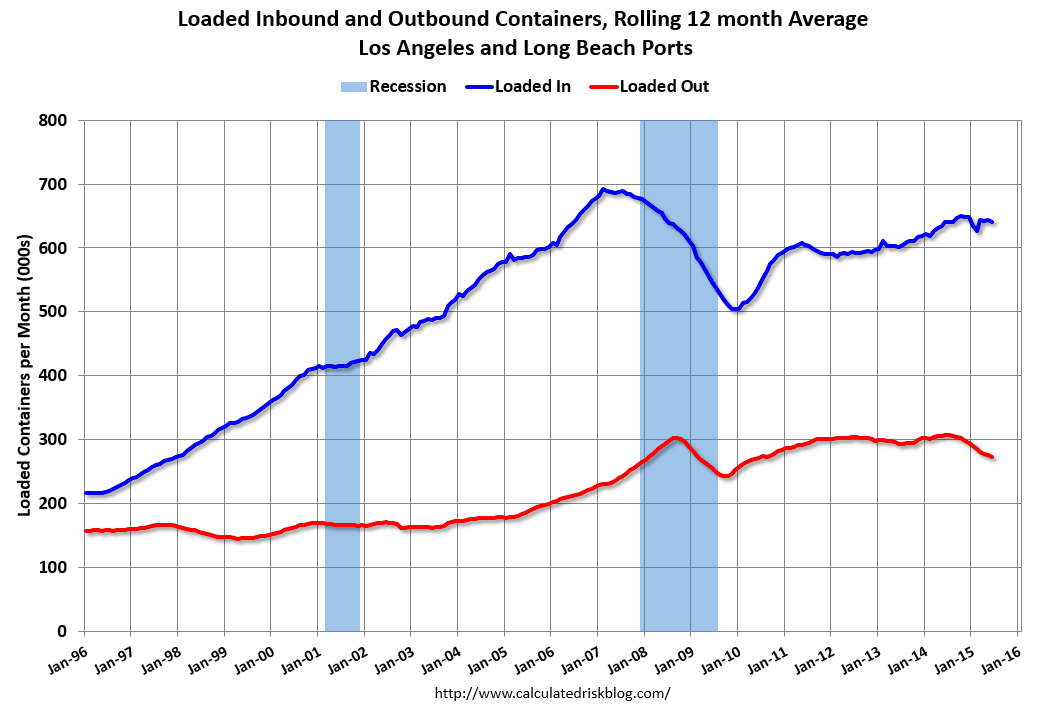
LA area Port Traffic: Weakness in June

by Bill McBride on 7/20/2015 09:57:00 AM

Note: There were some large swings in LA area port traffic earlier this year due to labor issues that were settled on February 21st. Port traffic surged in March as the waiting ships were unloaded (the trade deficit increased in March too), and port traffic declined in April. Perhaps traffic in June is closer to normal.

Container traffic gives us an idea about the volume of goods being exported and imported – and usually some hints about the trade report since LA area ports handle about 40% of the nation’s container port traffic.

The following graphs are for inbound and outbound traffic at the ports of Los Angeles and Long Beach in TEUs (TEUs: 20-foot equivalent units or 20-foot-long cargo container).

To remove the strong seasonal component for inbound traffic, the first graph shows the rolling 12 month average.

er 7-20-1

On a rolling 12 month basis, inbound traffic was down 0.4% compared to the rolling 12 months ending in May. Outbound traffic was down 0.9% compared to 12 months ending in May.

The recent downturn in exports might be due to the strong dollar and weakness in China.

Read more at Calculated Risk Blog

Reads like they still don’t have a clue about how banking works:

The Greek government ordered banks to open on Monday, three weeks after they were shut down to prevent the system collapsing under a flood of withdrawals,

That doesn’t cause collapse. Depositors might have to wait for their Euro. That’s all. No reason for the govt. to close the banks. Reads to me like the govt. thinks that Euro needed to run the economy, pay taxes, etc. would leave the country, or something like that. Makes no sense.

As Prime Minister Alexis Tsipras looked to the start of new bailout talks next week.

The first action of the new cabinet was to sign off on a decree to reopen banks on Monday with slightly more flexible withdrawal limits that allow a maximum of 420 euros a week in place of the strict limit of 60 euros a day currently in place.

But restrictions on transfers abroad and other capital controls remain in place.

It’s up to the banks to set their limits based on how much liquidity they have available.

Also:

Three week shutdown of Greece banks cost the economy an estimated €3B, not counting lost tourism revenue – press – Athens Chamber of Commerce and Industry (EBEA) says some 4,500 containers with raw materials and finished products are blocked at customs.

Additionally, €6B in business transactions were frozen by the bank shutdown.- Retailers lost about €600M in business, with apparel taking the main blow. Exporters lost €240M.

Source: TradeTheNews.com

Yes, negative growth and recession sometimes happens without a domestic financial
crisis, and without any financial crisis globally as well.

Lots of things can cause deficit spending- both non government (private sector) and government together- from being insufficient to offset agents desiring to spend less than their incomes.

Sometimes it’s a sudden obstruction to lending and sometimes it’s not.

Sometimes the agents spending more than their incomes just fade away. For a government allowing the deficit to get too small is a political choice, sometimes well informed but most often misguided.

For the private sector it could be insufficient income, or any reason it simply doesn’t want to borrow to spend or spend from savings.

And the private sector tends to be pro cyclical. That is, should GDP growth decline, private sector borrowing to spend tends to taper as well, as credit worthiness deteriorates, causing the slowdown to get worse. This downward process continues until some agent starts spending more than its income, which historically is government, as tax revenues fall and transfer payments increase with rising unemployment from the downward spiral.

So looks to me like it was the oil capex that was keeping up with the demand leakages, and when that collapsed as prices fell the demand leakages got the upper hand. And so far no sign of anything else stepping up its spending enough to move the GDP needle.

Atlanta Fed, 2004 vs 2015 US data, EU trade

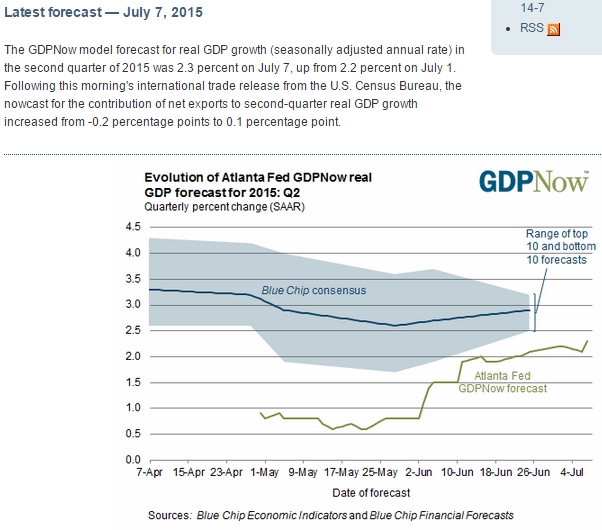
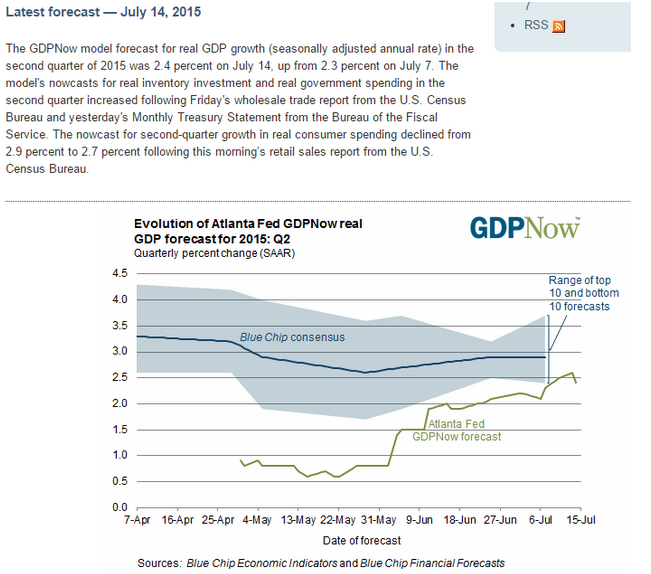
The Atlanta Fed forecast as of July 14 is was +2.3% annualized for Q2, which is far below initial estimates of most professional forecasters, and below their current forecasts as well, and likely to be lowered further due to recent data.

The first government estimate for Q2 GDP will be released on July 30th. June trade numbers will not be released until August, and it looks to me like May was a zig that could zag in June and could cause a downward revision to Q2 GDP.

Inventories also look high to me which means a correction would further reduce Q2 GDP, and the low productivity numbers and decelerating employment reports tell me business is overstaffed for the current pace of sales and likely to adjust accordingly as well.


er 7-16-7

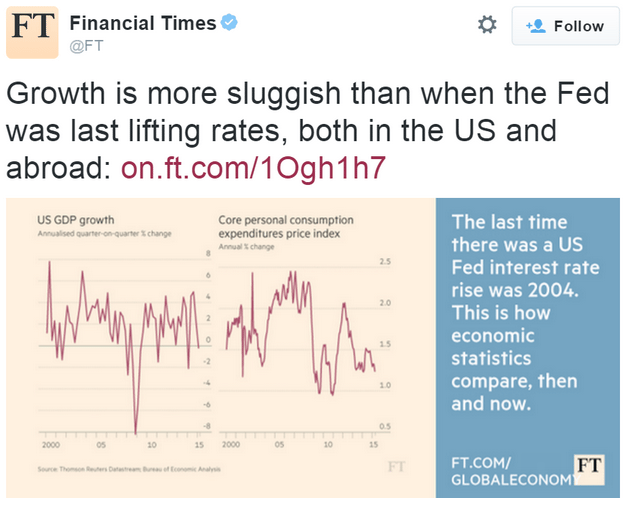
The economy before the 2004 rate hikes vs now:


er 7-16-8

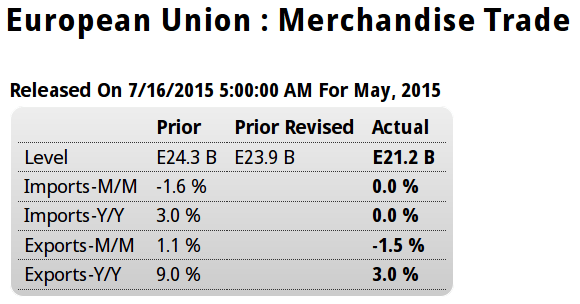
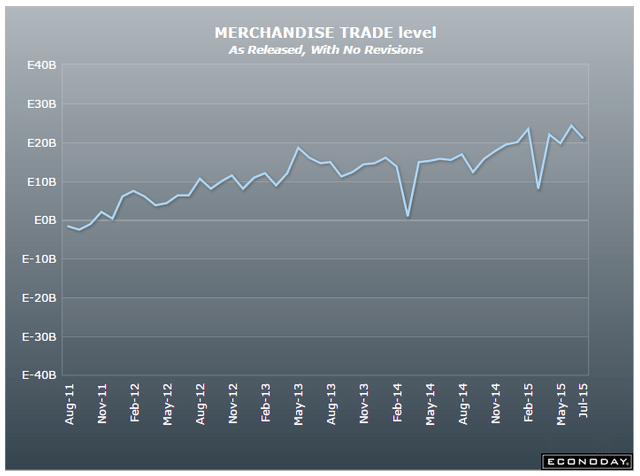
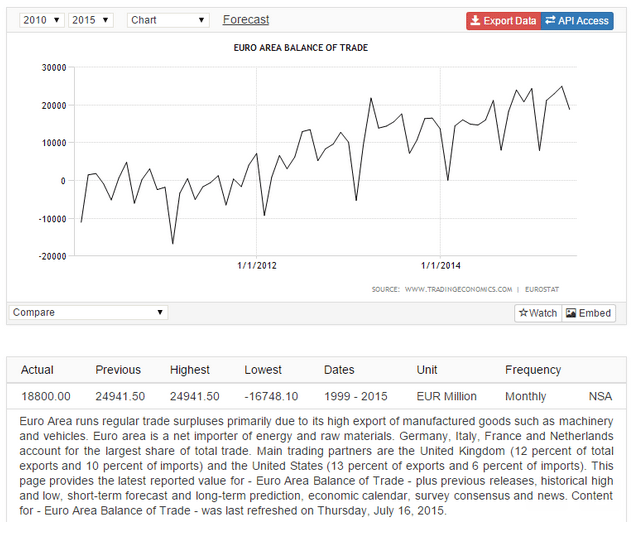
Another strong surplus:


er 7-16-9

Highlights

The seasonally adjusted trade balance returned another healthy surplus in May. At E21.2 billion the black ink was short of April’s slightly downwardly revised E23.9 billion but still above the E20 billion mark for the fourth time so far this year.
The deterioration in the headline reflected a 1.5 percent monthly fall in exports, their first drop since January. Imports were flat. Annual growth of the former was 3.0 percent and of the latter 0.0 percent.

At E2.6 billion the average surplus in April/May was 6.4 percent above its first quarter mean which points to a probable small positive contribution from total net exports to second quarter real GDP growth. Quite apart from the weakness of the oil market, the current soft level of the euro should help to ensure continued strong trade data over the rest of 2015.

er 7-16-10

This is just the euro area, also in surplus:


er 7-16-11

Italy in surplus as well:


er 7-16-12

Highlights

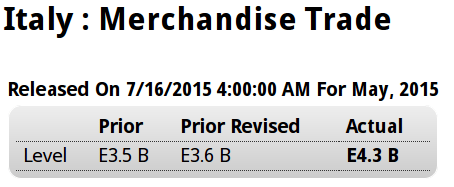
The seasonally adjusted trade balance was in a E4.3 billion surplus in May following a marginally larger revised E3.6 billion excess in April.

The headline gain was mainly attributable to stronger exports which rose 1.5 percent from April, their third increase in the last four months. Much of this came courtesy of a 28.4 percent jump in the energy sector excluding which exports were up only 0.6 percent. Consumer goods (2.2 percent) had a good period but intermediates were only flat and capital goods were weak (minus 0.3 percent). Compared with May 2015 exports were 2.0 percent stronger.

Imports fell a monthly 0.3 percent, largely due to a 5.3 percent slump in energy although capital goods also struggled (minus 0.9 percent). Annual import growth was 0.5 percent.

China trade, Greece comment

More reason to suspect US exports will disappoint and US imports will exceed expectations:
er-7-13-1

Highlights
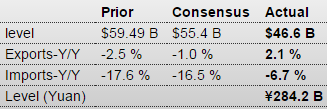
China’s June merchandise trade surplus was $46.6 billion against expectations of a $55.3 billion surplus. In Yuan terms, exports were up 2.1 percent on the year while imports tumbled 6.7 percent. The first half of 2015 trade balance was CNY1.61 trillion or $263.9 billion. On a seasonally adjusted basis, exports were up 1.1 percent on the year after sliding 1.4 percent in May. Seasonally adjusted imports dropped 9.9 percent after a 14.1 percent plunge.

According to Chinese Customs, expectations are for export growth to rebound in the second half of the year. It noted that the Greek crisis will have some impact on China’s trade – it is hard to quantify just how big an impact there will be.
China sees exports increase 2% in June, imports decline

By Chen Jia and Zhong Nan

July 13 (ChinaDaily)
er-7-13-2
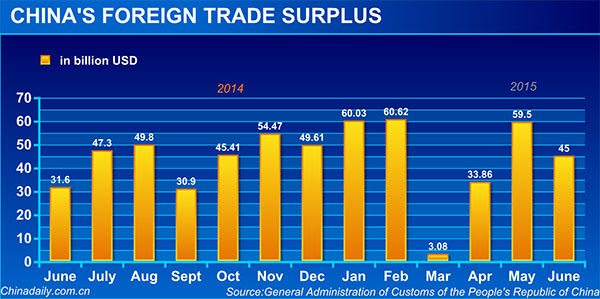
China’s export rose by 2.1 percent year-on-year to 1.17 trillion yuan($188.5 billion) in June, a better-than-expected increase after the 6.4 percent decline in April, according to data from Customs released on Monday.

However, the import figure fell by by 6.7 percent to 890.67 billion yuan last month, leading to an accelerated growth of monthly trade surplus to 45 percent year-on-year.
In the first six months, the country’s total foreign trade value was 11.53 trillion yuan, down by 6.9 percent from a year earlier. Exports increased by 0.9 percent to 6.57 trillion yuan while imports decreased by 15.5 percent to 4.96 trillion yuan.
Trade surplus in the first half rose by 1.5 times from a year earlier to 1.61 trillion yuan, the data revealed.

The structure of trade modes continued to improve when exports of general trade showed marked growth, and strong momentum was spotted in exports to emerging markets and some countries along the “Belt and Road”, said Huang Songping, a spokesman from the Customs department, at a press conference.

China’s bilateral trade with the European Union declined by 6.8 percent during the January-to-June period to 1.67 trillion yuan and trade with Japan fell by 10.6 percent to 832.02 billion yuan, said Hong.

“The Greek debt crisis is likely to influence China’s export, but it is difficult to predict the exact effects,” added Huang.

Varoufakis’ interview in the New Statesman:

Exclusive: Yanis Varoufakis opens up about his five month battle to save Greece

“He said he spent the past month warning the Greek cabinet that the ECB would close Greece’s banks to force a deal. When they did, he was prepared to do three things: issue euro-denominated IOUs; apply a “haircut” to the bonds Greek issued to the ECB in 2012, reducing Greece’s debt; and seize control of the Bank of Greece from the ECB.”

As suspected, he’s was in it over his head.

My response would be to let the banks remain open with circumstances limiting withdrawals to available liquidity. Liquidity might come from earnings on assets, asset sales, and new deposits. The banks would be free, by mutual agreement, to issue IOU’s to depositors who didn’t want to wait for actual euro. The govt might issue IOU’s if it ran out of cash for operating expenses. To ‘seize control of the Bank of Greece from the ECB’ is nonsensical, as there’s nothing there but a computer with a spreadsheet. It would not give Greece the ability to clear funds outside of Greek member banks that are on that spreadsheet. Haircuts to bonds issued to the ECB and reducing Greek debt would also be meaningless in this context.

Trade, Atlanta Fed, Redbook sales

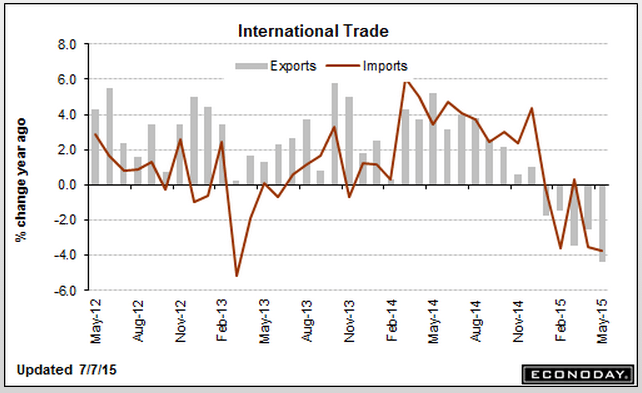
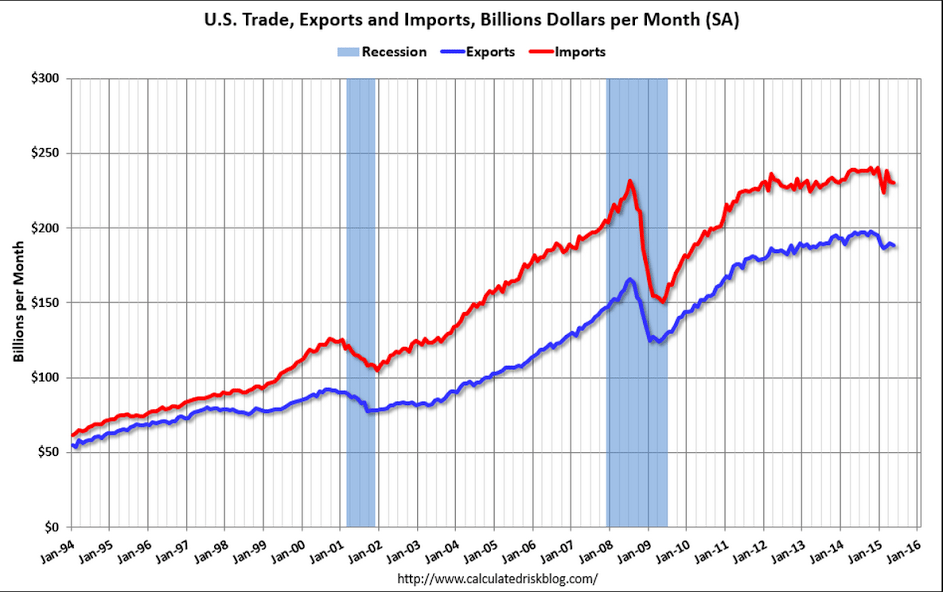
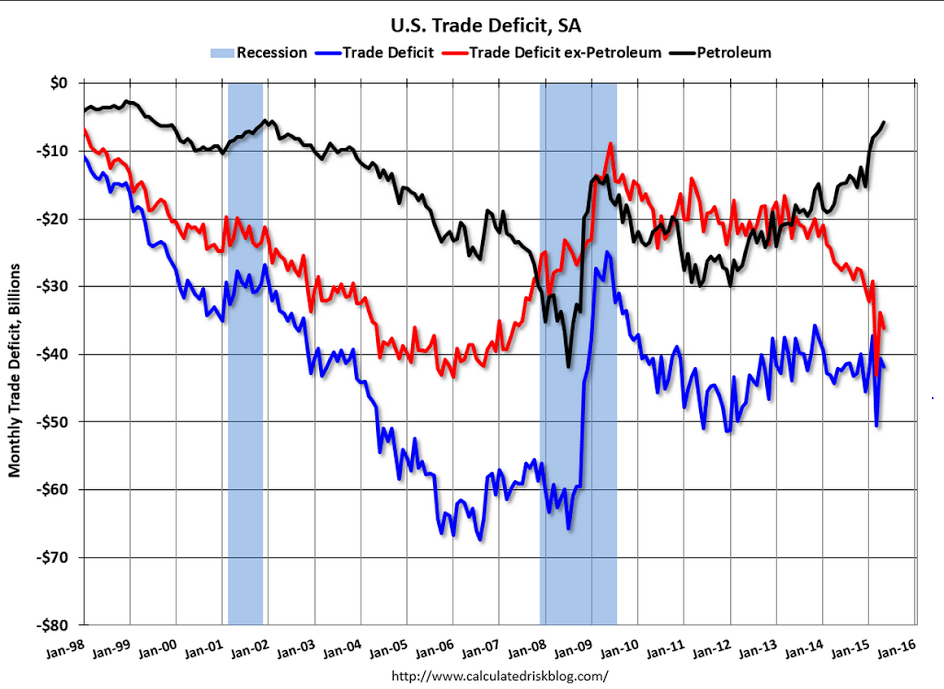
Trade deficit a bit higher but looks to me like more to come, including revisions. The petroleum gap is set to widen as US production begins to decline and is replaced by imports. And to my prior point, auto imports were up. And further note that global reductions in trade are associated with recessions:

International Trade
er-7-7-1
Highlights
The nation’s trade gap came in near expectations in May at $41.9 billion, wider than April’s revised gap of $40.7 billion. The goods gap rose by a net $1.2 billion to $61.5 billion, offset in part by a fractionally wider services surplus of $19.6 billion. The petroleum gap narrowed $1.0 billion to $5.8 billion which, reflecting rising domestic oil output together with rising exports of refined products, is the lowest since February 2002.

Exports, which have been pressured by strength in the dollar, fell $1.5 billion to $188.6 billion in May reflecting a $2.4 billion downswing for capital goods and, within this reading, a $1.2 billion downswing in aircraft exports. Exports of nonmonetary gold fell $0.5 billion in the month.

Imports were also down, $0.3 billion lower to $230.5 billion including a $0.8 billion decline in capital goods. Imports of industrial supplies fell $0.6 billion within which imports of crude oil fell $0.4 billion. The decline in crude imports comes despite a more than $4 rise in prices to $50.76 per barrel. Imports of autos rose $0.9 billion in the month.

By country, the gap with China rose $4.0 billion to $30.5 billion with the EU gap down $0.8 billion to $12.5 billion. The gap with Japan narrowed $1.8 billion to $5.2 billion while the gap with Mexico widened slightly to $4.6 billion in the month. And for the first time since 1990, the nation posted a monthly surplus with Canada, at $0.6 billion.

The decline in goods exports is a major concern for the manufacturing sector which is struggling right now with weak foreign demand. The May gap is in line with trend and is not likely to affect GDP estimates.
er-7-7-2
er-7-7-3
er-7-7-4

An uptick to 2.3% based on today’s trade report for May. The first Q2 GDP estimate will be out later this month, and will include an estimate for June trade which won’t come out until the first revision for Q2 GDP comes out:
er-7-7-5
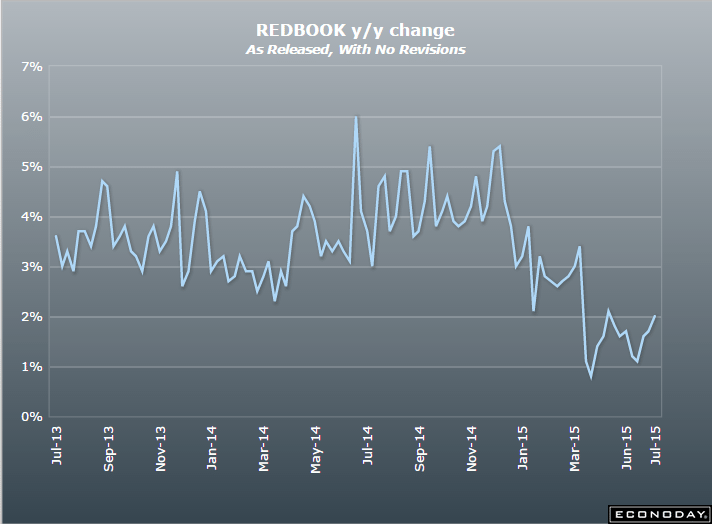
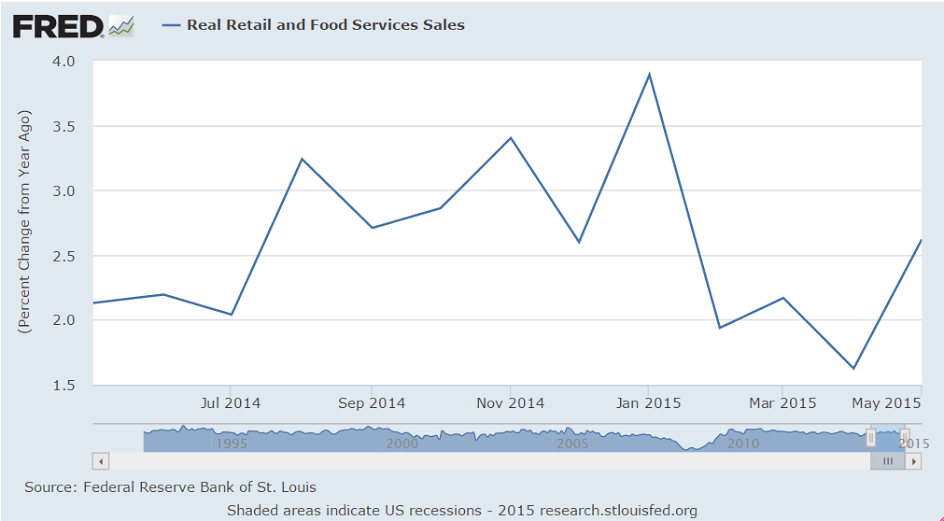
This minor indicator remains depressed, as do other retail sales indicators:

Redbook
er-7-7-6
Highlights
Hot weather triggered demand for seasonal goods in the July 4 week, helping to boost Redbook’s same-store year-on-year sales index by 3 tenths to plus 2.0 percent. But the reading is still soft and does not point to strength for the government’s core retail sales reading (ex-auto ex-gas). May was a very strong month for retail sales which, however, appear to have edged lower since.
er-7-7-7
er-7-7-8

NFIB employment, BOJ solvency, Non Farm Payrolls, Claims, Factory Orders

The cheer leaders didn’t bother to report on this they way they did when employment was increasing:

U.S. small business hiring takes a breather in June: NFIB

July 1 (Reuters) — The National Federation of Independent Business said its monthly survey of members found hiring was little changed last month. Fifty-two percent of small business owners reported hiring or trying to hire, with 44 percent of those reporting few or no qualified applicants for the positions they were trying to fill. Twenty-four percent reported job openings they could not fill, down from 29 percent in May, the NFIB said. The share of business owners looking to increase employment dropped six points, to 16 percent, while those planning reductions was up two points, at 6 percent.

Too stupid an article for me to pass up:

Is quantitative easing putting the Bank of Japan’s solvency at risk?

July 2 (Nikkei) — The BOJ’s holdings of long-term Japanese government bonds rose by 80 trillion yen a year, and its total assets expanded to 324 trillion yen at the end of fiscal 2014. The bank’s return on assets, that is, net profit divided by total assets, stood at 0.31%. If the interest rate goes up by 1 percentage point the bank’s unrealized losses are estimated to jump from 3.3 trillion yen at the end of March 2013 to 13.8 trillion yen at the end of March 2015. With the BOJ’s assets now equal to 64.7% of Japan’s GDP the credibility of the central bank is tied to the Japanese government’s fiscal discipline.

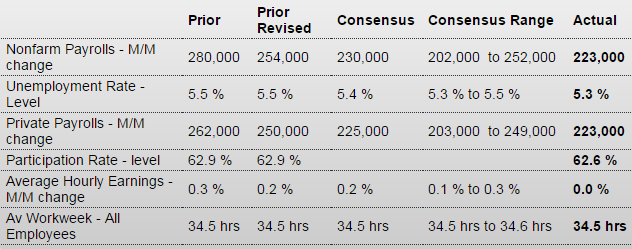
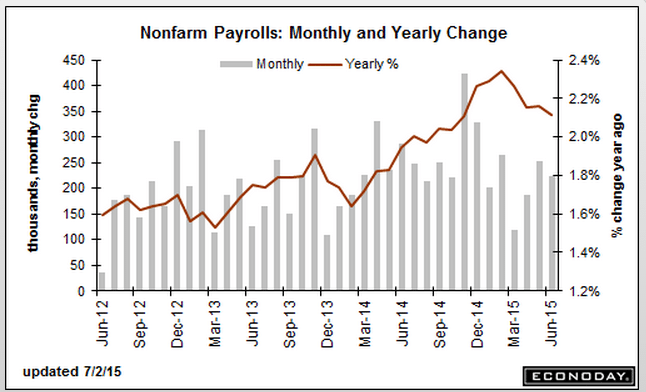
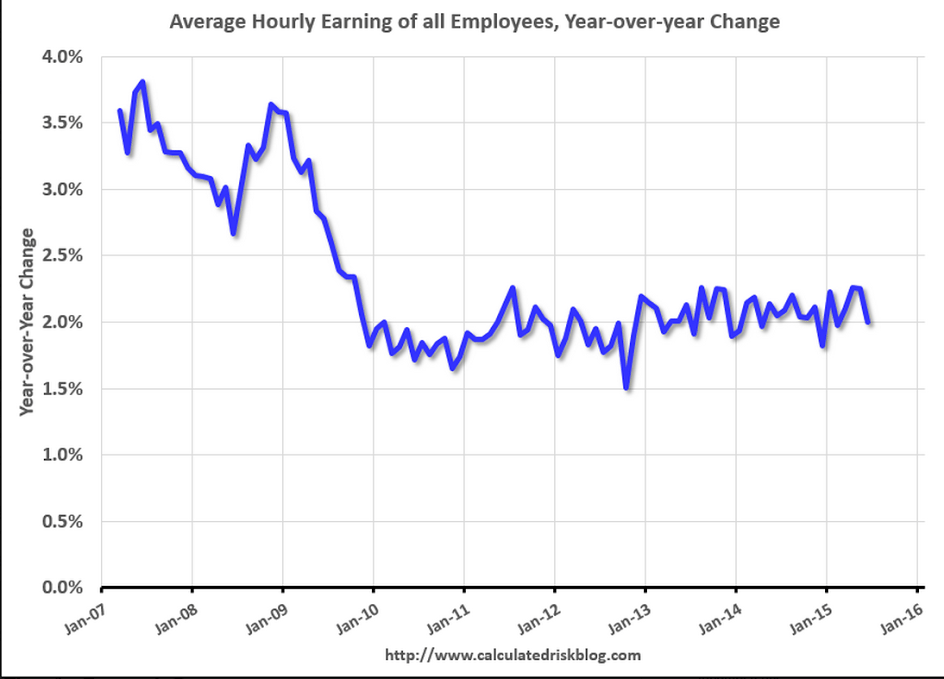
Not good, remember how they cheered the 280,000 new jobs in May, and downplayed the rise in unemployment and the increase in the participation rate? Now May is down to 254,000 and the participation rate fell way back, so they are playing up the drop in unemployment. And note the lack of comments over the deceleration of the year over year growth of employment since oil prices fell. And watch how they cling to their ‘wage inflation’ story even as growth rates again fall back:

NFP
er-7-2-1
Highlights
Push back that rate hike, at least that will be the initial reaction to June’s softer-than-expected employment report where nonfarm payroll growth came in at 223,000 vs Econoday expectations for 230,000 and include downward revisions totaling 60,000 to the two prior months (May revised to 254,000 from 280,000 and April to 187,000 from 221,000). Softness in payroll growth combines with softness in wage pressures with average hourly earnings unchanged in the month and the year-on-year rate moving down to 2.0 percent from 2.3 percent.

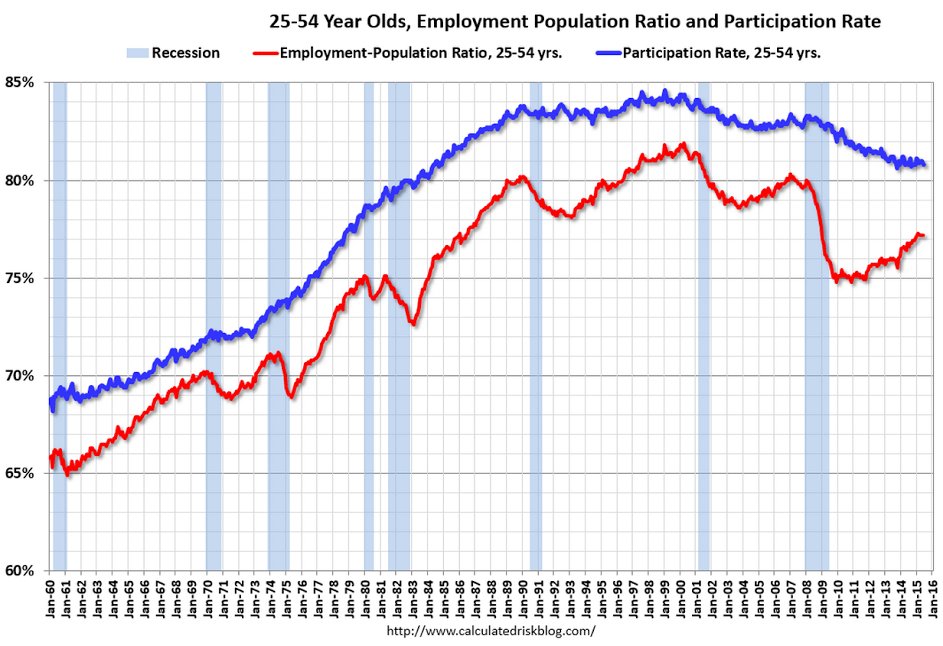
Timing distortions tied to the end of the school year, specifically new entrants to the labor market, appear to have pulled down the unemployment rate to 5.3 percent from 5.5 percent as the labor force in the household part of the report shrunk sharply, in turn pulling down the labor force participation rate by 3 tenths to an unusually low 62.6 percent. The U-6 unemployment rate, a favorite of Fed Chair Janet Yellen’s, fell 3 tenths to 10.5 percent.

Turning back to the establishment part of the report, private payrolls rose 223,000 vs a revised 250,000 in May. The average workweek was unchanged at 34.5 hours. Industries of note include a solid 33,000 rise in retail jobs and a 64,000 rise in professional & business service jobs. The latter reading includes a solid 20,000 rise in temporary help that hints at gains for permanent hiring ahead. Manufacturing and construction jobs were flat.

Focusing on trends, nonfarm payroll growth averaged 221,000 in the second quarter vs 195,000 in the first quarter which, despite the disappointment in today’s report, is solid improvement. The employment side of the labor market isn’t gangbusters but it is moving in the right direction while the unemployment side is increasingly favorable. This is a mixed report with special factors and isn’t likely to shake up the markets.
er-7-2-2

No demographics here- just a big fat lack of aggregate demand:
er-7-2-3
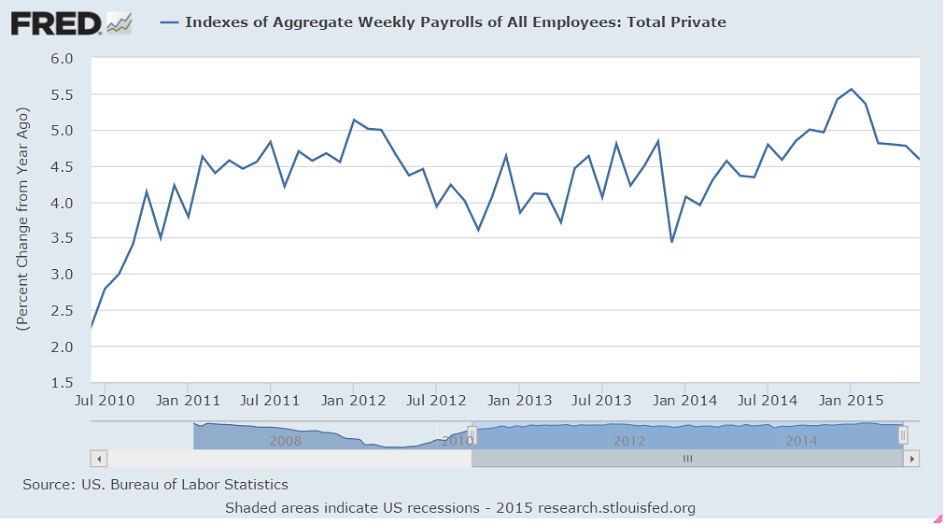
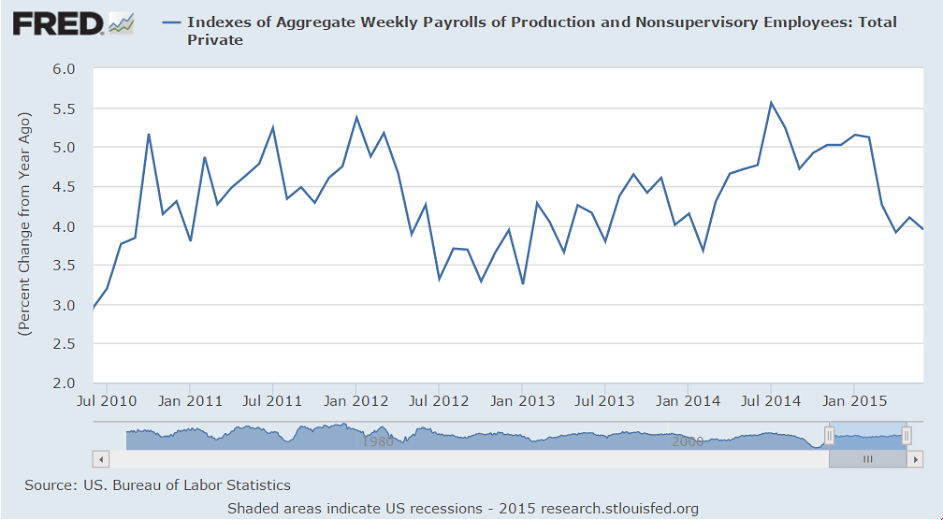
They call every zig up the start of ‘wage inflation’ even as they are all followed by zigs down:
er-7-2-4
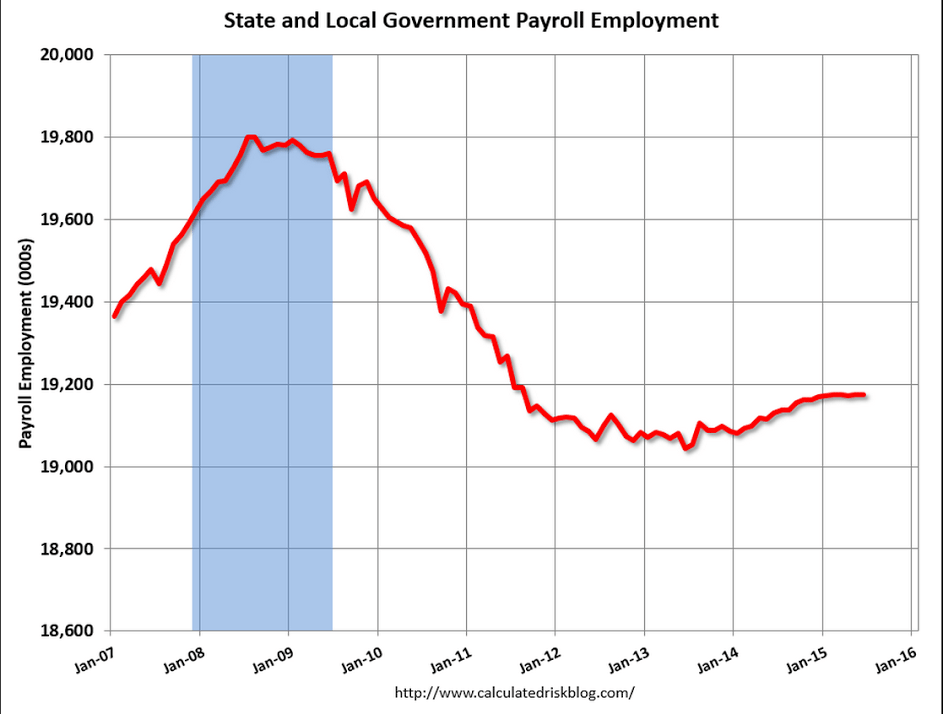
This too has leveled off after being touted for ‘lift off’ when it turned up a bit. And state and local deficits keep falling as tax revenues increase, which is an increase of fiscal drag:
er-7-2-5
The rate of growth here had be on the rise but more recently has reversed:
er-7-2-6
er-7-2-7
Up a tad but still low historically:

United States : Jobless Claims
er-7-2-8
Highlights
Unemployment is very low right now, underscored by today’s 2 tenths drop in the unemployment rate to 5.3 percent and by the latest in jobless claims data where initial claims came in at 281,000 in the June 27 week. This is up 10,000 from the prior week but remains very low. The 4-week average inched 1,000 higher to a 274,750 level that is little changed from the month-ago comparison.

Continuing claims, where data lag by a week, rose 15,000 to 2.264 million in the June 20 week. The 4-week average is up 15,000 to 2.253 million. These readings, like those for initial claims, are also very low. The unemployment rate for insured workers is unchanged at 1.7 percent in another reading that is very low.

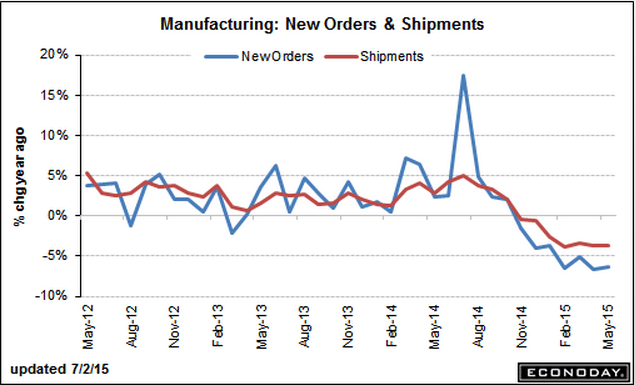
Another big negative ‘surprise’, and note the weak export comment, and how autos were weak despite higher May sales. Might be because of the high import content of those sales?

United States : Factory Orders
er-7-2-9
Highlights
The factory sector, hit by weak exports, continues to stumble with factory orders down 1.0 percent in May. This compares with Econoday expectations for minus 0.3 percent and is near the low-end estimate for minus 1.2 percent.

The durables component of the report, initially released last week, is now revised lower, to minus 2.2 percent from minus 1.8 percent. Durables in April have also been revised lower to minus 1.7 percent from minus 1.5 percent. The nondurables component, released with today’s report, helped limit the damage but not by much, up 0.2 percent on gains for petroleum and coal following a 0.3 percent gain for April.

But aircraft orders, always volatile, are to blame for much of the durables weakness, falling 49.4 percent in the month. Excluding transportation equipment, which is where aircraft orders are tracked, factory orders were unchanged in May which isn’t great but is much better than the minus 0.6 percent print for April.

Weakness in energy equipment is also a negative factor of the factory sector, down 22.2 percent in May following a 2.1 percent decline in April. Motor vehicle orders are also surprisingly weak, down 1.3 percent in May despite very strong sales. Orders for defense aircraft were also weak, down 6.4 percent.

Capital goods data had been showing some life but not much anymore with nondefense orders excluding aircraft down 0.4 percent following a 0.7 percent decline in April. These are especially disappointing readings. And core shipments of capital goods are dead flat, at minus 0.1 percent following only a 0.2 percent gain in April. These readings will likely pull down second-quarter GDP estimates.

Other disappointments include a steep 0.5 percent decline in total unfilled orders following April’s 0.2 percent decline. Declines in unfilled orders are not a good omen for employment. Total shipments fell 0.1 percent in the month. Inventories at least are stable, unchanged in the month as is the inventory-to-shipments ratio at 1.35.

First there was the unemployment report this morning and now this report, both of which may raise concern among the doves at the Fed that the second-quarter bounce back is not much of a bounce back at all.
er-7-2-10