China Extends Crackdown on Off-Balance-Sheet Loans

Cutbacks now will further slow things:

China Extends Crackdown on Off-Balance-Sheet Loans

July 4 (Reuters) — China’s bank regulator has cracked down on off-balance-sheet lending by the country’s banks, sources told Reuters on Monday, its latest step to prevent over-zealous and risky lending from hurting its financial system.

China Banking Regulatory Commission (CBRC) has ordered banks to check all their deals in discounted commercial bills after discovering misconduct among some banks, two sources said.

Chinese banks have in the past year taken to off-balance-sheet lending, or keeping loans outside balance sheets after authorities clamped down on bank loans as part of their fight against inflation.

Last week the regulator tightened control on sales of wealth management products to ward off potential risks, and the regulator had earlier told banks to include all their loans extended via trust investment programs into their account books.

Discounted bills, an important source of financing for firms with no access to formal bank loans, accounted for about 2.5 percent of the 49.5 trillion yuan ($7.7 trillion) of total outstanding loans at the end of March, according to data from the Chinese central bank.

The regulator’s latest move comes after discovering that some rural credit cooperatives and banks in the central Henan province were issuing loans through discounted commercial bills and keeping them outside their loan books.

Under China’s banking laws, banks’ deals in discounted commercial bills should be reflected on their balance sheets.

Banks have been asked to investigate all deals linked to discounted commercial bills and submit their findings by Monday, sources said.

Under the review, banks were ordered to verify that bills issued were based on real transactions, and were ordered to track how extended credit was spent, they added.

Banks were also instructed to stop discounting bills that they issued to get funds for property and stock investments.

Analysts welcomed the move towards stringent regulation, which would also boost transparency.

“There is some concern that some borrowers were using these discounted bills as collateral for further borrowing,” said Mike Werner, a China banking analyst with Sanford Bernstein.

“So the idea that the CBRC is going to increase diligence covering this area of the market is not surprising.”

The regulator said bank branches found with serious misconduct would be barred from the discounted commercial bill market entirely, the sources added.

CBRC was not immediately available for comment when contacted by Reuters.

As China tightens policy and rein in lending to tame 34-month high inflation of 5.5 percent, many companies are struggling to get loans.

For these firms, discounted commercial bills are an important source of financing. They let companies bring bills or drafts to banks and request for money to be disbursed before they mature.

China Commerce Ministry comments

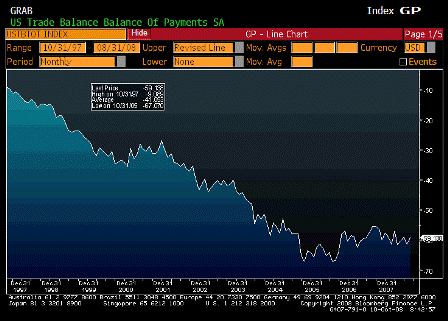
Looking ugly.

And a trade deficit and FDI not profitable due to higher costs can weaken the currency as well.

25Feb10 RTRS-CHINA COMMERCE MINISTRY SEE NO CLEAR EXTERNAL DEMAND REBOUND -SPOKESMAN

25Feb10 RTRS-CHINA COMMERCE MINISTRY SAYS WILL TAKE TWO-THREE YEATS TO REGAIN EXPORT MOMENTUM

25Feb10 RTRS-CHINA COMMERCE MINISTRY SAYS CANNOT RULE OUT POSSIBLE TRADE DEFICIT WITHIN SEVERAL MONTHS

25Feb10 RTRS-CHINA TO KEEP STABLE YUAN A PRIORITY -COMMERCE MINISTRY

Yuan Peg Spurs Exports


[Skip to the end]

If the yuan is ‘naturally’ stronger than that it means they are accumulating dollar reserves without the wrath of the US administration.
This will encourage other potential exporters to do the same and help the dollar find a bottom.

The Eurozone, however, remains ideologically inhibited from buying dollars yet is also determined to support demand through exports.

Crude oil remains key. Higher prices make dollars ‘easier to get’ overseas, lower prices make the dollar ‘harder to get.’

Yuan Peg Spurs Exports, Luring Pimco as Dollar Sinks

By Bloomberg News

Oct. 13 (Bloomberg) — Investors are the most bullish on the yuan in 14 months as China’s exporters say the currency’s link to the slumping dollar is helping revive sales.

Contracts based on expectations for the currency’s value a year from now show the yuan will appreciate 3 percent, compared with estimates for 0.5 percent two months ago, data compiled by Bloomberg show. Twelve-month non-deliverable forwards touched 6.5440 per dollar on Oct. 20, the strongest level since August 2008. They rose 0.3 percent to 6.6265 today, compared with a spot exchange rate of 6.8275.

The dollar’s decline against all 16 of the most-active currencies in the past six months has made Chinese exports more competitive because the government has pegged the yuan to the greenback since July 2008. Union Investment and Martin Currie Investment Management Ltd., which oversee a total of $250 billion, are buying contracts that will profit from an end to the peg, predicting the yuan will gain 5 percent a year.

“Exports are beginning to pick up,” said Douglas Hodge, the chief operating officer of Pacific Investment Management Co., which runs the world’s largest bond fund. “The fact that the dollar has fallen makes the yuan cheaper relative to the euro and the yen, so it does begin to improve their export picture.”


[top]

2008-10-10 USER


[Skip to the end]


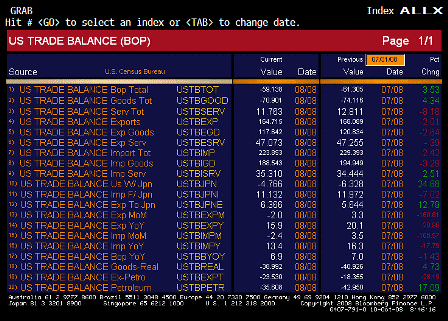
Trade Balance (Aug)

Survey -$59.0B
Actual -$59.1B
Prior -$62.2B
Revised -$61.3B

 
If oil prices don’t rise and the foreign sector’s desire to accumulate $US stays down this will go a lot lower.

[top][end]

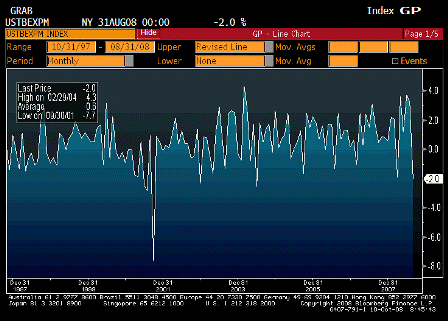
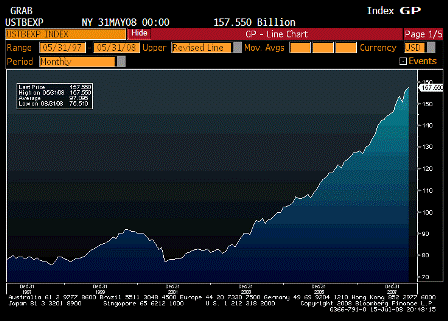
Exports MoM (Aug)

Survey n/a
Actual -2.0%
Prior 3.3%
Revised n/a

 
World economy takes pause.

[top][end]

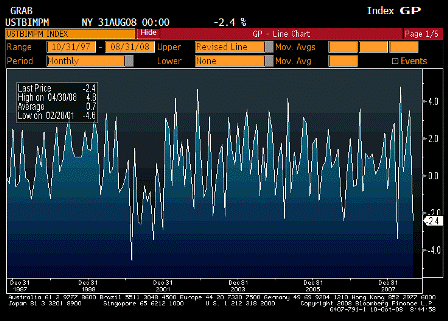
Imports MoM (Aug)

Survey n/a
Actual -2.4%
Prior 3.5%
Revised n/a

 
US economy pauses.

[top][end]

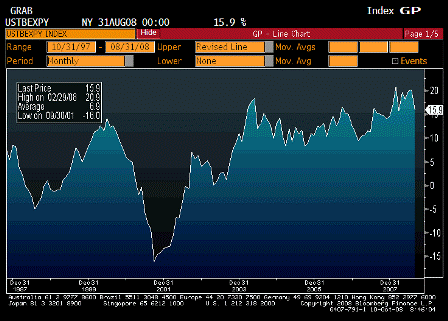
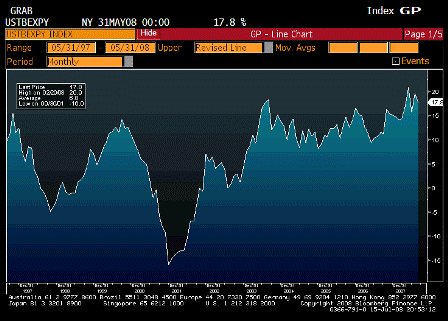
Exports YoY (Aug)

Survey n/a
Actual 15.9%
Prior 20.1%
Revised n/a

 
Still way high.

[top][end]

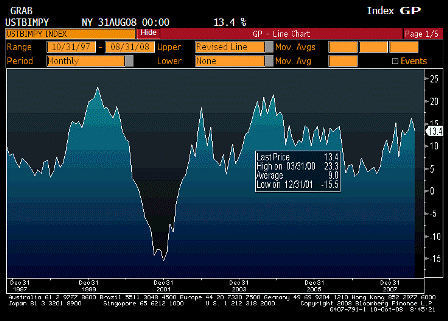
Imports YoY (Aug)

Survey n/a
Actual 13.4%
Prior 16.3%
Revised n/a

 
Still growing fast, but largely oil prices.

[top][end]

Trade Balance ALLX (Aug)

[top][end]


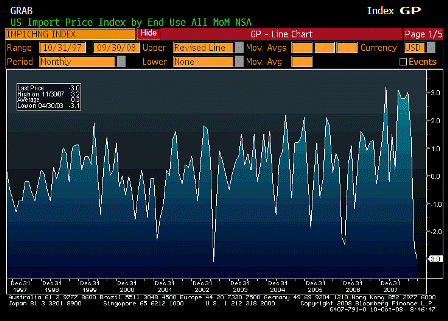
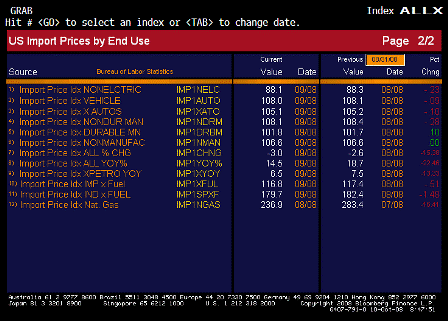
Import Price Index MoM (Sep)

Survey -2.8%
Actual -3.0%
Prior -3.7%
Revised -2.6%

 
Big drop.

[top][end]

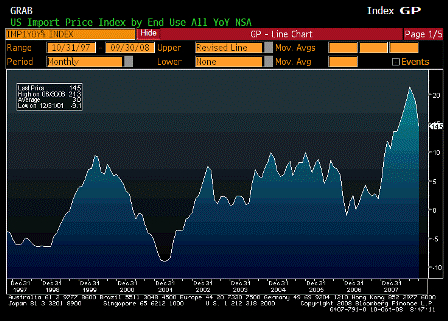
Import Price Index YoY (Sep)

Survey 12.2%
Actual 14.5%
Prior 16.0%
Revised 18.7%

 
Still very high.

[top][end]

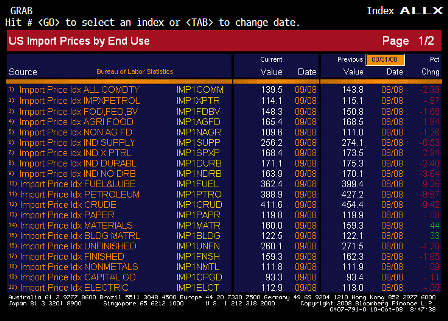
Import Price Index ALLX 1 (Sep)

[top][end]

Import Price Index ALLX 2 (Sep)


[top]

2008-08-12 US Economic Releases


[Skip to the end]


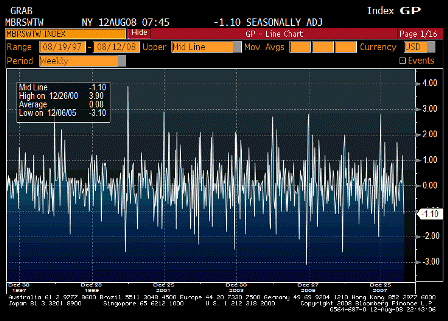
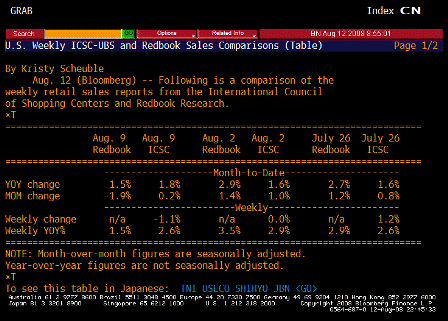
ICSC-UBS Store Sales WoW (Aug 12)

Survey n/a
Actual -1.1%
Prior 0.0%
Revised n/a

[top][end]

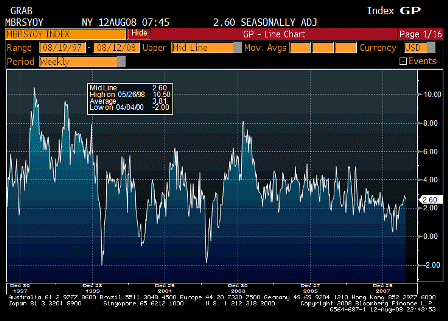
ICSC-UBS Store Sales YoY (Aug 12)

Survey n/a
Actual 2.6%
Prior 2.9%
Revised n/a

Year over year looking fine.

[top][end]

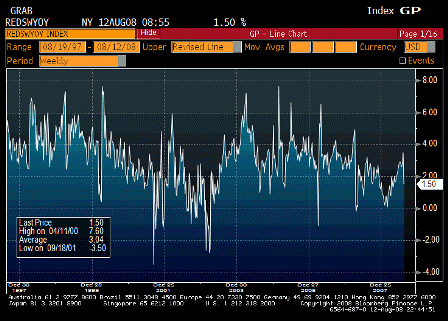
Redbook Store Sales Weekly YoY (Aug 12)

Survey n/a
Actual 1.5%
Prior 3.5%
Revised n/a

Softer but no collapse.

[top][end]

ICSC-UBS Redbook Comparisson TABLE (Aug 12)

[top][end]


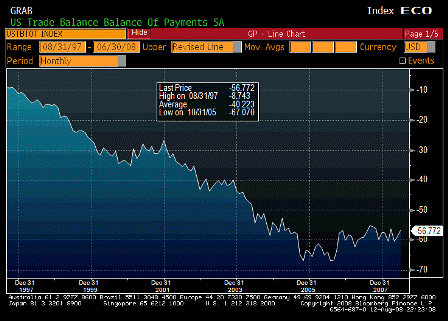
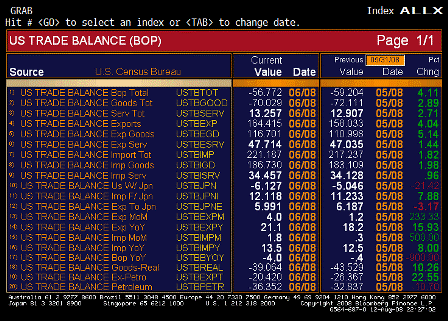
Trade Balance (Jun)

Survey -$62.0B
Actual -$56.8B
Prior -$59.8B
Revised -$59.2B

Lower than expected and moving lower even with crude prices up in June.

I still think last months number was too high which is part of the reason for the June drop.

[top][end]

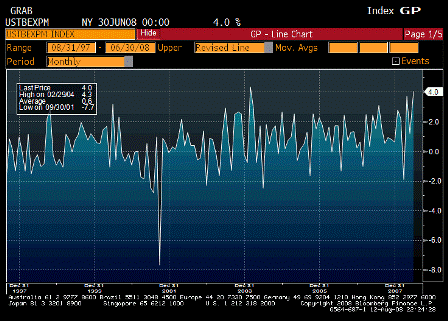
Exports MoM (Jun)

Survey n/a
Actual 4.0%
Prior 1.2%
Revised n/a

Government and exports continue to support GDP.

Q2 now looking to be revised to maybe north of 3%.

[top][end]

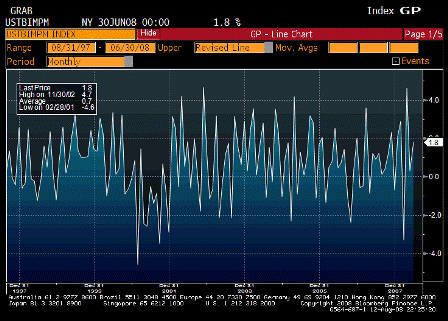
Imports MoM (Jun)

Survey n/a
Actual 1.8%
Prior 0.3%
Revised n/a

Up due to crude and gasoline prices.

[top][end]

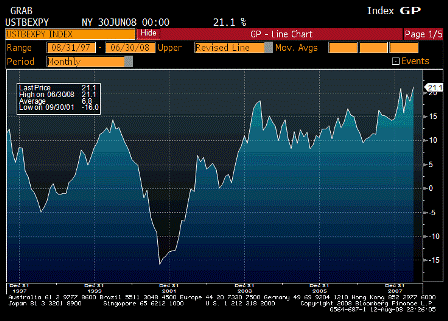
Exports YoY (Jun)

Survey n/a
Actual 21.1%
Prior 18.2%
Revised n/a

Looking more like an export economy every day. Weak domestic consumption and ok employment.

Workers earn enough to drive to work and eat, and the rest of their output gets exported to someone else.

[top][end]

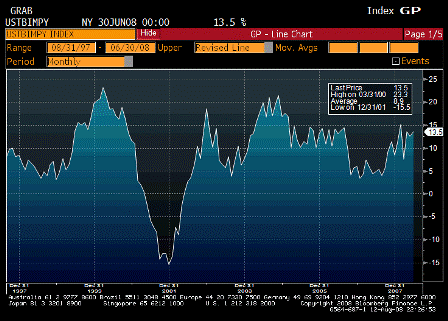
Imports YoY (Jun)

Survey n/a
Actual 13.5%
Prior 12.5%
Revised n/a

Mostly petro and product prices.

Other imports are down.

[top][end]

Trade Balance ALLX (Jun)

Ex petro down to about 20 billion.

[top][end]


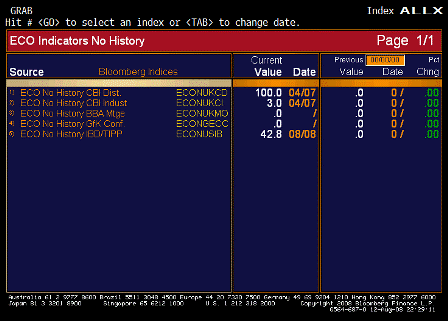
IBD-TIPP Economic Optimism (Aug)

Survey 39.0
Actual 42.8
Prior 37.4
Revised n/a

Up some, but less than expected.

[top][end]


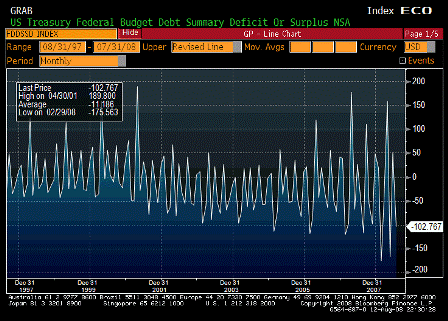
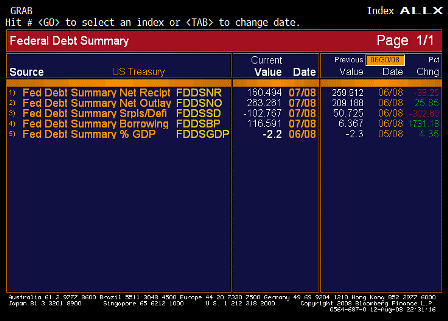
Monthly Budget Statement (Jul)

Survey -$95.0B
Actual -$102.8B
Prior -$36.4B
Revised n/a

Government spending and exports supporting GDP more than most anticipate.

[top][end]

Monthly Budget Statement ALLX (Jul)

[top][end]


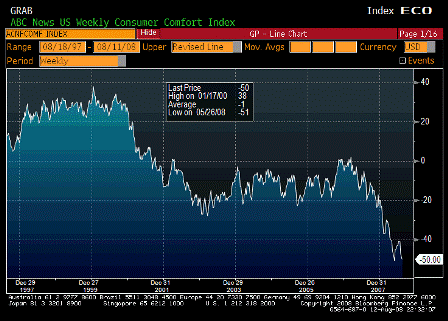
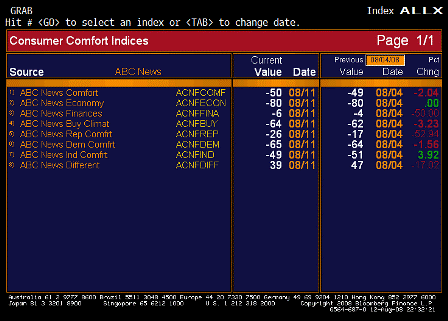
ABC Consumer Confidence (Aug 10)

Survey n/a
Actual -50
Prior -49
Revised n/a

Bumping along the bottom.

Inflation hurting confidence as wages remain ‘well contained’.

[top][end]

ABC Consumer Confidence ALLX (Aug 10)


[top]

Exports, Inflation, and the USD


[Skip to the end]

This is what happens when non residents are scrambling to reduce their hoards of USD financial assets.

Exports rising like this along with the still falling dollar indicates the current $60 billion monthly trade gap is still too high – non-residents simply don’t want to accumulate USD financial assets at that rate.

This adjustment process continually aligns the ‘real’ (price adjusted) trade gap to levels that equal foreign $US ‘savings desires’.

For the US this currently means a weak USD and a combo of rising exports and rising traded goods prices.

GDP muddles through as government spending and exports support demand, with continuing weak domestic demand and declining real terms of trade crushing the US standard of living.


US Exports

[top][end]

US Exports YoY


[top]

Schmidt of RBS favors USD over Euro — a turning point?????


[Skip to the end]

Bloomberg News Video Clip

Maybe, but…

It will be tough for the USD index to move up without the CBs and monetary authorities buying it, and that means crossing Paulson and accepting being labeled a ‘currency manipulator’ and ‘outlaw.’

And the higher crude prices mean USD spent on imports increase and unless spending on US domestic assets, goods, and services goes up by that much those unspent USD need to be/are ‘saved’ by non-residents and the USD goes to a level that reflects their current desire to accumulate them.

A rising USD is evidence that the foreign sector wants the extra USDs and are fighting over them. A falling dollar is evidence of the reverse.

Also, if they don’t like the other currencies any more than they like the USD, the currencies can remain relatively stable as the excess USDs are all spent on US exports and US domestic assets. The evidence of this is rising/accelerating US exports and export prices and support for US assets which can include real estate and equities. Note the falling USD has made US equities that much cheaper for non-USD based investors.

This is all part of the same adjustment process, which includes ‘inflation’ as all the pieces described above support higher prices for goods and services both in the US and elsewhere.

And the ‘inflation channel’ also is part of the adjustment of the trade gap. I use the extreme example (hopefully it’s only an extreme example) of prices adjusting upward until coffee is $60 billion a cup, in which case the trade gap of $60 billion per month is only one cup of coffee. In other words, higher prices work to bring down the ‘real’ trade gap.

So they are all working together -trade, fx, prices- within current institutional arrangements (including CBs not wanting to be labeled outlaws and currency manipulators vs the desire to support their exporters, etc) as they always and continuously do to adjust desired to actual ‘savings’ of financial assets, and sustain all the indifference levels.

A turning point if the level of the USD is sufficiently low to drive the US exports and asset sales to non residents needed to keep their residual accumulation of USD to their desired levels.

And with crude prices still rising, it seems likely to me that more USD are being credited to ‘their’ accounts than they currently wish to cling to at current exchange rates, so more downward pressure on the USD would not surprise me. Along with the associated increase in US exports and higher prices in general.


[top]

Exports – looks good, feels bad

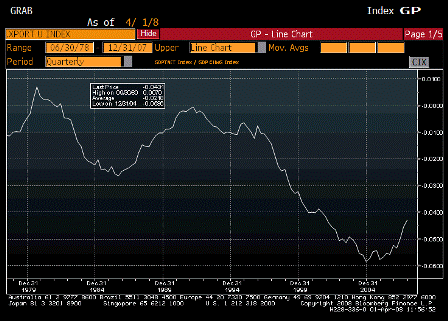
2008-04-01 Net Exports as a % of GDP

Net Exports as a % of GDP

(Keep in mind: exports are real costs; imports real benefits.)

Since January 2005 net exports (while still negative) have gone up by about 1.55% of GDP through 2007 year end, and so far have continued higher in Q1 2008.

In Q1 2005 the general environment was that of a 3% GDP growth rate while today it is at best about 1%.

That means for the economy as a whole, we ‘feel’ a total loss of ‘average domestic consumption/investment’ of over 3.5% of GDP.

That’s why to many economists it ‘feels’ like a recession even though real GDP remains somewhat positive.

We are experiencing a rapid deterioration of what’s called our ‘real terms of trade’.

That means even though we might work just as hard and produce just as much, we get to consume less while we export more.

How far can this go?

It is all a function of how many USD financial assets the rest of the world desires to accumulate.

If that number is zero (meaning they don’t want to add to their multiple trillions of USD financial assets they already have), US net exports will go to zero.

And we will feel worse by another 4% of GDP, all else equal.

And our policy makers think this is a good thing.

In the last round of Congressional hearings Bernanke testified that he’d like to see less domestic consumption and more exports and investment.

Looks good, feels bad.

Central bank debate: Is it inflation or deflation?

Here’s how the inflation can persist indefinitely:

  1. In addition to the India/China type story for resource demand, this time around nominal demand for commodities is also coming from our own pension funds who are shifting more of their financial assets to passive commodity strategies.

    Pension funds contributions have traditionally been invested primarily in financial assets, making them ‘unspent income’ and therefore ‘demand leakages.’ Other demand leakages include IRAs (individual retirement accounts), corporate reserve funds, and other income that goes ‘unspent’ on goods and services.

    Supporting these demand leakages are all kinds of institutional structure, but primarily tax incentives designed to increase ‘savings’.

    These come about due to the ‘innocent fraud’ that savings is necessary for investment, a throwback to the gold standard days of loanable funds and the like.

    A total of perhaps $20 trillion of this ‘unspent income’ has accumulated in the various US retirement funds and reserves of all sorts.

    This has ‘made room’ for the government deficit spending we’ve done to not be particularly inflationary. In general terms, the goods and services that would have gone unsold each year due to our unspent income have instead been purchased by government deficit spending.

    But now that is changing, as a portion of that $20 trillion is being directed towards passive commodity strategies. While the nature of these allocations varies, a substantial portion is adding back the aggregate demand that would have otherwise stayed on the sidelines.

    That means a lot less government deficit spending might be needed to sustain high levels of demand than history indicates.

    And, of course, the allocations directly support commodity prices.
  1. We are faced with the same monopoly supplier/swing producer of crude oil as in the 1970’s.

    Back then the oil producers simply accumulated $ financial assets and were the source of a massive demand leakage that caused widespread recession in much of the world. And didn’t end until there was a supply response large enough to end the monopoly pricing power.

    But it did persist long enough for the ‘relative value story’ of rising crude prices to ‘turn into an inflation story’ as costs were passed through the various channels.

    And a general inflation combined with the supply response served to return the real terms of trade/real price of crude pretty much back to where they had been in the early 1970’s.
  1. This time around rather than ‘hoard’ excess oil revenues the producers seem to be spending the funds, as evidence by both the trillions being spent on public infrastructure as well as the A380’s being built for private use, and the boom in US exports- 13% increase last month.

    This results in increased exports from both the US and the Eurozone to the oil producing regions (including Texas) that supports US and Eurozone GDP/aggregate demand.

    At the macro level, it’s the reduced desire to accumulate $US financial assets that is manifested by increasing US exports.

    (This reduced desire comes from perceptions of monetary policy toward inflation, pension fund allocations away from $US financial assets, Paulson calling CBs who buy $US currency manipulators and outlaws, and ideological confrontation that keeps some oil producers from accumulating $US, etc. This all has weakened the $ to levels where it makes sense to buy US goods and services – the only way foreigners can reduce accumulations of $US is to spend them on US goods and services.)

    The channels are as follows:

    1. The price of crude is hiked continuously and the revenues are spent on imports of goods and services.
    2. This is further supported by an international desire to reduce accumulation of $US financial assets that lowers the $ to the point where accumulated $ are then spent on US goods and services.

    For the US this means the export channel is a source of inflation. Hence, the rapid rise in both exports and export prices along with a $ low enough for US goods and services (and real assets) to represent good value to to foreigners.

  1. This is not a pretty sight for the US. (Exports are a real cost to the US standard of living, imports a real benefit.)

    Real terms of trade are continually under negative pressure.

    The oil producers will always outbid domestic workers for their output as a point of logic.

    Real wages fall as consumers can find jobs but can’t earn enough to buy their own output which gets exported.

    Foreigners are also outbidding domestics for domestic assets including real estate and equity investments.
  1. The US lost a lot off aggregate demand when potential buyers with subprime credit no longer qualified for mortgages.

    Exports picked up the slack and GDP has muddled through.

    The Fed and Treasury have moved in an attempt to restore domestic demand. Interest rate cuts aren’t effective but the fiscal package will add to aggregate demand beginning in May.

    US export revenues will increasingly find their way to domestic aggregate demand, and housing will begin to add to GDP rather than subtract from it.

    Credit channels will adjust (bank lending gaining market share, municipalities returning to uninsured bond issuance, sellers ‘holding paper,’ etc.) and domestic income will continue to be leveraged though to a lesser degree than with the fraudulent subprime lending.

    Pension funds will continue to support demand with their allocations to passive commodity strategies and also directly support prices of commodities.
  1. Don’t know how the Fed responds – my guess is rate cuts turn to rate hikes as inflation rises, even with weak GDP.
  1. We may be in the first inning of this inflation story.

    Could be a strategy by the Saudis/Russians to permanently disable the west’s monetary system, shift real terms of trade, and shift world power.

GDP/ADP

From Karim:

  • GDP slows from 4.9% to 0.6%
  • Personal consumption slows from 2.8% to 2.5%
  • DGO strength in Dec shows up in modest positive in equipment and software (+3.8%)
  • Residential FI (housing) down 23.9%
  • Core PCE up 2.7% annualized for quarter and 2.1% y/y
  • Net exports add 0.4% to gwth
  • Inventories a drag by 1.25%
  • Inventory/shipment ratio still at recent highs, so unlikely that inventory drag is over yet
  • ADP gain of 130k signals upside risk to consensus 65k advance in nfp; while usually reliable, adp has also had some spectacular misses
  • In light of decline in jobs hard to get component of conference board survey and adp, will call for 90k gain in nfp Friday.
  • Pretty long period between jan and march fed meetings (next meeting march 21). So by next meeting, will have 2 nfp reports to look at as well as decent idea on Q1 gwth. Bernanke testimony likely on 2/27.

♥