Health Care Expenditures, ISM Manufacturing, Construction Spending

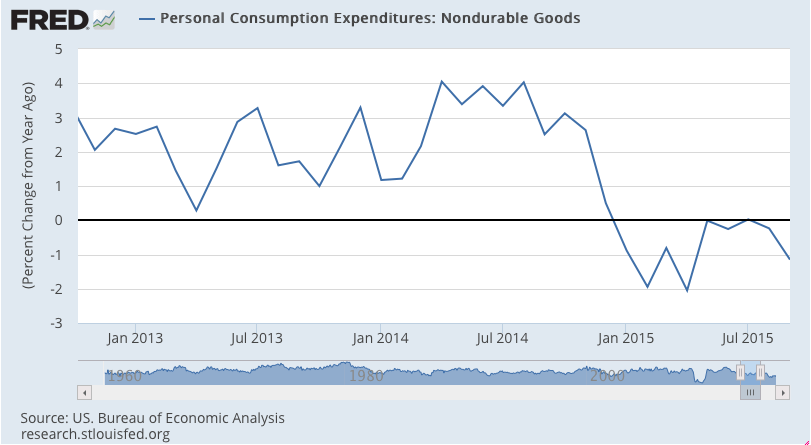
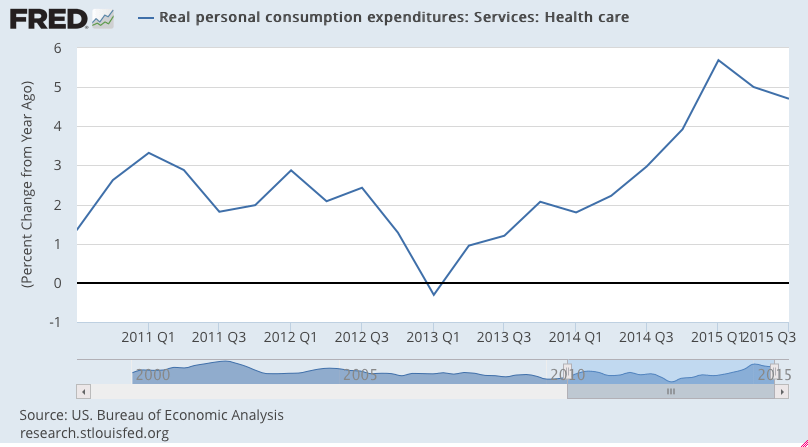
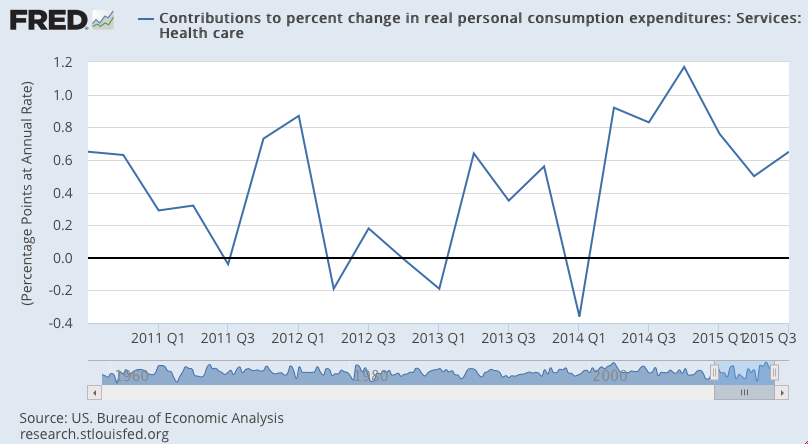
My understanding is that this series includes premiums paid for health insurance and so GDP has gotten a one time boost from from the newly insured who are now paying insurance premiums via the affordable care act. So Q4 should see another reduction and growth and a lower contribution to GDP growth:
er-11-2-1
er-11-2-2
This kind of personal consumption collapsed with the collapse in oil prices and oil capex:
er-11-2-3
er-11-2-4

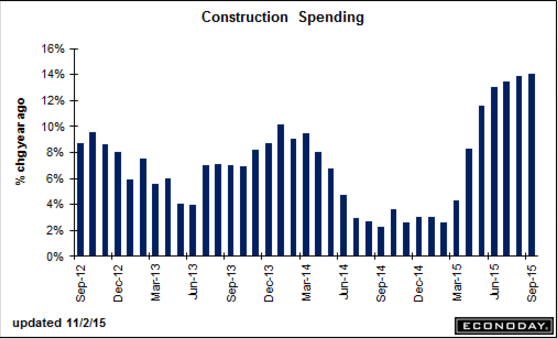
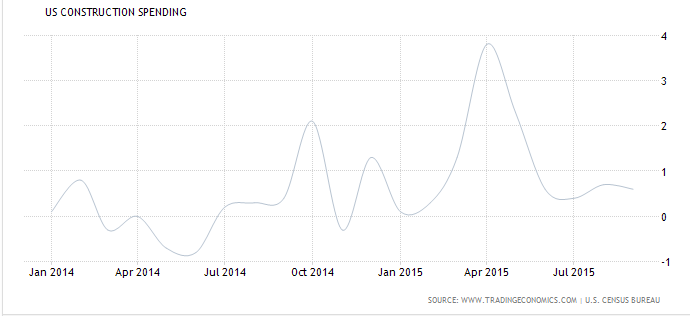
This is for September, and is slowing as previously discussed after permits peaked in June with the expiring tax laws:

Construction Spending
er-11-2-5
Highlights
Construction spending looks solid, up a better-than-expected 0.6 percent in September with gains led by housing components. Residential spending extended six months of strong gains with a 1.9 percent increase for a year-on-year gain of 17.1 percent which is 3 percentage points better than the rate for total construction, at 14.1 percent. New multi-family units continue to lead the residential component, up 4.9 percent for a 26.7 percent year-on-year gain, while new single-family homes rose 1.3 percent for a more than respectable year-on-year gain of 12.7 percent.

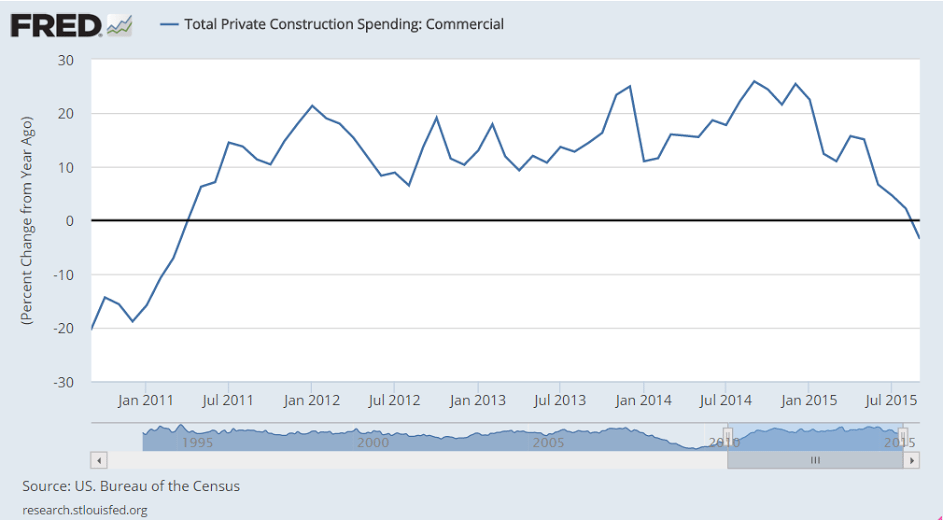
Private nonresidential construction has also been strong this year but not in September, down 0.7 percent including declines for most subcomponents especially both power and commercial. Still, the year-on-year rate for private nonresidential is plus 14.9 percent. Readings on public construction, up a total 0.7 percent in the month, are also favorable with subcomponents trending at or near double-digit year-on-year growth.

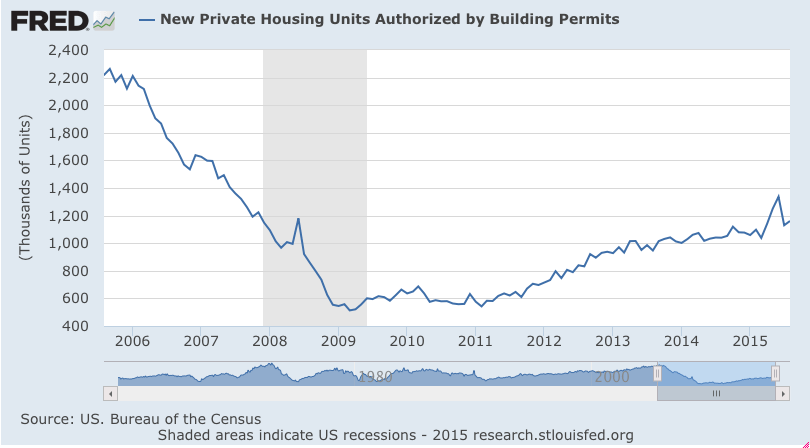
The gains in this report, especially for multi-family units, are the outcome of a spike in permits during the spring. Permits, however, have not been showing great strength in recent months, in turn pointing to moderation for what still looks to be, however, a solid construction sector.

er-11-2-6
er-11-2-7
Collapsed when oil prices and oil capex collapsed:
er-11-2-8

Personal Income and Outlays, ECI, Chicago PMI, Consumer Sentiment, GDP related

Income and spending and pricing low and lower than expected:

Personal Income and Outlays
er-10-30-1
Highlights
Inflation is not building based on the Fed’s favorite reading, the core PCE price index which inched a lower-than-expected 0.1 percent higher in September with the year-on-year rate steady and flat at only plus 1.3 percent. These results will not lift the odds for a December hike at the next FOMC.

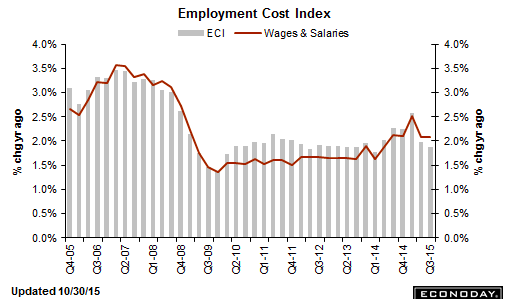
Income and spending data also came in below expectations, at plus 0.1 percent each vs expectations for plus 0.2 percent each. Income got no boost from wages & salaries in September which were unchanged following, however, strong gains of 0.5 percent in the two prior months that underscore this morning’s employment cost index which shows pressure in the third quarter. Spending in September was pulled down by a 1.2 percent plunge in nondurable goods that likely reflects the low price of fuel. Spending on durable goods, driven by vehicles, rose a strong 0.8 percent with spending on services up a solid 0.4 percent.

Other details include a 0.1 percent decline for the total PCE price index, again an effect likely based on fuel. Here the year-on-year rate is barely over zero at plus 0.2 percent. The savings rate continues to edge higher, up 1 tenth to 4.8 percent in a gain that hints at strength for future consumer spending.

Third-quarter consumer activity slowed in September, pointing to lack of momentum for October consumer data. Still, the consumer is in charge in the U.S. economy and, given low unemployment, the outlooks for holiday spending and fourth-quarter acceleration are favorable.

er-10-30-2
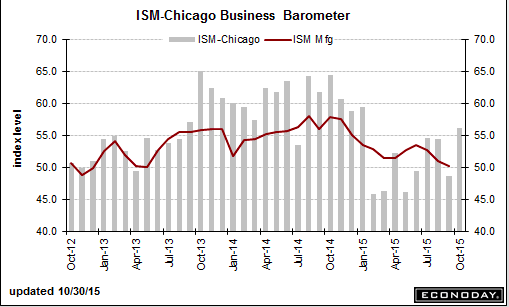
Nice move up here:

Chicago PMI
er-10-30-3
Highlights
Volatility is not that unusual for the Chicago PMI which surged 7.5 points from September and 6.0 points over consensus to a 56.2 level that points to sudden acceleration and solid growth this month for the whole of the Chicago economy. New orders and especially production are showing strength with both at their best levels of the year. The production reading, in fact, surged nearly 20 points in a reminder of how volatile this series can be.

Inventories are also up sharply, suggesting that Chicago businesses may be ramping up for stronger output going into the holidays. Hiring fell back to neutral following three months of gains and, in another negative, order backlogs are down for an eighth straight month. And for a third straight month, prices are in contraction.

Advance indications on the October economy are mixed with a sweep of regional Fed surveys pointing to another month of contraction for the factory sector but other readings, including this one, mixed to upbeat. Still, the volatility of this report should limit its impact on the month’s outlook.

er-10-30-4
er-10-30-5
Nothing here to push the Fed:
er-10-30-6
er-10-30-7
Typical very late cycle pattern here:
er-10-30-8

US Trade

This is just for ‘goods’ but seems to be counter to all other releases reporting weak exports, but it has been zig zagging it’s way lower and August was particularly weak. And note the weakness in car imports:

International trade in goods
er-10-28-3
Highlights
September reversed August’s outsized goods trade gap, coming in at $58.6 billion vs $67.2 billion. Exports jumped 3.1 percent following August’s 3.2 percent decline with wide gains in consumer goods, autos, industrial supplies and capital goods. Imports fell 2.5 percent following the prior month’s 2.2 percent gain. Decreases are wide including industrial supplies, capital goods, autos and consumer goods. The results do point to slowing demand but, because imports are counted as a subtraction in the national accounts, they should nevertheless give a boost to third-quarter GDP estimates.

And this typical commentary from today on why the Fed isn’t hiking:

The decision comes amid multiple data points that show a weakening in the economy, particularly in job gains and exports. Inflation measures the Fed follows also reflect little in the way of wage and price pressures, while economists are anticipating a muted holiday shopping season.

Confidence, Richmond, PMI Services

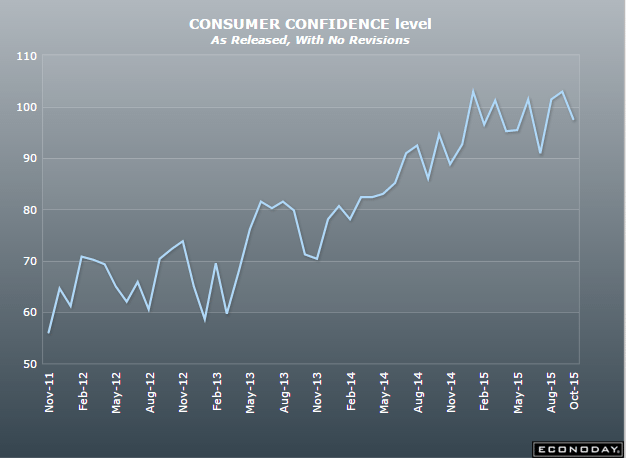
A lot less than expected based on jobs assessment, and note the drop in car buying plans:

United States : Consumer Confidence
er-10-27-13
Highlights
A decline in the assessment of the current jobs market pulled down the consumer confidence index to a lower-than-expected 97.6 in October. This is about 2.4 points below Econoday’s low-end forecast and 5.0 points below a revised September.

Consumers are saying there are fewer jobs available then there were in September and more say jobs are hard to get. But the latter reading, at 25.8 percent, is still low and consistent with low rates of unemployment. Still, these readings are weaker than September and helped pull down the present situation component by a sizable 8.2 points to 112.1.

The six-month outlook shows much less monthly weakness compared to September with the component down 2.8 points to 88.0. Buying plans are mixed with cars down but both houses and appliances up. Inflation expectations are steady at 5.1 percent which is moderate for this reading.

Jobs are at the heart of consumer confidence and today’s report will limit expectations for strength in the October employment report. This report may also limit expectations for retail sales in October including, based on buying plans, sales of vehicles.
er-10-27-14
United States : Richmond Fed Manufacturing Index
er-10-27-15
Highlights
The Richmond Fed makes it five for five, that is five regional Fed reports all showing negative headlines for October. The Richmond Fed index did improve, however, to minus 1 from September’s minus 5. New orders came in at zero following the prior month’s steep contraction of minus 12. But backlog orders, at minus 7, are down for a third month which is not a plus for future shipments or employment. Shipments in October fell to minus 4 from minus 3 which is also a third month of contraction. Hiring is still positive, unchanged at plus 3, but continued growth here is uncertain. Price data are mute with prices received showing slight contraction as they are in other reports. This morning’s report on durable goods orders showed another month of broad weakness in September and this report, together with the other regional reports, point to another weak month for the factory sector in October.

United States : PMI Services Flash
er-10-27-16
Highlights
Growth in the nation’s service sector is solid but a little slower this month than in September. The services PMI flash for October came in at 54.4 for the slowest rate of growth since the severe weather of January. The report cites a third straight slowdown in new business which is also at its weakest point since January. Though the service sector is insulated to a degree from foreign effects, the report does note that less favorable global conditions are making customers less willing to spend.

Backlogs are down for a third month which is the worst run in two years and hiring has slowed to the weakest level since February. The outlook, though still favorable, is near a three-year low. Price data show little change for inputs and only a fractional gain for prices charged. This report fits in with the general soft tone of economic data, softness that will perhaps be a key focus of tomorrow’s FOMC statement.

Existing Home Sales, Chicago Fed, Leading Indicators, KC Fed

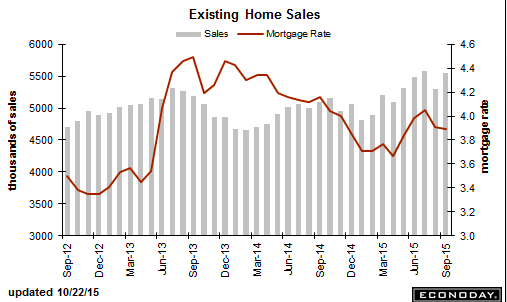
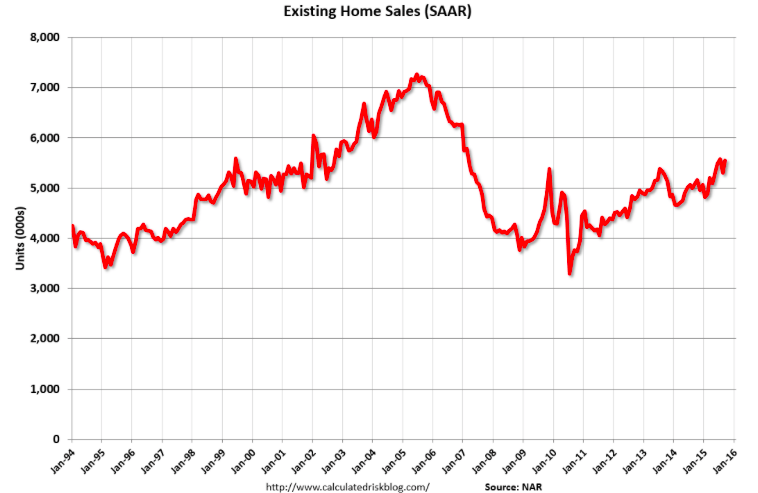
Higher than expected, not directly a contributor to GDP or a measure of output.
The change in fed mtg regs that caused the blip and mtgs and subsequent reversal
needs to play out here as well:

Existing Home Sales
er-10-22-2
Highlights
Existing home sales bounced back very strongly in September, up 4.7 percent to nearly reverse the prior month’s revised decline of 5.0 percent, a decline that now looks like an outlier on a steadily rising slope. The month’s annual sales rate, at 5.55 million, is just beyond Econoday’s top-end forecast while the year-on-year percentage gain, at plus 8.8 percent, is back where it was during the sales gains of the spring. This report is a big plus for the housing outlook, suggesting that demand for existing homes is nearly as strong as demand for new homes.

er-10-22-3
er-10-22-4
Yet another bad one here:

Chicago Fed National Activity Index
er-10-22-5
Highlights
September was a weak month across the economy. The national activity index came in at minus 0.37, a negative score that points to lower-than-average economic growth for the month. Production is the weakest component in the report, down 0.18 and reflecting in part export troubles in manufacturing. Sales/orders/inventories are at zero while the personal consumption & housing component is at minus 0.08. Employment is also in the negative column, at minus 0.11.

Weakness in September followed similar weakness in August where the index is at a revised minus 0.39. The 3-month average is at minus 0.09, down from plus 0.01 in August. This report is a reminder that, as long as economic data are weak, the doves can hold sway in the FOMC.

This hasn’t been useful with rates at 0 as the yield curve is one of its leading components.

But even with the positive yield curve its now gone negative:
er-10-22-6
Still negative but not as negative:

Kansas City Fed Manufacturing Index

er-10-22-7

Highlights
The Kansas City manufacturing sector came up for badly needed air in October, ending a long run of deep contraction. The composite came in at only minus 1 which is an eighth straight decline but much improved from nearly double digit declines in prior months. The real positive is the new orders index which, at plus 7, ended nine dismal months of straight contraction. But backlogs, at minus 4, are in a 10th month of uninterrupted contraction with employment, at minus 3, in a ninth month of contraction. Orders will have to pick up before employment will turn higher. Other readings include a plus 4 for production, which hints at relative strength for October production and shipment data, and a negative 3 for finished goods prices in yet another negative indication on inflation. This report, coming from one of the weakest energy-hit regions of the economy, is a marginal plus for the manufacturing outlook.

Mtg Purchase Apps, Arch. Billings, Japan Exports, Bernie Article

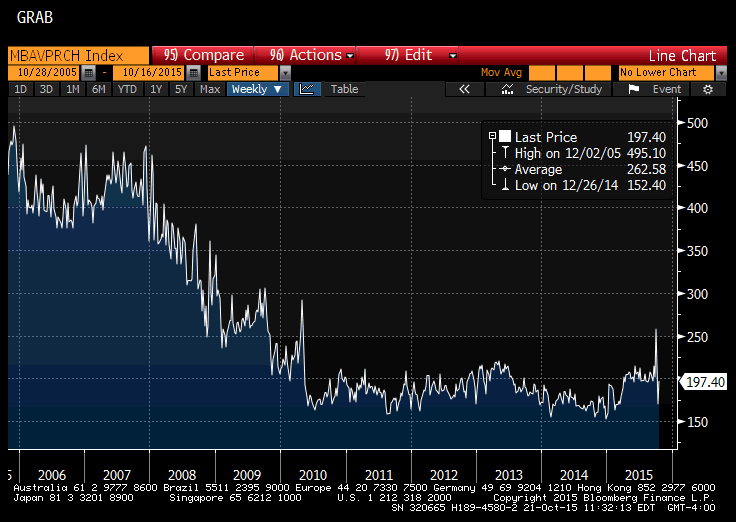
After the up and down in front of the change in regulations new purchase apps are, so far, lower than before:
sg2015102141533 (1)

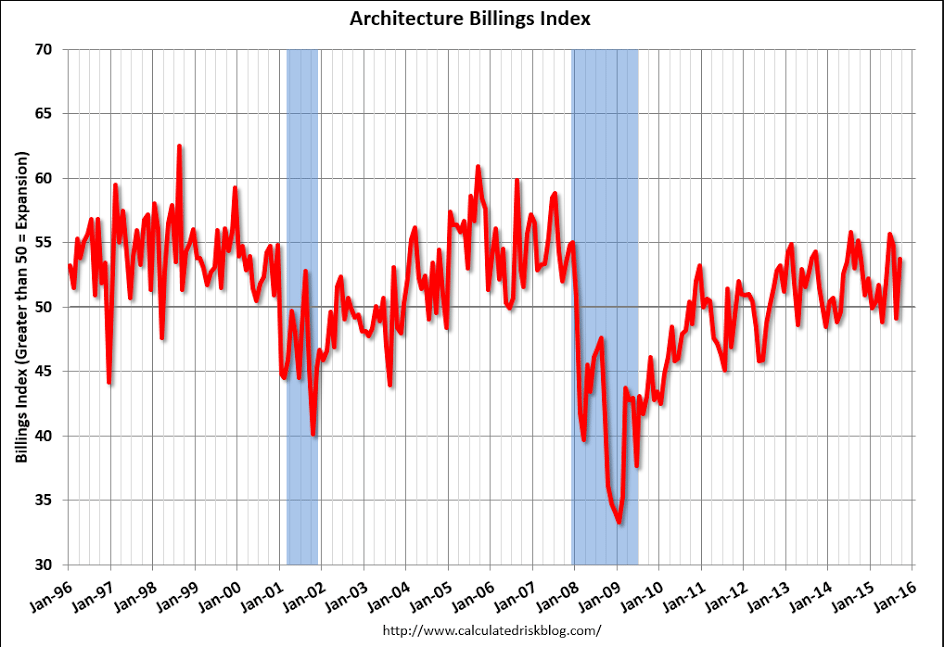
Fits with the permit spike/decline story, and there was also this note:

The multi-family residential market was negative for the eighth consecutive month – and this might be indicating a slowdown for apartments – or at least less growth.
er-10-21-5

Japan export growth slows sharply, raising fears of recession

By Tetsushi Kajimoto

Oct 21 (Reuters) — Japan’s annual export growth slowed for the third straight month in September, a worrying sign that overseas sales continued to drag on growth last quarter, adding to fears of a recession.

Ministry of Finance data showed exports rose just 0.6 percent in the year to September, against a 3.4 percent gain expected by economists in a Reuters poll.

That was the slowest growth since August last year and followed a 3.1 percent gain in August 2015. Compared with last month seasonally-adjusted shipments declined 1.7 percent.

Wednesday’s data is the first major indicator for September and is part of the calculation of third quarter gross domestic product. A third quarter contraction would put Japan into recession, given the second quarter’s negative GDP data.

China’s slowdown and soft domestic demand weighed on factory output and the broader economy, although the Bank of Japan saw the effects of China’s slowdown were limited for now, as it sticks to its rosy growth outlook, but that may change at the BOJ’s monetary policy review on Oct. 30.

The author is on the right track- it’s about aggregate demand and ‘inflation’ from excess demand.

But it’s not about rates per se, which are about the Fed’s reaction function, which does happen to include inflation, so to that extent it’s sort of ok…

Bernie Sanders doesn’t need to pay for his socialist utopia

By Jeff Spross

Without a doubt, presidential contender Bernie Sanders boasts the most ambitious policy proposals of anyone on the Democratic side. And sooner or later, the same question always comes up:

“Yeah, those are lovely ideas, but how’s he gonna pay for all this?”

For people who oppose Sanders’ program, it makes for a nice “gotcha.” But Sanders’ supporters bring it up sometimes too. Comedian Bill Maher pressed the senator on this last Friday, and Sanders dutifully listed off various ideas. They might bring in enough revenue or they might not; like his fellow candidates, Sanders’ proposals are still in their protean stage. What’s interesting is that Sanders and his fans are implicitly conceding that, yes, we would need to pay for this stuff.

May I humbly suggest this is wrong?

Not only do we not need to pay for Sanders’ programs, we shouldn’t pay for them. In fact, the federal government’s budget deficit is much too low.

How could I possibly suggest anything so loony? Contrary to popular belief, smaller deficits are not always better. How big or small the deficit should be is determined by how it interacts with the rest of the U.S. economy and other international economies. And there are two key metrics to look for there: interest rates and inflation.

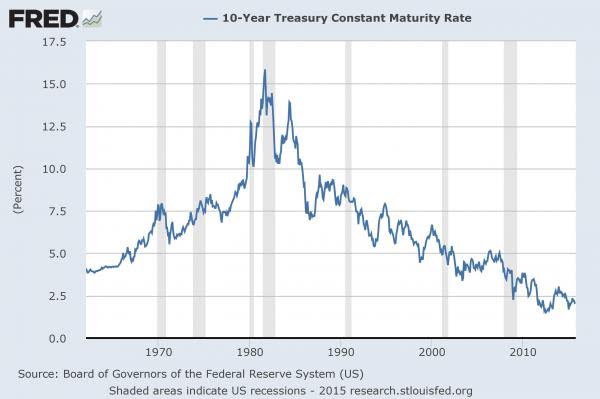
Like you or me or any company, when the U.S. government borrows money, it pays its lenders interest. This is an investment by the lender based on how much risk they want to take. So if they consider you a safe investment, they’ll demand low interest rates, and if they consider you a risky investment, they’ll demand higher rates. And interest rates on U.S. debt are currently the lowest they’ve been in at least half a century:
er-10-21-6
Equally important is why. If investors consider government debt unusually safe, it’s because they aren’t seeing lots of other places in the economy worth investing in. This shouldn’t be surprising: Our economic growth and job creation remain sluggish, there are no signs of wage growth, work force participation isdown, and economic insecurity remains high. There’s just not a lot of exciting economic ferment going on out there.

One big reason for this is that the government itself has pulled way back from spending money in the economy and hiring people. Economic ferment breeds economic ferment. More government aid, investment and hiring would mean more people with incomes to spend, creating more jobs in the private sector. So there should be a natural corrective here: Interest rates on government debt fall because it’s the only safe investment, so government borrows more and spends it, the economy picks up, and interest rates on the debt rise as investors find other places to park their cash.

But American policymakers moralize debt and deficits and think they should always be smaller, so that doesn’t happen.

Which brings us to the other key metric: inflation. Unlike you or me or any company, the U.S. government can print (or, in the digital age, create) money. At the end of the day, if you’re worried that government borrowing will drive up interest rates, you can always just have your central bank print more money and buy up government debt. One of the big reasons investors view the debt of advanced governments as safe is because, at the end of the day, they can always pay you back with money creation. And the central bank buying debt raises the demand for it, which brings interest rates back down.

But it also adds to the money supply, which threatens inflation — except that, as with interest rates, inflation is only going to rise once we’ve attained full employment. That’s when the new money stops being soaked up by new economic activity, and starts going into price increases instead. But the Federal Reserve has actually been creating a ton of new money recently, and it hasn’t really goosed the economy. That’s probably because the normal ways the Fed injects money into the economy don’t work as well as going in via government hiring and state aid.

So at the highest conceptual level, money printing and borrowing — monetary policy and fiscal policy — collapse into one another. This makes inflation, even more than interest rates, the key upper limit to government borrowing.

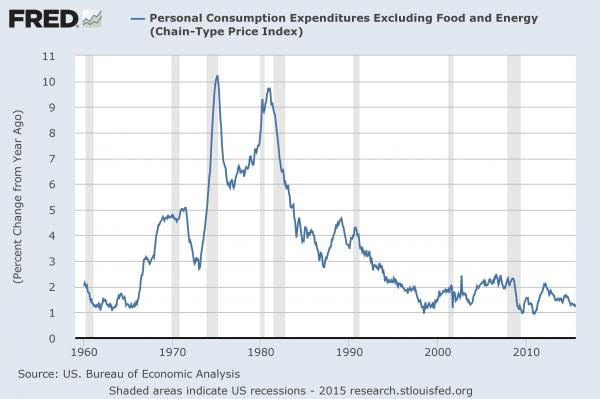
And the inflation rate is, well, about as low as it’s been in half a century:
er-10-21-7
The conclusion, by now, should be obvious: Government deficits are too low, and have been too low for agood long while.

Once you realize all this, it actually upends a lot of conventional wisdom. People usually talk about taxes and spending as being in balance with one another, but they’re actually both in balance with two other forces: the money supply and the overall health of the economy. You really can’t think of the government as just another economic actor, like an individual person or a business. It’s a unique thing unto itself: a hub or ballast tank for the overall flow of money and activity through the economy. No, its capacities to borrow and print money aren’t infinitely elastic. But it’s perfectly plausible that we could enter periods, like the current global doldrums, where government should run really big deficits and print lots of money for extended periods.

Take Bernie Sanders’ own favored example of Denmark: The Danes run a very generous welfare state, and have taxes high enough to pay for it. But Denmark is also facing a sluggish economy and rock-bottom inflation. So it’s actually being much too fiscally responsible. Denmark should expand its deficit — in this case, given the size of its deficit, by cutting its tax rates — and loosen up its monetary policy to buy up all that new debt. Taxes, under this logic, aren’t really about bringing in revenue — rather, they’re just another dial for managing this flow. And it’s conceivable that they would never need to balance with spending.

What’s funny is that Sanders might be gearing up to make this very argument. His chief economic adviser, University of Missouri-Kansas City economist Stephanie Kelton, is a fan of something called modern monetary theory: a batch of ideas that sketches out a very similar case to the one above.

Of course, Sanders hasn’t done this yet. And maybe he won’t.

But if he ever chose to throw down in favor of bigger deficits and more money-printing — on the national stage of a presidential election, no less — he’d be doing the country a tremendous service.
Euro Trade Surplus, Euro Inflation

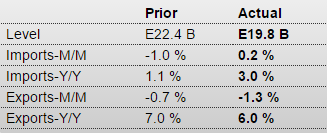
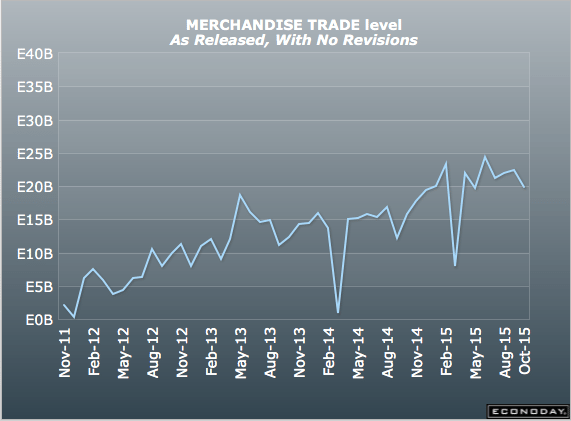
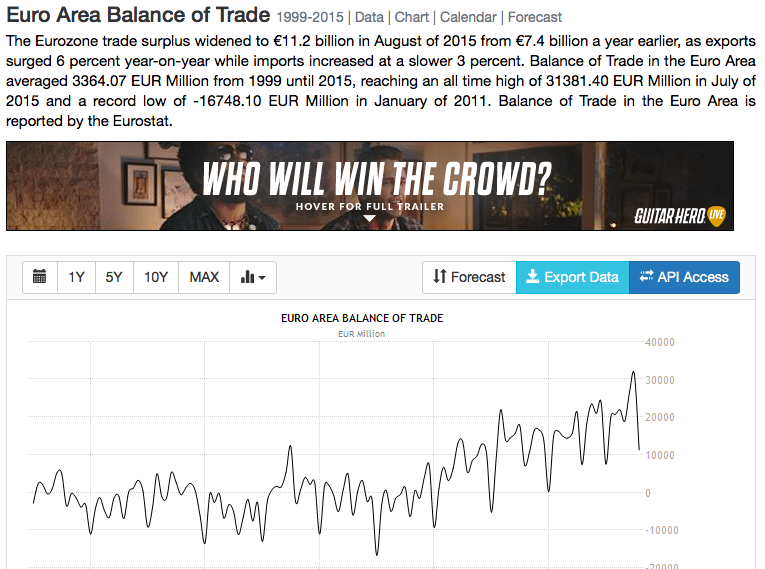
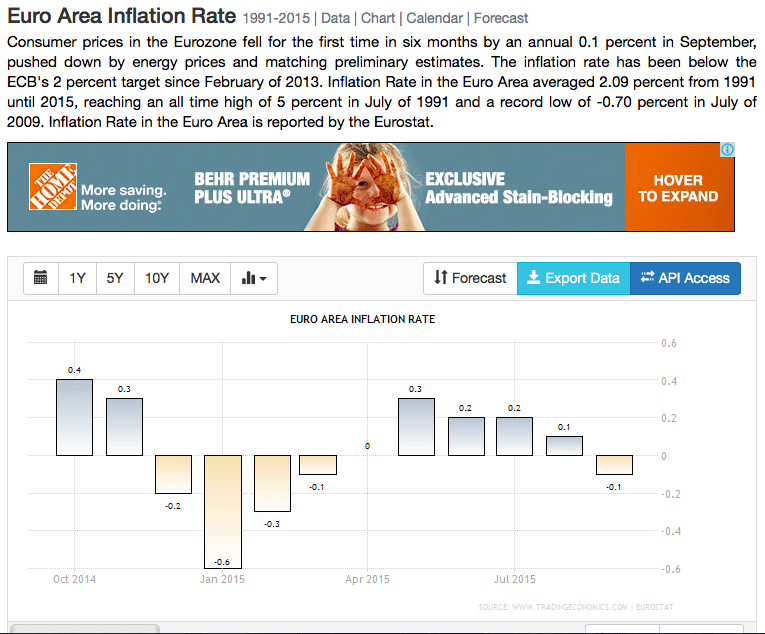
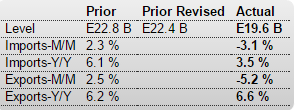
Trade surplus still trending higher along with deflation both make the euro ‘harder to get’ and ‘more valuable’:

European Union : Merchandise Trade
er-10-16-1
Highlights
The seasonally adjusted merchandise trade balance returned a E19.8 billion surplus in August after an unrevised E22.4 billion excess in July. This was the least black ink since March. The unadjusted surplus was E11.2 billion, up from E7.4 billion in August 2014.

The headline reduction reflected mainly a 1.3 percent monthly fall in exports to E169.5 billion, their second successive decline and their lowest level since February. Imports were up 0.2 percent at E149.7 billion, only partially reversing July’s fall. Compared with a year ago, exports now show an unadjusted gain of 6.0 percent and imports a rise of 3.0 percent.

The average surplus in July/August was E21.1B, a drop of only 1.4 percent from the second quarter average. This is probably indicative of, at best, a much smaller contribution from total net exports to third quarter real GDP growth than the 0.3 percentage point boost provided in April-June. Further reason for being cautious about the speed of the Eurozone’s economic recovery.
er-10-16-2
er-10-16-3
er-10-16-4

CPI, Empire State Survey, Philly Fed, Brent Crude Price, Previous Banking Post

CPI, Empire State Survey, Philly Fed, Brent Crude Price, Previous Banking Post

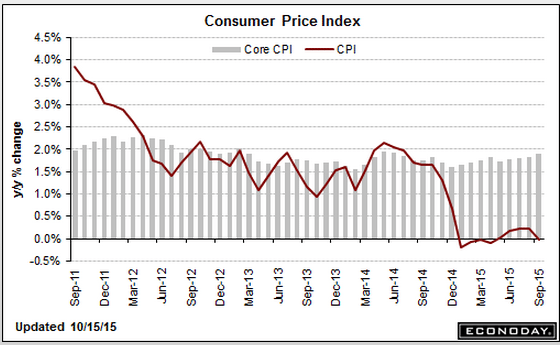
Consumer Price Index
er-10-15-1
er-10-15-2
Empire State Mfg Survey

er-10-15-3
Highlights
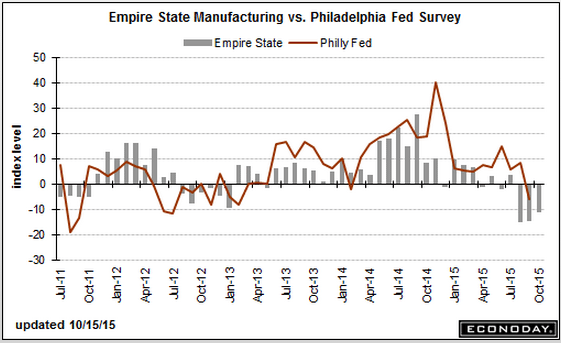
Minus signs sweep the Empire State report with the headline at minus 11.36 which is more than 1 point below Econoday’s low end estimate. Looking at individual readings, new orders are in very deep trouble at minus 18.92 for a fifth straight month of contraction. And manufacturers in the region are not going to be able to turn to unfilled orders to keep busy with this reading extending a long string of contraction at minus 15.09 in September.

Lack of orders is showing up in shipments, which are at minus 13.61 for a third straight contraction, and in employment which is in a second month of contraction at minus 8.49. The workweek is down and delivery times are shortening, both consistent with weakening conditions. Price data show a second month of contraction for finished goods, which is another negative signal, and a narrowing and only marginal rise for prices of raw materials.

This report opens up the October look at manufacturing, and the results will raise talk that weak export markets may be taking an increasing toll on the sector. Watch later this morning for the Philly Fed report at 10:00 a.m. ET where contraction is also expected.

er-10-15-4
Philadelphia Fed Business Outlook Survey

er-10-15-5
Highlights
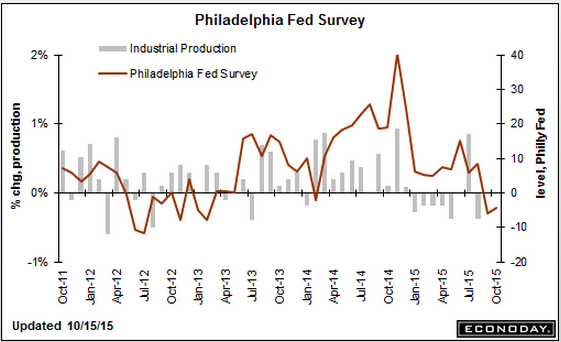
Contraction is seeping into the Mid-Atlantic manufacturing sector. The Philly Fed’s index for October, at minus 4.5, came in just below Econoday’s low-end estimate. This is the second drop in a row but, more importantly, contraction is now appearing in many of the report’s specific indexes including new orders which, at minus 10.6, fell 20.0 points from September. Unfilled orders, at minus 11.7, are extending their long contraction while shipments, at minus 6.1, are down 19.9 points from September. Employment, at minus 1.7, is now in contraction and down 11.9 points in the month. This report confirms the Empire State report released earlier this morning and points to accelerating declines for manufacturing, a sector that appears to be getting hit harder and harder by weak foreign markets.

And look when it peaked:
er-10-15-6
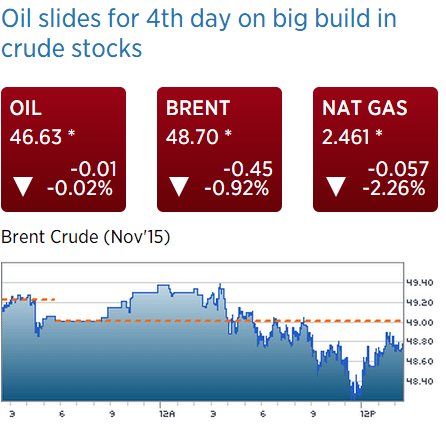
Brent still going lower. Probably keeps going down until Saudis alter their discounts:
er-10-15-7
I posted this Dec 14, 2014, and seems it’s coming into play:

Banking

Deflation is highly problematic for banks. Here’s what happened at my bank to illustrate the principle:

We had a $6.5 million loan on the books with $11 million of collateral backing it. Then, in 2009 the properties were appraised at only $8 million. This caused the regulators to ‘classify’ the loan and give it only $4 million in value for purposes of calculating our assets and capital. So our stated capital was reduced by $2.5 million, even though the borrower was still paying and there was more than enough market value left to cover us.

So the point is, even with conservative loan to value ratios of the collateral, a drop in collateral values nonetheless reduces a banks reported capital. In theory, that means if the banking system needs an 8% capital ratio, and is comfortably ahead at 10%, with conservative loan to value ratios, a 10% across the board drop in assets prices introduces the next ‘financial crisis’. It’s only a crisis because the regulators make it one, of course, but that’s today’s reality.

Additionally, making new loans in a deflationary environment is highly problematic in general for similar reasons. And the reduction in ‘borrowing to spend’ on energy and related capital goods and services is also a strong contractionary bias.

German Trade, Japan

Exports down but so are imports, indicating a weak global economy and continued euro support from trade net flows:

Germany : Merchandise Trade
er-10-8-1

German exports plunge at fastest pace since global financial crisis

Oct 8 (Reuters) — German exports plunged in August. Data from the Federal Statistics Office showed seasonally-adjusted exports sliding by 5.2 percent to 97.7 billion euros month-on-month, the steepest drop since January 2009. Imports tumbled by 3.1 percent to 78.2 billion euros, the biggest one-month decline since November 2012. Germany’s trade surplus narrowed to 19.6 billion euros. Germany’s auto industry accounts for roughly one in five jobs. It accounted for 17.9 percent of Germany’s 1.1 trillion euros ($1.25 trillion) in exported goods last year.

Out of the frying pan and into the fire:

Japan : Machine Orders
er-10-8-2
Highlights
Core machine orders retreated for a third month in August. Core machine orders sank 5.7 percent on the month – expectations were for an increase of 3.2 percent. The monthly decline followed drops of 3.6 percent in July and 7.9 percent in June. On the year, orders were 5.2 percent lower. Total orders plunged 14.6 percent.

Manufacturing orders slid 3.2 percent while nonmanufacturing orders dropped 6.1 percent on the month. In an indication of weak international trade, overseas orders plummeted 26.1 percent on the month.

Needless to say, the government downgraded its view – said orders are marking time. Core machine orders are considered a proxy for private capital expenditures.

Japan out of deflation, Kuroda says

Oct 8 (Nikkei) — Japan has exited deflation and the overall inflation trend has risen steadily, Bank of Japan Gov. Haruhiko Kuroda said Wednesday. Kuroda emphasized price hikes, arguing that daily and weekly price indexes show a significant change from last year. Growth in the UTokyo Daily Price Index, which tracks changes in supermarket prices using data from Nikkei Inc., is hovering near 1.5%. Companies are passing higher labor and other costs on to customers, who are accepting the resulting price increases. Kuroda hinted that even a cut to inflation projections caused by the slump in crude oil would not be enough to merit more stimulus.

Japan’s August core machinery orders down 5.7% on month

Oct 8 (Kyodo) — Japan’s core private sector machinery orders fell a seasonally adjusted 5.7 percent in August from the previous month to 759.4 billion yen ($6.33 billion). The government cut its basic assessment, saying core machinery orders are “at a standstill.” Orders from the manufacturing sector dropped 3.2 percent to 347.9 billion yen in August, down for the third straight month, while those from the nonmanufacturing sector slid 6.1 percent to 422.1 billion yen for the second straight monthly fall. Overseas demand for Japanese machinery, an indicator of future exports, plunged 26.1 percent to 872.3 billion yen.

Japan service sector sentiment worsens in September

Oct 8 (Economic Times) — Japan’s service sector sentiment index fell to 47.5 in September, a Cabinet Office survey showed on Thursday. The survey of workers such as taxi drivers, hotel workers and restaurant staff – called “economy watchers” for their proximity to consumer and retail trends – showed their confidence about current economic conditions slipped from 49.3 in August. The outlook index, indicating the level of confidence in future conditions, rose to 49.1 in September from 48.2 the previous month. The Cabinet Office started compiling the data in comparative form in August 2001.

Challenger Job Cuts, Claims, ISM Manufacturing, Construction Spending

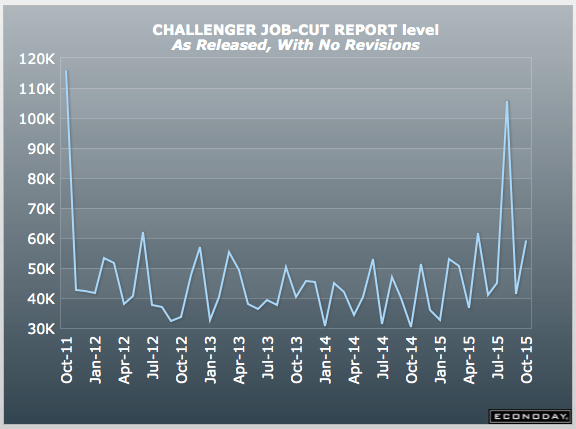
Looks like it started trending higher after oil prices collapsed:
er-10-3
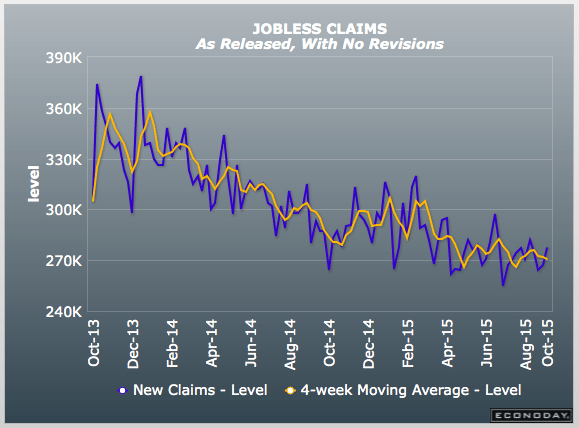
Nothing happening here yet, I suspect it’s at least partially about restrictions on eligibility, etc.
er-10-4
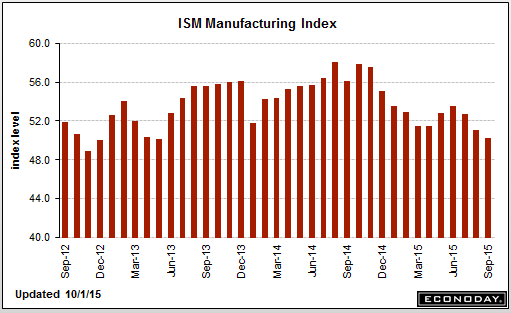
Bad:

United States : ISM Mfg Index
er-10-1-5
Highlights
The ISM index, like nearly all other September indications, is pointing to trouble for the factory sector. At 50.2, the index is at its lowest point since May 2013. New orders, at 50.1, are at their lowest point since August 2012. Backlog orders, at a very low 41.5, are in their fourth month of contraction and won’t be giving manufacturers much breathing room to keep up production. Export orders, at 46.5, are also in their fourth month of contraction and are a key factor behind the general weakness.
er-10-6

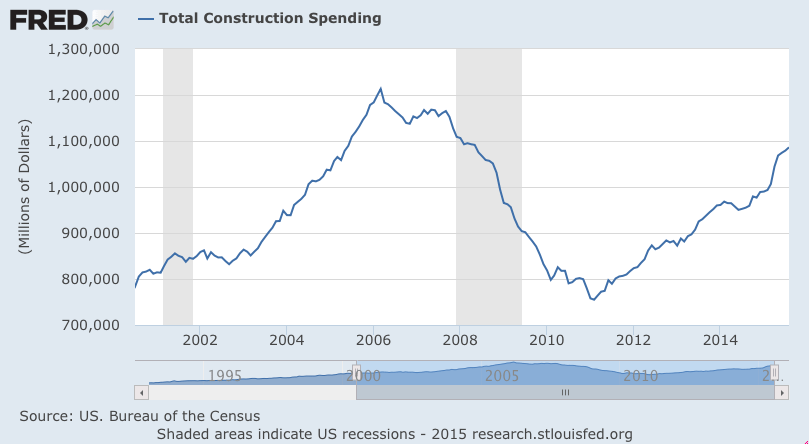
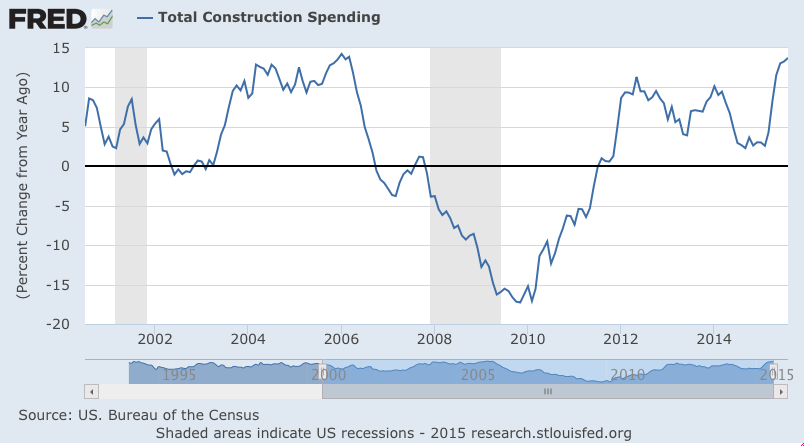
July revised down .3 and August .1 higher than expected. And the elevated year over year growth rate is vs a dip last year. Looking at the chart below you can see the rate of growth has resumed at the lower, prior levels, and that the level of spending spending, which is not inflation adjusted, remains below prior levels, and on an inflation adjusted basis construction remains depressed. Not to mention the spike in permits, exacerbated by NY tax breaks that expired June 15, seems to have reversed:

United States : Construction Spending
er-10-1-7
Highlights
Construction spending is picking up, at plus 0.7 percent in August for a year-on-year gain of 13.7 percent. Construction of single-family homes rose a solid 0.7 percent in the month with continuing gains certain given strength in permits. Multi-family construction, driven by rising rents, jumped 4.8 percent in the month and is up 25 percent year-on-year. The year-on-year gain for single-family homes is lagging but is still very strong at 14.0 percent.

Gains were also posted in private non-residential construction, at 0.2 percent following July’s 1.6 percent jump, with gains continuing to be centered in manufacturing in strength that belies other indications of weakness in business investment. Year-on-year, non-residential construction is up 17 percent. Public construction remains subdued with year-on-year gains in related components in the mid-single digits.

Strength in construction, including strength in new homes, looks to offset not only unevenness in existing home sales but also what appears to be a breaking down in the factory sector.
er-10-8
er-10-9
er-10-10