mtg purch apps, Empire survey, industrial production

Still up from last year this time but seem stalled out at relatively low levels and Q2 not any better than Q1:

United States : MBA Mortgage Applications
er-7-15-1
Highlights
Weekly data are often volatile and it’s hard making much of the last two weeks of purchase applications data which plunged 8.0 percent in the July 10 week after spiking 7.0 percent in the prior week. Put together, the purchase index has slipped 1.4 percent in the two weeks which is a negative signal for home purchases. The refinance index rose 4 percent in the week. Rates were little changed in the week with the average 30-year mortgage for conforming loans ($417,000 or less) unchanged at 4.23 percent.
er-7-15-2

Not encouraging and yet another reference to weak US exports:

United States : Empire State Mfg Survey
er-7-15-3
Highlights
The manufacturing sector isn’t picking up any steam this month based on the Empire State index which came in only just above zero, at 3.86. The new orders index, ominously, is in negative ground at minus 3.50. This is the fourth negative reading in five months for new orders which points squarely at slowing overall activity in the months ahead.

And hiring this month has slowed, to 3.19 vs June’s 8.65 in yet another soft signal. Price data show moderation for inputs at 7.45 vs 9.62. One plus in the report is a slight uptick in the 6-month outlook to 27.04 vs 25.84.

Hit by weak exports, the manufacturing sector is dragging down U.S. growth. Watch Thursday for the Philly Fed report for July which, in what may prove to be an outlier, showed surprising strength in June.
er-7-15-4

Not good, and another reference to weak US exports:

United States : Industrial Production
er-7-15-5
Highlights
A plus 0.3 percent rise in June industrial production looks respectable but still overstates strength. The gain follows two prior months of sizable contraction, at minus 0.2 percent and minus 0.5 percent, and reflects a jump higher for utilities and for mining. Manufacturing, and the key component for the series, is unchanged for a second straight month — truly dead in the water at a year-on-year rate of only plus 1.8 percent.

Motor vehicle production is very weak
in the June report, down 3.7 percent and more than offsetting a 0.8 percent rise for hi-tech production, a 0.7 percent gain for chemicals, and a 1.4 percent jump for furniture. Retail sales of vehicles surged back in May but turned lower in June which doesn’t point to much of a rebound for vehicle production later this summer.

One sign of strength is a 2 tenths uptick in the overall capacity utilization rate to 78.4 percent. But here too, the gain reflects gains for utilities and mining and not manufacturing where capacity utilization actually fell 1 tenth to 77.2 percent.

This report offers the first conclusive data on the manufacturing sector during June while this morning’s earlier release of the Empire State report offers the first anecdotal look at July. And the verdict? A manufacturing sector that is being hurt by weakness in exports and that’s dragging down the economy’s growth.
er-7-15-6

er-7-15-7

er-7-15-8

business inventories and sales

Looks to me like business is likely to be cutting output to reduce inventories:

Business Inventories
bi-s-7-14-1
Highlights
Business inventories, up 0.3 percent, rose modestly in May in line with sales which rose 0.4 percent. The stocks-to-sales ratio held unchanged at 1.36. Components show no builds for either factory or retail, which is a plus given softness in both sectors, but a large 0.8 percent build for wholesalers where however sales were strong enough to keep the sector’s stock-to-sales ratio unchanged.

A modest inventory build isn’t a plus for the second-quarter GDP calculation but is a plus for the production and employment outlooks which benefit from lean inventories.
bi-s-7-14-2
Sales don’t look so good either:

bi-s-7-14-3
bi-s-7-14-4

NFIB index, retail sales, Redbook retail sales

When it was going up it made headlines.
On the way down not a word…

United States : NFIB Small Business Optimism Index
er-7-14-1
Highlights
Small business optimism fell very sharply in June, down 4.2 points to 94.1 with 8 of 10 components falling and pointing to weakness for the second half of the year. Earnings, which were the big strength in May, fell 10 points followed by current job openings and the outlook for company expansion which both fell 5 points. The only gainer in the month was inventory plans which rose sharply. Today’s report, like the June employment report, could be a surprise signal for slowing ahead.
er-7-14-2

On track with the general narrative that Q2 isn’t looking any better than Q1, and that we could already be in recession, depending on inventory adjustments and June trade data.

United States : Retail Sales
er-7-14-3
Highlights
The second-quarter suddenly doesn’t look very strong as retail sales for June, showing broad weakness, came in way below expectations, at minus 0.3 percent. Motor vehicles were part of the reason, excluding which sales came in at only minus 0.1 percent. But excluding both autos and gasoline, core sales fell 0.2 percent.

The bounce back for gasoline prices has given gas station sales a lift the last couple of months, up 0.8 percent in June following May’s 3.7 percent surge. And there’s also two strong gains for the key general merchandise category which is up 0.7 percent and 1.4 percent the last two months. Electronic & appliance stores also show a solid gain, up 1.0 percent in June.

But that’s where the good news stops. Auto sales, though still at strong levels, fell 1.1 percent against an unusually strong May. Furniture sales fell 1.6 percent, apparel fell 1.5 percent, building materials fell 1.3 percent, and restaurants fell 0.2 percent.

The fall in restaurant sales doesn’t speak to the strong levels of consumer confidence that are being reported, readings that the Fed has been pointing to as a future indicator of strength for consumer spending. A look at year-on-year sales underscores the complete lack of consumer punch, at only plus 1.4 percent for total retail sales and only plus 2.7 percent for the core. This is a very disappointing report that will cut second-quarter GDP estimates and that will likely push back the outlook for the Fed’s rate hike from September to December, at least for now.

er-7-14-4

er-7-14-5

er-7-14-6
And, coincidentally, the retail sales report’s year over year gain of 1.4% matches the Redbook report:

United States : Redbook
er-7-14-7
Highlights
This morning’s retail sales report for June was very weak as are Redbook’s early indications for July with same-store year-on-year sales up only 1.4 percent in the July 11 week. Redbook’s sales rate, up until March, had trended in the 3 percent range. Still, Redbook sees sales picking up later this month and sees a slight gain compared to June.
er-7-14-8

Fed labor market index, ISM non manufacturing index, Bank lending, Greece

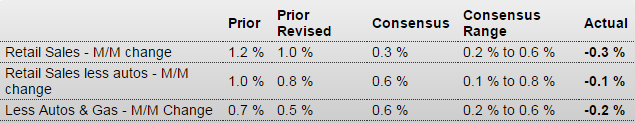
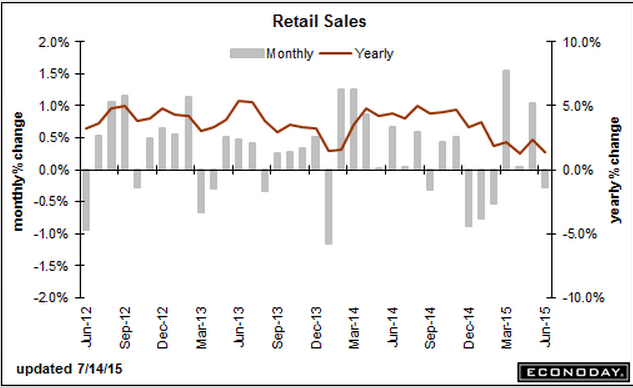
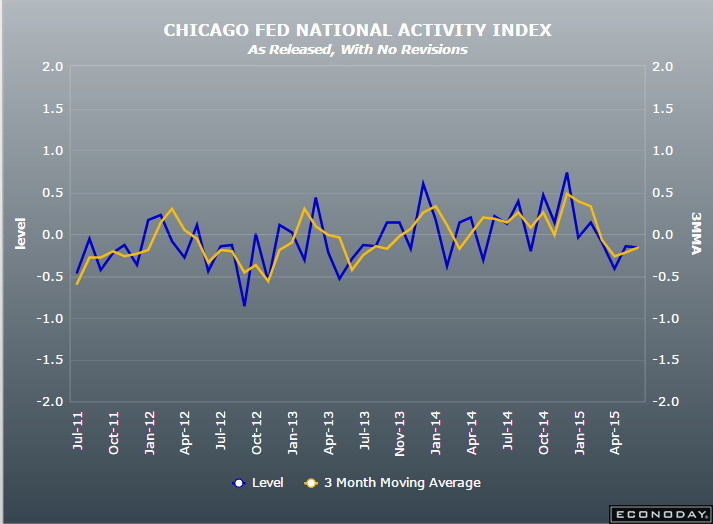
Prior month revised lower and this month lower
so Fed that much less likely to raise rates:

Labor Market Conditions Index
er-7-6-1
Highlights
Growth in the nation’s labor market remains subdued with the labor market conditions index at plus 0.8 in June vs a revised plus 0.9 in May. The reading is barely over zero and underscores last week’s soft employment report. The Fed won’t be any hurry to begin raising its overnight policy rate based on June’s employment data.

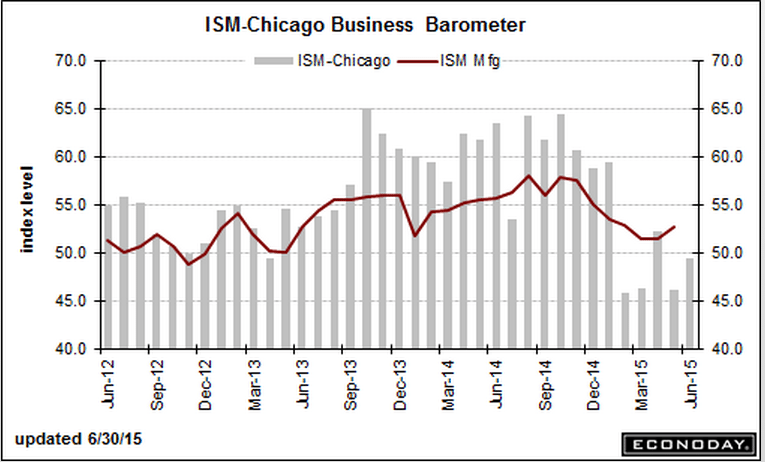
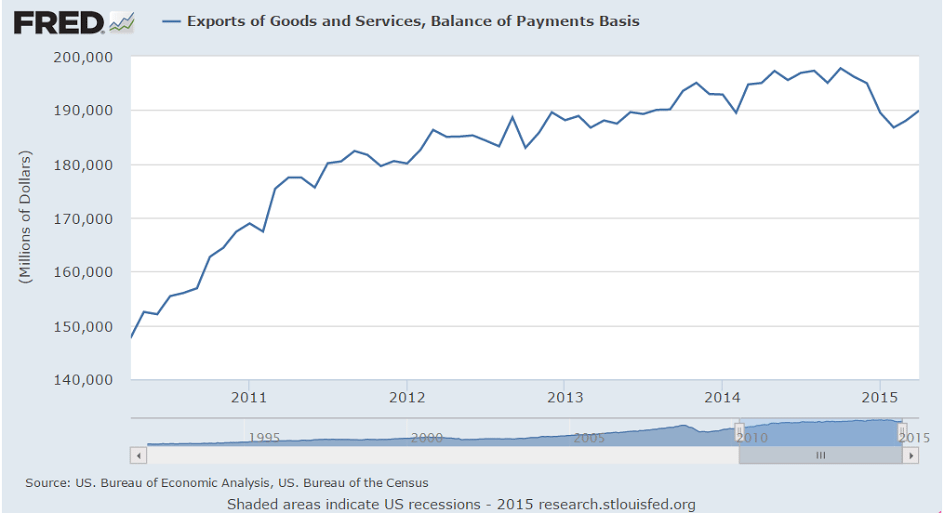
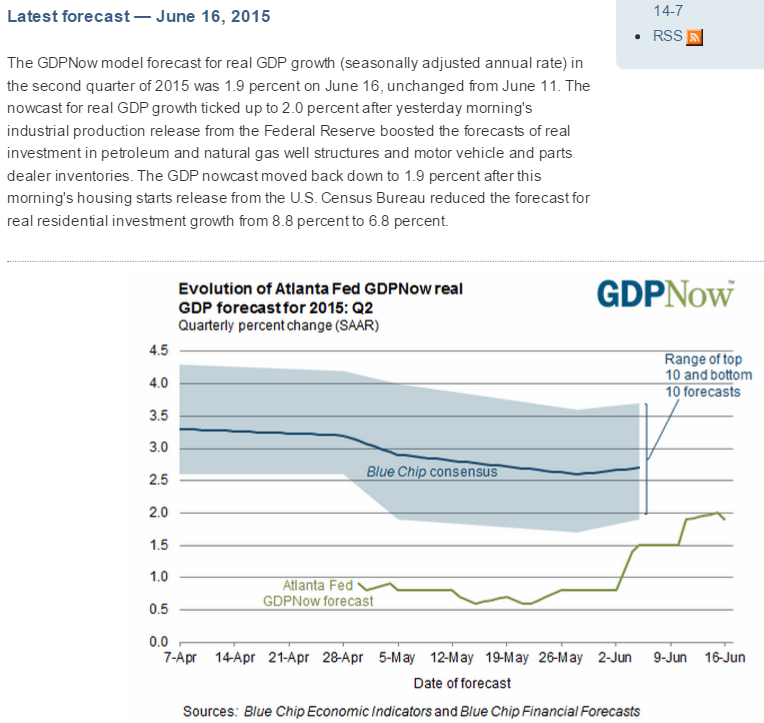
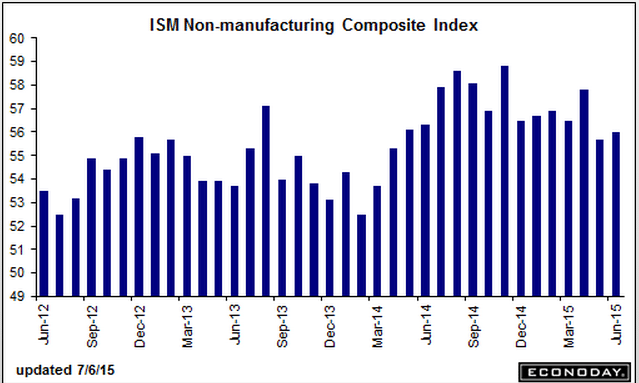
Ok, number but less than Q1, with export orders and employment growth slowing:

ISM Non-Mfg Index
er-7-6-2
Highlights
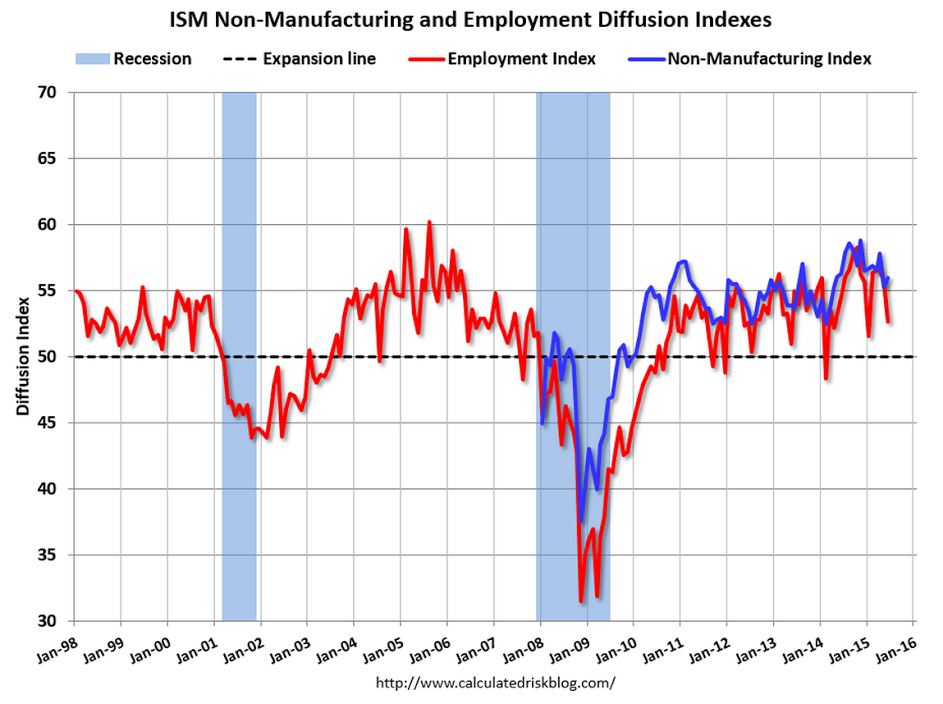
Rates of growth in ISM’s non-manufacturing report held steady and solid in June, at a composite index of 56.0 for a 3 tenths gain from May. New orders are strong, at 58.3 for a 4 tenths gain with backlogs back over 50 at 50.5 for a 2 point gain. Growth in export orders slowed but still held over 50 at 52.0 in a reminder that services exports, unlike goods exports, are in surplus.

Other readings include a strong reading for business activity, up 2.0 points to 61.5, a gain offset by slowing in employment to 52.7 from a strong four-month streak over the 55 level. The report’s price reading slowed slightly to 53.0, a soft level contrasting with inflationary signals in this morning’s PMI service report.

A strong signal in this report is wide breadth among 18 industries with 15 showing growth with two of the exceptions, however, including mining and construction. Contraction in the latter is a surprise given wide indications of growth in housing.

This report is solid but, together with the PMI services index, point to a lack of acceleration for the end of the second quarter.
er-7-6-3
er-7-6-4

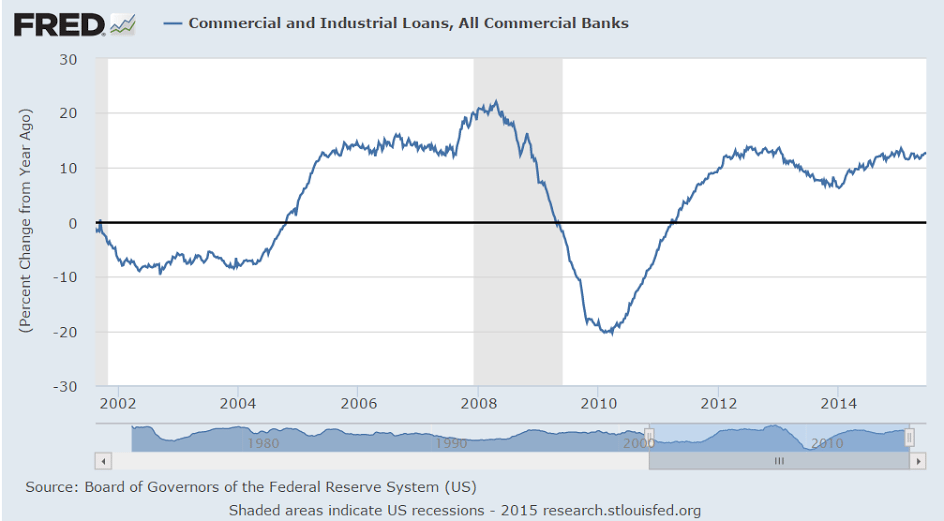
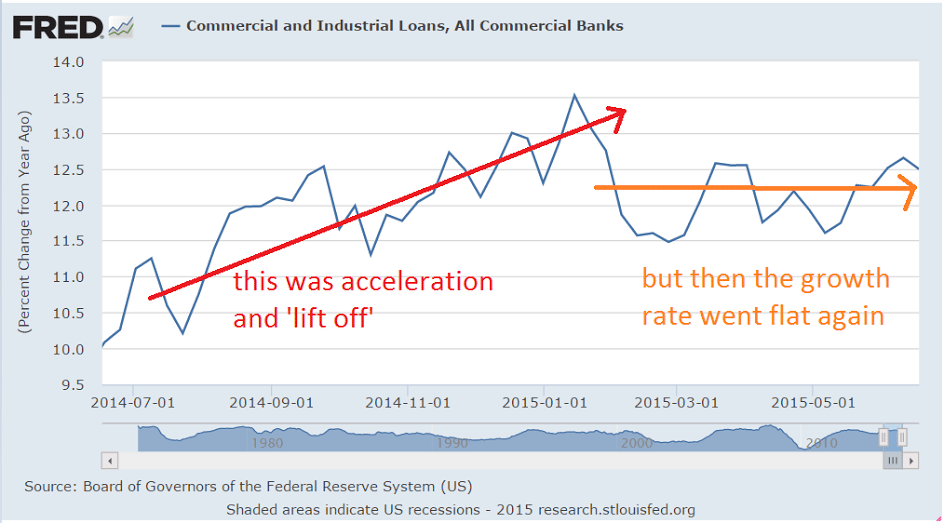
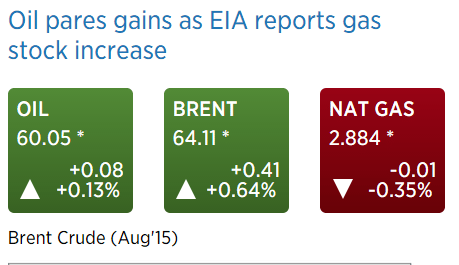
To my point right after oil prices fell- banks will see large declines in the value of collateral backing their loans which could lead to capital write downs and institution specific lending restrictions, further dampening sales, output, and employment:

Banks Face Curbs on Oil, Gas Lending

By Gillian Tan, Ryan Tracy and Ryan Dezember

July 3 (WSJ) — U.S. regulators are sounding the alarm about banks’ exposure to oil-and-gas producers, a move that could limit their ability to lend to companies battered by a yearlong slump in prices.


The Federal Reserve, Office of the Comptroller of the Currency and Federal Deposit Insurance Corp. are telling banks that a large number of loans they have issued to these companies are substandard, said people familiar with the matter, as they issue preliminary results of a joint national examination of major loan portfolios.

The substandard designation indicates regulators doubt a borrower’s ability to repay or question the value of the assets that back a loan. The designation typically limits banks’ ability to extend additional credit to the borrowers.


The move could add an extra obstacle to companies struggling with high debt loads amid lower prices for the oil and natural gas they produce. Banks have been flexible with troubled energy companies to avoid triggering a flood of defaults and bankruptcy filings, but regulatory pressure could force them to tighten the purse strings.


This year’s Shared National Credit review process contrasts with those in prior years, when regulators didn’t broadly disagree with the banks’ own ratings of credit facilities known as reserve-based loans, the people said. But regulators are paying closer attention to these loans amid worries that a sustained slump in energy prices could lead to big losses for banks, they added.

Twice a year, banks themselves review the value of oil and gas deposits that companies have the right to extract and use as collateral for bank loans. Declines in commodity prices can prompt lenders to reduce their commitments to companies. The effects of such reductions can cascade through energy companies’ capital structures and require them to look elsewhere for funds.

Earlier this year, a number of energy producers sold bonds, took out term loans or sold new shares to replace shrinking reserve-based loans. While some of those moves were forced, others were pre-emptive.

Large energy lenders include Wells Fargo & Co., J.P. Morgan Chase & Co. and Bank of America Corp.

Regulators declined to discuss their conversations with specific banks but have been raising concerns about energy loans. On Tuesday, the OCC, in a semiannual report on emerging risks, said it is monitoring oil-and-gas production loans and said the “significant decline in oil prices in 2014 could put pressure on loan portfolios.” The report didn’t detail the examination of reserve-based loans.

The latest effort comes amid a broader crackdown on lending that regulators consider risky. In 2013, the Fed, OCC and FDIC issued guidance to deter banks from issuing leveraged loans that would increase the companies’ debt loads to levels they consider too high.

Bankers said they are concerned that this latest effort could push some struggling borrowers over the edge, which could, in turn, create more pain for the banks.

“They’re taking a broad brush to the entire sector and not really differentiating between secured and unsecured loans,” one senior leveraged-finance banker said of regulators’ treatment of reserve-based loans.

A number of energy companies already have filed for bankruptcy protection, and others are exploring options to raise capital or restructure their debt loads.

So far, the suffering hasn’t been as widespread as was initially feared when prices plummeted last year.

Bankers are selectively appealing some substandard ratings, especially for companies that can reduce spending and pay down some debt, said people familiar with the matter.


But for the companies that retain the negative rating, any issuance of new debt will likely need to reflect an improvement in creditworthiness, the people said. Options include the addition of loan terms known as covenants, which protect lenders but can increase a company’s risk of default.


Banks may turn to equity or bonds to supply additional financing to borrowers with the substandard designation, some of the people said, though both are costlier for companies than loans.

Analysts expect the oil slump to begin taking a greater toll on companies this fall, when banks review their reserve-based loans. In a note to clients this week, Wells Fargo Securities analysts said that only 30% of the expected oil output in 2016 from the companies they track has been presold at above-market prices, versus 56% of crude production that was hedged this year.


The analysts also said the prolonged period of lower revenue could push more companies closer to violating agreements with creditors to maintain certain profitability levels, and that they expect stock investors to be “more discerning” when offered new shares from heavily indebted companies.

The ECB has begun the move to remove the eligibility of Greek debt as collateral for ECB loans:

ECB maintains emergency assistance for Greek banks, but adjusts haircut on collateral

By Everett Rosenfeld and Matt Clinch

Now that the EU realizes it doesn’t need Greece, the terms are unlikely to be altered. With Greek leadership still committed to staying with the euro and the EU, they take on the role of beggars.

“Even if it came to a collapse of some individual banks, the risk of contagion is relatively small,” Schaeuble told Bild. “The markets have reacted with restraint in the last few days. That shows that the problem is manageable.”

Greek Leaders Says Goal Is to Secure Country’s Financing

By By Eleni Chrepa and Constantine Courcoulas

July 5 (Bloomberg) — Greek party leaders seek solution that secures country’s financing needs, reforms, growth plan and talks on Greek debt sustainability, according to joint statement sent by the Greek president’s office.
Immediate priority is to restore liquidity for Greek economy in cooperation with the ECB
Joint statement signed by Greek PM Alexis Tsipras, acting New Democracy leader Evangelos Meimarakis, Potami party leader Stavros Theodorakis and Pasok party leader Fofi Gennimata
NOTE: Earlier, Greek Showdown Looms With Europe Demanding Tsipras Make Move Link


*GREEK LEADERS: REFERENDUM GIVES NO MANDATE FOR RUPTURE

The call for humanitarian aide puts Greece in a category with other depressed nations seeing that kind of assistance, as Greece turns into a footnote:

European Parliament president: Need to urgently discuss humanitarian aid for Greece

July 5 (CNBC) — European institutions need to urgently discuss a humanitarian aid program for Greece, the …

Redbook retail sales, Chicago PMI, CS house price index, consumer confidence

This measure of retail sales remains surprising depressed, even to me:

United States : Redbook
er-6-30-1
Highlights
Redbook’s sample continues to report stubbornly low sales rates, at a same-store year-on-year plus 1.7 percent in the June 27 week. Month-over-month, Redbook’s call is a sharp 1.5 percent contraction for June in what is a negative signal for the government’s core ex-auto ex-gas reading. The report says sales following Father’s Day were depressed though retailers expect to see strength going into the July 4 holiday. This report, which first swung lower in March, did not pick up the strength in May and is not likely to shape forecasts for June.
er-6-30-2

And another bad one:

Chicago PMI
er-6-30-3
Highlights
Chicago’s PMI sample remains surprisingly depressed, at a June index of 49.4 which is noticeably below the Econoday consensus for 50.6. June is the 4th contractionary reading (sub-50) of the last five months.

The sample’s employment is the lowest since November 2009 with backlog orders the lowest since September 2009. Note that weakness in backlogs is a clear negative for future employment. Production, like the main index, is in contraction for the 4th time in five months.

But leading the positive side of the report are new orders which are now back above 50. And in a special question, respondents are cautiously optimistic that new orders will begin to pick up in the third quarter
er-6-30-4

Also below expectations and decelerating:

S&P Case-Shiller HPI
er-6-30-5
Highlights
Growth in home prices slowed sharply in April, up only 0.3 percent for Case-Shiller’s 20-city index which is 5 tenths below Econoday’s consensus and 2 tenths below the low forecast. The year-on-year rate, at plus 4.9 percent, is 5 tenths below the consensus and 1 tenth above the low end.

For the first time since all the way back in September, minus signs suddenly appear on the city breakdown list with 8 of 20 cities showing contraction in April. Cleveland shows the sharpest monthly contraction at minus 0.5 percent followed by Atlanta and Chicago at minus 0.4 percent each.

But several on the plus side show significant strength led by Minneapolis at a monthly plus 1.0 percent followed by Denver, Detroit and Las Vegas at plus 0.9 percent. Year-on-year, Denver and San Francisco lead the list at plus 10.3 and 10.0 percent with Dallas in third at plus 8.8 percent. Those showing the least year-on-year growth are Washington DC at plus 1.1 percent, Cleveland at plus 1.3 percent, and Boston at plus 1.8 percent.

But weakness in this report, where monthly readings are actually 3-month averages, reflects the weak sales conditions in the early part of the year, conditions which reversed strongly in May and which point to price strength for the May edition of this report. The next hard data on housing will be construction spending on tomorrow’s calendar.
er-6-30-6

Nice pick up in confidence to get back towards Q1 levels:
er-6-30-7

China cuts rates, Atlanta Fed, car sale comment, Greek PM comments

As the carpenter said about his piece of wood, ‘no matter how much I cut off it’s still too short’:

China’s central bank cut its benchmark lending rates by 25 basis points to 4.85 percent on Saturday, the fourth reduction since November, as it gears up to lower borrowing costs and support a slowing economy.

The People’s Bank of China (PBOC) also reduced one-year benchmark deposit rates by 25 basis points to 2 percent, it said in a statement on its website, adding that the reductions would take effect on Sunday.

atl-nowcast-6-29
Yes, car sales are up a bit, but seems import content is growing so it’s working against US GDP and employment?

Number of ‘American-made’ autos drops to new low

By Phil LeBeau

So why would the Prime Minister do this?

The Greek banks are ECB members, regulated and supervised by the ECB, with liquidity provided by the ECB. Should liquidity end, the ECB via the Bank of Greece simply stops making payments on that bank’s behalf. And why close the banks and prevent them from performing ongoing bank services that don’t require ECB liquidity, should it not be available as needed? Just more evidence that the Greek leaders aren’t playing with a full deck, so to speak…

Greek PM calls for bank closures, capital controls

By Phillip Tutt

June 29 (CNBC) —Despite a tweet from Greek Finance Minister Yanis Varoufakis that his government “opposed the very concept” of any controls, Greek Prime Minister Alexis Tsipras said later Sunday that he had forced the country’s central bank to recommend a bank holiday and capital controls.

credit check response to comment

Yes, and the rate of growth is lower than the last cycle, and steady to lower, not ‘accelerating’, and in any case note that it jumped up going into the last recession.
cc-6-29-1
cc-6-29-2
And commercial paper isn’t growing as was the case in the last cycle, so that element of total credit remains flat and depressed.

I see no evidence yet of ‘lift off’ from Q1 to Q2, only a very modest bounce of a few indicators and a strong possibility of Q2 being 0 should inventory/sales continue to revert and net imports be larger than expected as the last report looked like a zig that’s always followed by a zag:
cc-6-29-3
cc-6-29-4
cc-6-29-5
cc-6-29-6
cc-6-29-7
Port strike and price influence:
cc-6-29-8
cc-6-29-9
zigs up followed by zags down:
cc-6-29-10
Net exports decreasing again, and now oil is a bit higher and US production growth has slowed and likely turned negative in June, with oil consumption up a bit, adding to oil imports. And non oil imports have been rising with the strong dollar, which has also dampened US export growth. Furthermore, the global drop in capex due to lower oil prices looks to have reduced US exports as well.
cc-6-29-11
cc-6-29-12

Durables charts, new home sales,FHFA House Price Index, Japan PMI, GDP, Atlanta Fed, Mtg. purch apps, oil comment

Longer term year over year view not looking so good:
er-6-24-1

er-6-24-2

er-6-24-3

er-6-24-4

er-6-24-5
The cheer leading continues, and sales in the Northeast up 87% looks a bit unsustainable?

New Home Sales
er-6-24-6
Highlights
The lift off for housing is appearing more and more like it’s straight up. New home sales rose 2.2 percent in May to an annual rate of 546,000 which is 6,000 above the high end Econoday forecast. Add to this is a 27,000 upward revision to the two prior months with April now standing at 534,000 for a big 8.1 percent monthly gain.

The surge in sales is making for a strong seller’s market with supply relative to sales down to a very thin 4.5 months vs 4.6 months in April. Total new homes on the market stand unchanged at 206,000. The lack of supply risks becoming acute and will doubtlessly speed up construction activity led by permits which, in data posted last week, have been jumping.

Lack of supply will prove to be a positive for sales prices, which however, are down in the latest report, 2.9 percent lower to a median $282,800. Year-on-year, the median price is down 1.0 percent vs the year-on-year sales gain of 19.5 percent in a mismatch that points to price acceleration ahead.

Regional sales data show a strong 13.1 percent rise in the West where year-on-year sales are up 25.5 percent. The South, which is larger than all the other regions combined in this report, has the strongest year-on-year rate at 33.3 percent though monthly sales in May dipped 4.3 percent. Sales have been soft in both the Northeast and Midwest where year-on-year rates are in the negative column though the Northeast is showing monthly strength in this report.

Yesterday’s existing home sales report was very positive as is today’s report, both of which add to other data that put housing at the top economy right now for a sector that can offset stubborn weakness in the manufacturing economy.
er-6-24-7

Seems like a stretch to call this ‘lift off’???
er-6-24-8
And price gains have at least moderated?
er-6-24-9
Another PMI goes negative. And note that exports are up, in contrast to the US:

Japan : PMI Manufacturing Index Flash
er-6-24-10
Highlights
The flash manufacturing PMI for June indicated a slight deterioration in operating conditions at Japanese manufacturers. Production growth slowed to a fractional pace, while new orders contracted for the third time this year so far. Subsequently, employment growth was subdued, while buying activity declined. The flash manufacturing reading was 49.9, down from the May final of 50.9. Output increased, though at a slower rate. Employment increased but at a slower rate. Both output and input prices increased at a faster rate.

While new orders changed direction and decreased, export orders increased at a faster rate. Reports of a favorable exchange rate and an increase in foreign demand led to a further rise in new export orders in June. Moreover, the latest expansion was the second-fastest since January and quicker than the series average.

As expected, still negative, still only a minor weather bounce to Q2 so far:

GDP
er-6-24-11
Highlights
The second revision to first-quarter GDP came in as expected, at minus 0.2 percent. Exports were near the top of the negative side, reflecting the strong dollar’s negative effect on foreign demand. A rise in imports was the quarter’s biggest negative.

The heavy weather of the quarter contributed to an outright contraction in business spending (nonresidential fixed investment) and an abrupt slowing in consumer spending (personal consumption expenditures).

Despite PCE slowing, spending on services, that included an upward revision for restaurants, was the strongest component in the first quarter. Also adding to GDP was an inventory build, one however that was largely unwanted and tied to the quarter’s severe weather and port slowdown. Residential investment was also a positive. The GDP price index was unchanged in the quarter.

First-quarter 2015 wasn’t as badly hit as first-quarter 2014 when GDP sank 2.1 percent, a dip that was then reversed by a 4.6 percent bounce back in second-quarter 2014. Estimates for this second quarter’s GDP growth are settling into the 2 to 3 percent range. We’ll get yet another look at the first quarter with annual revisions on July 30.

I’m sure the Fed sees this:
er-6-24-12

Marginally better:
er-6-24-13

Now 18% over last year. Better, but bank credit numbers don’t show an increase and all cash purchases are down as a % of purchases:

MBA Mortgage Applications
er-6-24-14

Highlights
After swinging up-and-down the past few weeks, mortgage applications inched higher in the June 19 week. Purchase applications rose 1.0 percent with refinancing applications up 2.0 percent. Year-on-year, purchase applications are up a very strong 18.0 percent. Mortgage rates dipped in the week with the average for conforming loan balances ($417,000 or less) down 3 basis points to 4.19 percent.

More signs that US production has peaked and maybe starting to decline, which will mean increased petroleum imports and a higher trade deficit:
er-6-24-15

Existing home sales, Chicago Fed, Greece

Up some but still at depressed levels, and not enough to indicate a general bounce in spending. Personally I sold come small condos in Chicago I’d owned since working there in the early 1980’s. I got tired of fooling with them, net rental income was low, and prices weren’t going anywhere, And I still have 2 nice houses for sale, one in Jupiter Farms, another outside of Orlando, that haven’t sold yet and are priced well below 2007 levels. They are reconditioned foreclosures from the portfolio of the bank I sold 2 years ago.

So activity is up some, prices are up but not to replacement cost and also because to some extent the bid hitting from distressed selling has subsided. And there also could have been a few sales in front of the anticipated rise in rates, as often happens.

And watch for all the cheer leading on this report, as below:

Existing Home Sales
er-6-22-1
Highlights
The housing sector is lifting off, as existing home sales jumped 5.1 percent in May to a 5.35 million annual rate that hits the top end of the Econoday consensus. The year-on-year rate tells the story, at plus 9.2 percent which, outside of March’ s 11.9 percent, is the strongest rate in nearly two years. And prices are rising, up 7.9 percent year-on-year at a median $228,700.

In a special sign of strength, sales are strongest for single-family homes, up 5.6 percent in the month to 4.73 million. Year-on-year, single-family sales are up 9.7 percent. Condo sales have been flat in recent reports, up 1.6 percent in May to a 620,000 rate for a year-on-year gain of 5.1 percent. And in yet another special strength, first-time buyers are back in the market, making up 32 percent of all sales vs 27 percent this time last year.

Gains sweep the regional data with the Midwest up 4.1 percent and the West and South up 4.3 percent each. Year-on-year, the biggest gain is in the Midwest at 12.4 percent with the West at 9.0 percent and the South up 6.9 percent.

Holding down sales has been a lack of supply which, relative to sales, is at 5.1 month vs 5.2 in April. In another sign of tightness, the median sales time held steady at 40 days. But the rising sales rate together with the rise in prices are certain to bring new homes to the market. And homes are coming onto the market, to 2.29 million vs 2.20 and 2.01 in the prior two readings.
er-6-22-2
er-6-22-3

No bounce here:

Chicago Fed National Activity Index
er-6-22-4
Highlights
There was net improvement in May’s run of economic data but not much at least based on the national activity index which comes in at minus 0.17 vs a downward revised minus 0.19 in April. The 3-month average is telling the same story of weakness, at minus 0.16 vs a revised minus 0.20 in April.

Much stronger payroll growth, at 280,000, was May’s highlight but the gain was offset by a 1 tenth tick higher in the unemployment rate to 5.5 percent which leaves the month’s total employment contribution to the index unchanged at plus 0.10. Other readings were also little changed and all soft: production-related indicators at minus 0.17 vs April’s minus 0.19, sales/orders/inventories at zero vs minus 0.1, and personal consumption & housing at minus 0.09.

The big bounce, according to today’s report, that was expected following the transitory factors of a very soft first quarter has yet to appear.

Remember the cheer leading last year when the high prints were recorded, just before oil prices fell? And then how the drop in oil price would be fueling/accelerating GDP with forecasts in the 4% neighborhood?
er-6-22-5
It now looks like the Greek leaders have thrown in the towel and offered something likely to be accepted, all as previously discussed (though it was never even close to a ‘sure thing’), showing that deep down the leadership are ‘Europeans’ first who see nationalism as the greater risk, and will work for progressive change within the context of the EU, however slim their odds of success.

And not to say it’s a ‘done deal’ or that rough spots won’t continue. This is politics, with all the associated risks.

DB: Greece: Finally some positive news, much more to go

The details of the new Greek proposal have not been published, but press reports so far suggest they represent a material change in stance for the Greek government. Details reported include the following:

– A broad based increase in VAT rates, inclusive of some foodstuffs and restaurants by 10%;

– An elimination of early retirement benefits from 2016 to be phased in over three years;

– Most importantly, a broad-based increase in pension contributions, reported to be 2% for wage-earners and 2% for corporations;

– An increase in a special “healthcare” charge on pensions equivalent to an across the board cut of 1% in main and 5% cut in supplementary pensions;

– Cuts in defense spending;

– Increases in corporate tax rates to those firms earning more than 500mio EUR profits;

– Increases in income tax rates to those earning above 30k EUR.

Our assessment of the reported changes above is that they represent meaningful concessions from the Greek side, if they are to be confirmed, bringing them closer to the creditor proposals.

Atlanta Fed, Italy trade, mtg purchase apps, oil prices

Up some then back down some, still at a very low rate off of a negative Q1:
er-6-17-1
Down a bit but still positive, as is most all of the euro zone now with the euro at current levels:

Italy : Merchandise Trade

er-6-17-2
Highlights
The seasonally adjusted trade balance was in a E3.5 billion surplus in April, short of a marginally downwardly revised E3.8 billion in March and the smallest excess since September 2014.

The modest deterioration reflected a 0.8 percent monthly fall in exports, their first decline since December, as imports were flat after three successive months of growth. Compared with April 2014 exports rose 9.0 percent, little different from their end of quarter rate (9.1 percent) while imports increased 9.3 percent, also much in line with the previous month’s rate (9.7 percent).

The monthly change in exports was hit by falls in capital goods (3.9 percent) and intermediates (0.4 percent) but boosted by consumer goods (1.3 percent) and, in particular, energy (9.9 percent). Excluding energy exports fell a sharper 1.1 percent. Imports saw broad-based declines amongst the major categories and would have dropped versus March but for an 8.8 percent bounce in energy.

The latest data leave the trade gap at the start of the second quarter some 13.1 percent below its average in the first quarter. In part this will reflect higher oil costs but it also increases the risk of another negative contribution from net exports to real GDP growth.

Back down, not good, but now looking like it was a modest blip up in front of a feared increase in mtg rates that accelerated a few purchases. Still about 15% over last year which just about makes up for the loss of all cash purchases, indicating similar sales but with a shift towards more financing:

United States : MBA Mortgage Applications

er-6-17-3
Highlights
Volatility in interest rates is making for volatility in mortgage applications which fell sharply in the June 12 week, down 4.0 percent for the purchase index and down 7.0 percent for the refinancing index. Mortgage rates moved sharply higher in the week, up 5 basis points for the average 30-year conforming loan ($417,000 or less) to 4.22 percent. But rates have since been coming down this week, following the 10-year Treasury note which, after spiking near 2.50 percent last week, is back near 2.30 percent.

From the MBA:Mortgage Applications Decrease in Latest MBA Weekly Survey

Mortgage applications decreased 5.5 percent from one week earlier, according to data from the Mortgage Bankers Association’s (MBA) Weekly Mortgage Applications Survey for the week ending June 12, 2015. …

The Refinance Index decreased 7 percent from the previous week. The seasonally adjusted Purchase Index decreased 4 percent from one week earlier. The unadjusted Purchase Index decreased 6 percent compared with the previous week and was 15 percent higher than the same week one year ago.

And here’s a chart of housing starts on a per capita basis. It’s not yet up to prior recession lows:

er-6-17-4
The Saudis continue to hold the price in $ constant, however the spread between West Texas and Brent has narrowed, indicating US production may have peaked and be in at least relative decline. This follows the narrative that the collapse in operating drilling rigs leads to production declines as existing wells see their output decline over time.

er-6-17-5