Capex Revision, Gallup Spending Survey, PMI, ISM Non Mfg Index

A gauge of U.S. investment plans slipped more in August than initially estimated, giving a cautionary sign for the economic outlook.

New orders for non-military capital goods outside of aviation fell 0.8 percent in August, the Commerce Department said on Friday.

The government had previously reported that this gauge, which is a leading indicator of business investment, had fallen 0.2 percent during the month.

Shipments of this category of goods also fell, declining a sharper-than-initially reported 0.4 percent and giving a bearish signal for third-quarter economic growth.

New orders for overall U.S. factory goods fell 1.7 percent in August, Friday’s report showed. Analysts had expected new orders for factory goods to fall 1.2 percent.
er-10-5-1

Yet another consumer spending chart that shows it’s been going down since the drop in oil prices that most insisted would cause a sharp increase:
er-10-5-2
The ‘Markit’ surveys aren’t all that credible but do make news:
er-10-5-3
Also lower than expected and more credible, and indicates to me the service sector is now following the manufacturing sector that’s already gone negative. Interesting how the ‘Highlights’ narrative below sees it otherwise:

ISM Non-Mfg Index
er-10-5-4
Highlights
Understandable slowing in new orders and business activity, which have been extraordinarily strong in the two prior reports, pulled down ISM’s non-manufacturing index to a still very solid 56.9 in September.

One component, however, that did not slow and which, had it been released last week, would have sent the wrong signal for the employment report is a 2.3 point jump in the employment index to 58.3. This, together with July’s 59.6, are some of the strongest readings in the 18-year history of this series and a puzzle given softness in the government’s payroll data.

Readings throughout this report are very strong including backlogs which have been building for four straight months and new export orders which have been rising for five months (note that foreign demand for U.S. services has proven very resilient at the same time that foreign demand for U.S. goods has been declining sharply.) The price indication in this report shows slight contraction in contrast to other surveys where price contraction is very sharp.

This report, together with the services PMI released earlier this morning, underscore the fundamental domestic-based strength of the U.S. economy.
er-10-5-5

And now the Fed’s own labor market indicator is suggesting weakness as well:

er-10-5-6

Saudi Price Cut, Domestic Car Sales, Commercial Paper

This is how they would start a downward price spiral if that’s what they wanted:

Saudi Aramco Cuts Crude to Asia, U.S. Amid Weak Demand

By Anthony Dipaola

Oct 4 (Bloomberg) —Saudi Arabia cut pricing for November oil sales to Asia and the U.S. as the world’s largest crude exporter seeks to keep its barrels competitive with rival suppliers amid sluggish demand.
Saudi Arabian Oil Co. reduced its official selling price for Medium grade crude to Asia next month to a discount of $3.20 a barrel below the regional benchmark, compared with a $1.30 discount for October sales, the company said in an e-mailed statement. The discount for the Medium grade to Asia, the main market for Saudi crude, widened by the most since the state-owned company made a $2 a barrel cut in February 2012, according to data compiled by Bloomberg.

Doesn’t look so good (Imports aren’t part of GDP):
er-10-3-1
er-10-3-2

Here’s the foreign car sales:
er-10-3-3
Even total sales don’t look all that stellar.

The growth rate has to match the prior year growth rate to make the same contribution to GDP:
er-10-3-4
er-10-3-6
er-10-3-7

The rest of the bank lending charts haven’t updated yet. Will post when I get the updates.

Employment, Atlanta Fed, Draghi comments

A shocker for most analysts/entirely in line with my narrative of insufficient deficit spending-public or private-to offset unspent income, aka demand leakages. And it’s only going to get worse until appropriate fiscal adjustments are implemented. The cut in oil capex, which was the only thing supporting growth after the tax hikes and sequesters, triggered a downward spiral, with lower employment, lower income, and lower spending working it’s way through the economy.

Employment Situation
er-10-2-1
Highlights
Forget about an October rate hike and maybe forget about a December one too. The September employment report came in weaker than expected on all scores with nonfarm payroll at 142,000, well under the low estimate for 180,000. To seal the matter, downward revisions to the two prior months total 59,000. Average hourly earnings also came in below the low end estimate, at an unchanged reading and a year-on-year rate of 2.2 percent which is also unchanged. And the labor market is shrinking! The labor participation fell 2 tenths to a nearly 40 year low of 62.4 percent.

Note how it all went bad after oil prices collapsed:
er-10-2-2
Back down to .9% on reduced exports, and soon to go lower with the employment revisions:
er-10-2-3
Managing expectations as they rearrange the deck chairs on the Titanic…:

ECB President Mario Draghi Says Eurozone Returning to Growth After Policy Moves

Oct 2 (WSJ) — ECB President Mario Draghi said the eurozone had returned to “sustained growth, under the impulse of our monetary policy.” The results were “good news for everybody, everywhere,” he said. Mr. Draghi said the eurozone accounts for 17% of global GDP and 16% of global trade, so the strength of the eurozone was critical to maintain at a time of uneven global growth. “The progress achieved over the past three years to stabilize and strengthen the euro area is real,” he said. “Growth is returning. The way forward is well identified. And we will not rest until our monetary union is complete.”

Auto Sales

Just over 18 million which is stronger than expected, with continuing ‘pent up demand’ from the sales collapse that started in 08. Lots of imports and import content, so not going to do much for GDP. Back to levels of 10 years ago, but the population is also about 15% higher. September included the labor day weekend this year, and so analysts anticipate a reduced selling rate going forward:

VS-1
VS-2

Auto stocks don’t seem impressed:
VS-3
VS-4

VS-5
VS-6

Posted in GDP

Challenger Job Cuts, Claims, ISM Manufacturing, Construction Spending

Looks like it started trending higher after oil prices collapsed:
er-10-3
Nothing happening here yet, I suspect it’s at least partially about restrictions on eligibility, etc.
er-10-4
Bad:

United States : ISM Mfg Index
er-10-1-5
Highlights
The ISM index, like nearly all other September indications, is pointing to trouble for the factory sector. At 50.2, the index is at its lowest point since May 2013. New orders, at 50.1, are at their lowest point since August 2012. Backlog orders, at a very low 41.5, are in their fourth month of contraction and won’t be giving manufacturers much breathing room to keep up production. Export orders, at 46.5, are also in their fourth month of contraction and are a key factor behind the general weakness.
er-10-6

July revised down .3 and August .1 higher than expected. And the elevated year over year growth rate is vs a dip last year. Looking at the chart below you can see the rate of growth has resumed at the lower, prior levels, and that the level of spending spending, which is not inflation adjusted, remains below prior levels, and on an inflation adjusted basis construction remains depressed. Not to mention the spike in permits, exacerbated by NY tax breaks that expired June 15, seems to have reversed:

United States : Construction Spending
er-10-1-7
Highlights
Construction spending is picking up, at plus 0.7 percent in August for a year-on-year gain of 13.7 percent. Construction of single-family homes rose a solid 0.7 percent in the month with continuing gains certain given strength in permits. Multi-family construction, driven by rising rents, jumped 4.8 percent in the month and is up 25 percent year-on-year. The year-on-year gain for single-family homes is lagging but is still very strong at 14.0 percent.

Gains were also posted in private non-residential construction, at 0.2 percent following July’s 1.6 percent jump, with gains continuing to be centered in manufacturing in strength that belies other indications of weakness in business investment. Year-on-year, non-residential construction is up 17 percent. Public construction remains subdued with year-on-year gains in related components in the mid-single digits.

Strength in construction, including strength in new homes, looks to offset not only unevenness in existing home sales but also what appears to be a breaking down in the factory sector.
er-10-8
er-10-9
er-10-10

Mtg Purchase Apps, Chicago PMI, ADP, Euro Comment

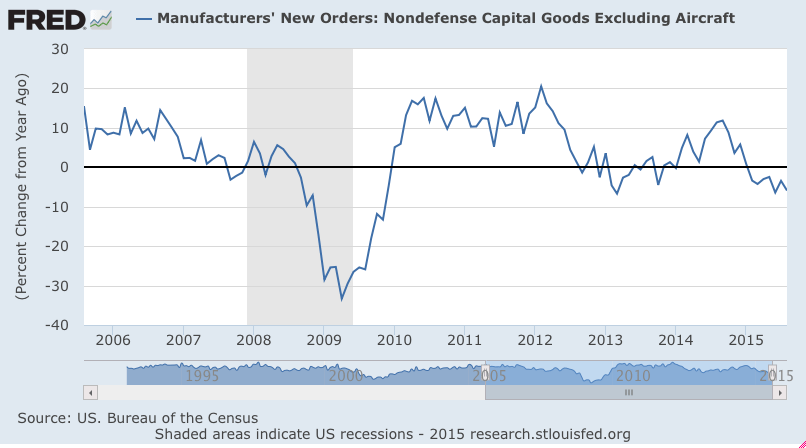
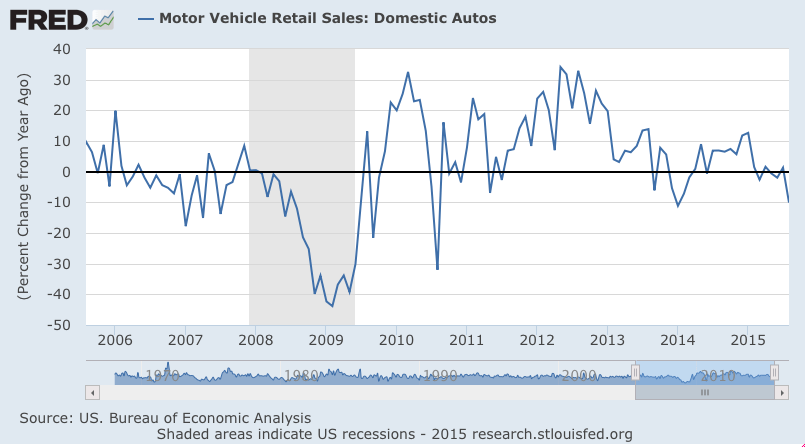
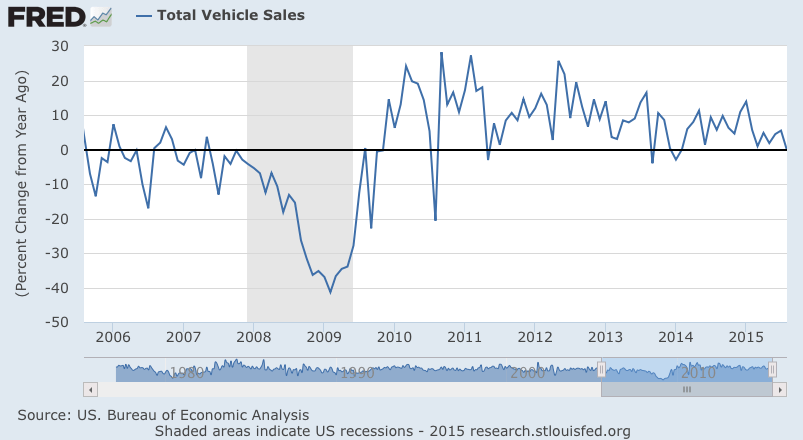
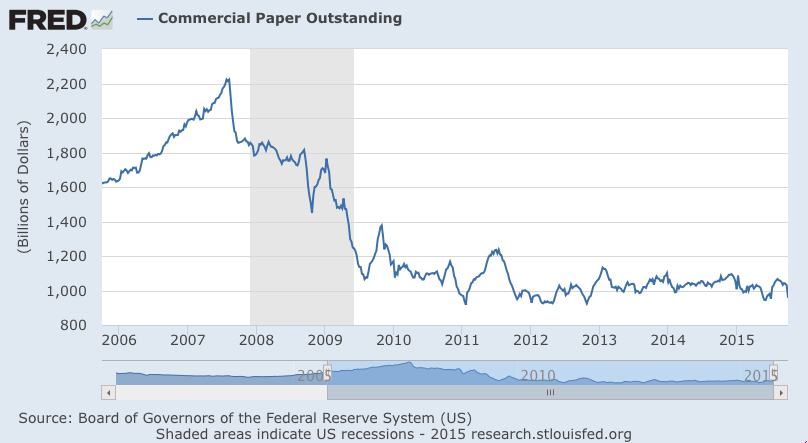
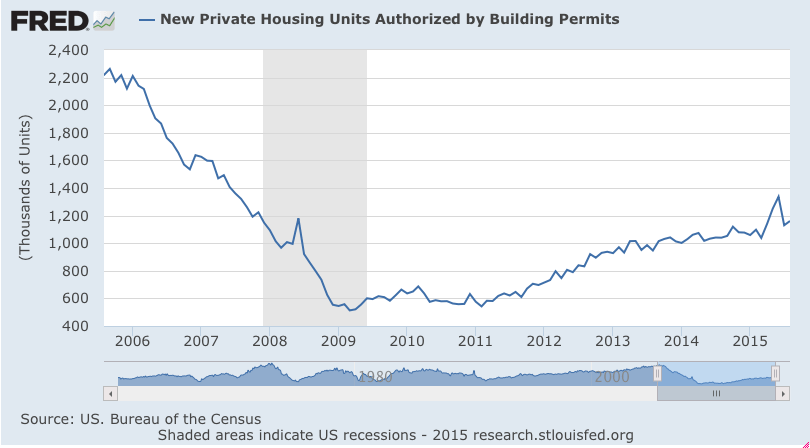
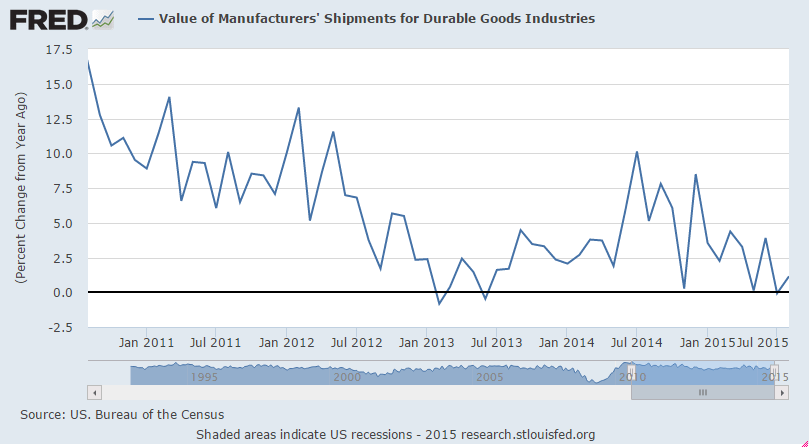
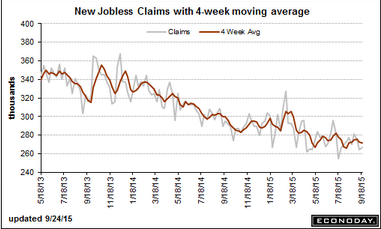
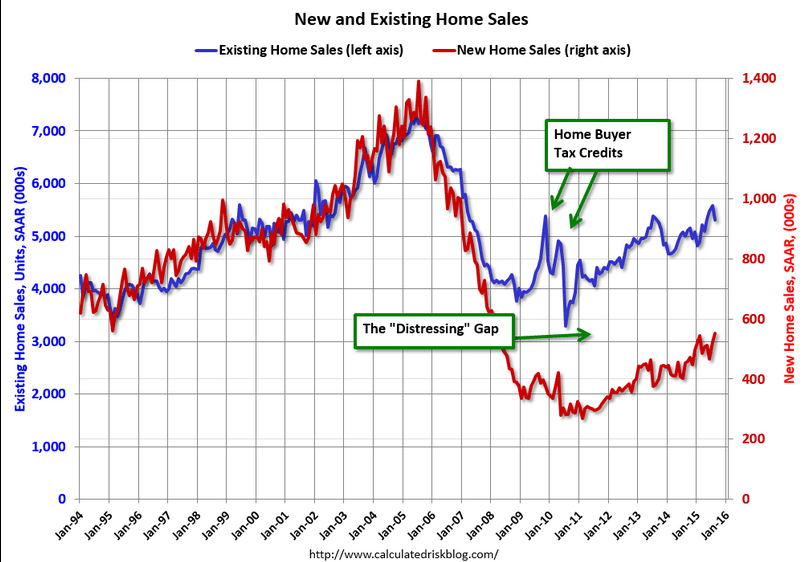
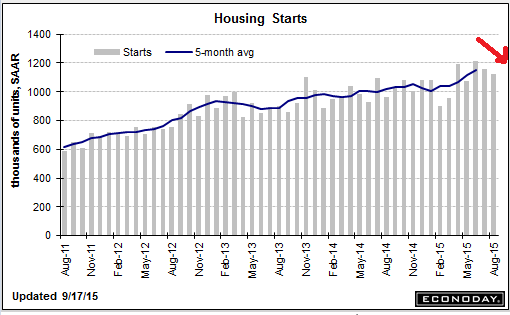
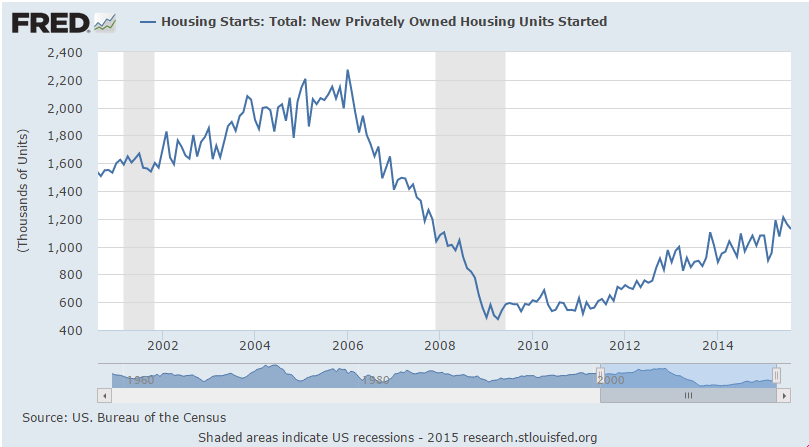
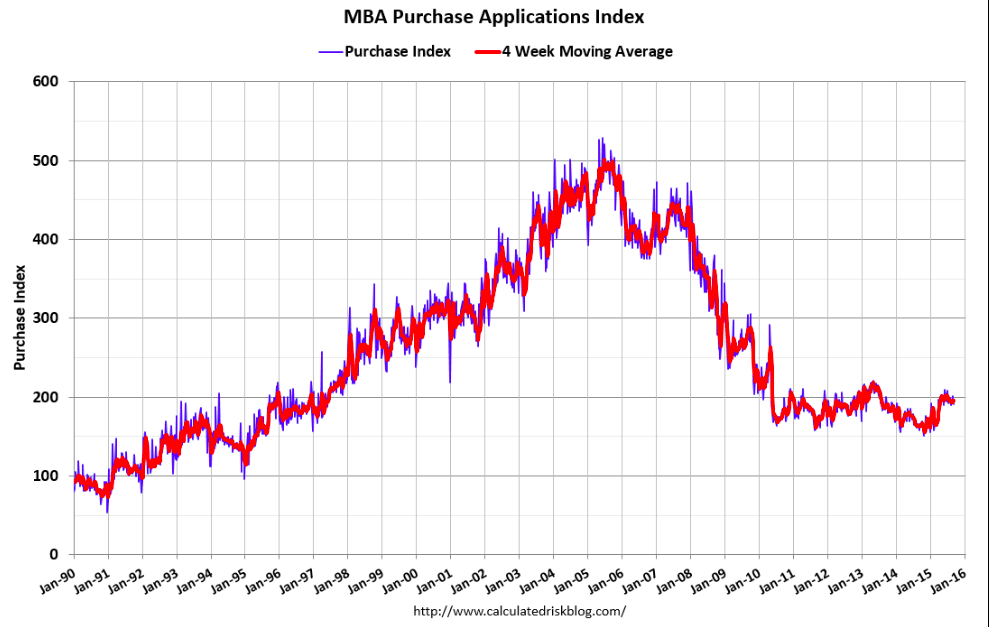
This is still going nowhere, and, most recently, trending lower, and obviously not responding positively to the ultra low rates of the last several years:

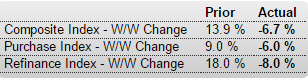
MBA Mortgage Applications
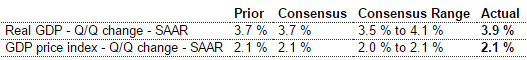
er-9-30-1
Highlights
After surging in the prior week following the FOMC’s decision against a rate hike, mortgage activity fell back in the September 25 week. The purchase index fell 6 percent in the week but still remains up strongly year-on-year, at plus 20 percent. The refinance index fell 8.0 percent in the week. Rates continued to move lower in the week with the average 30-year mortgage for conforming loans ($417,000 or less) down 1 basis point to an average 4.08 percent.

er-9-30-2
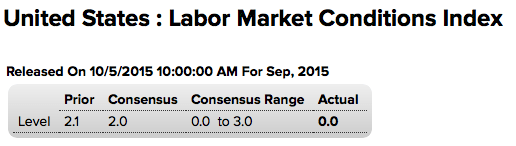
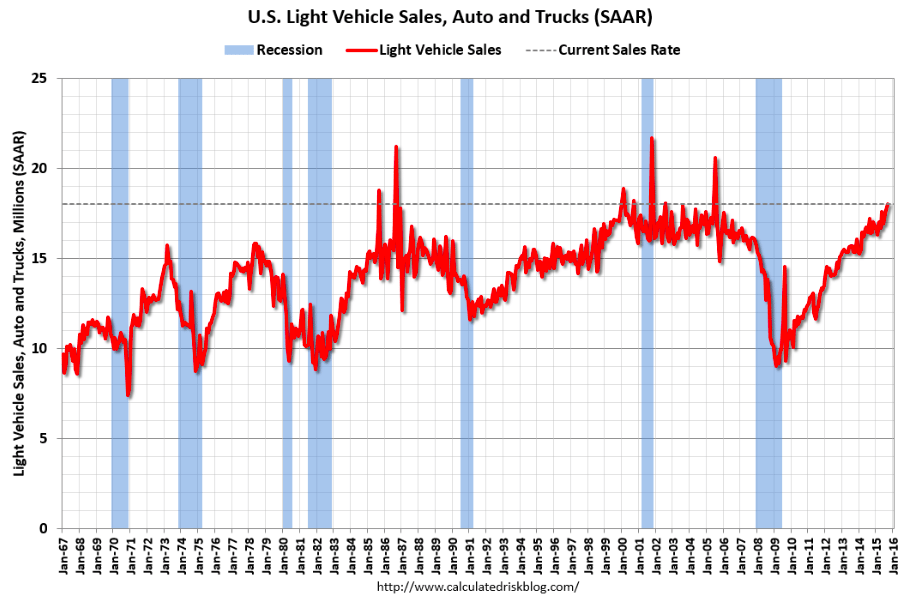
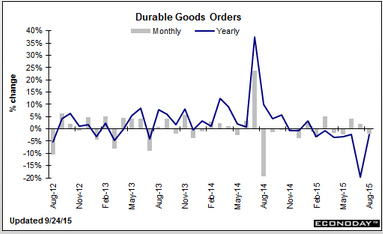
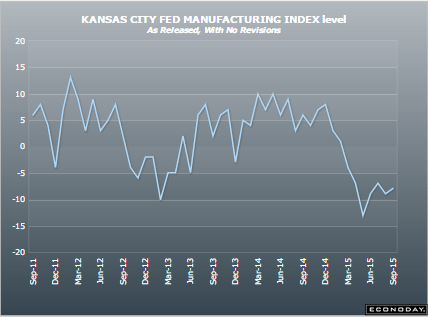
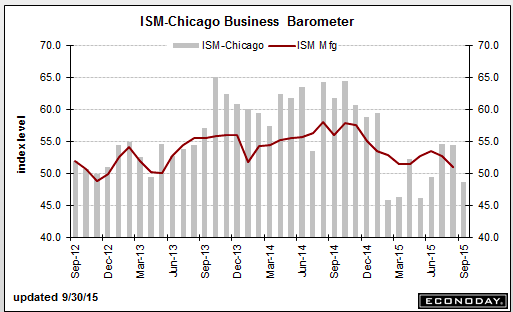
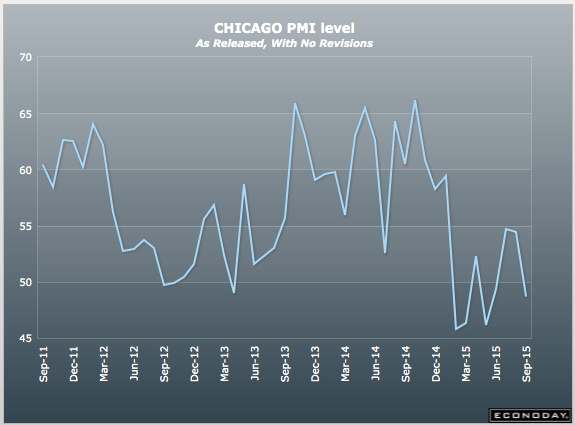
Yet another negative shock.

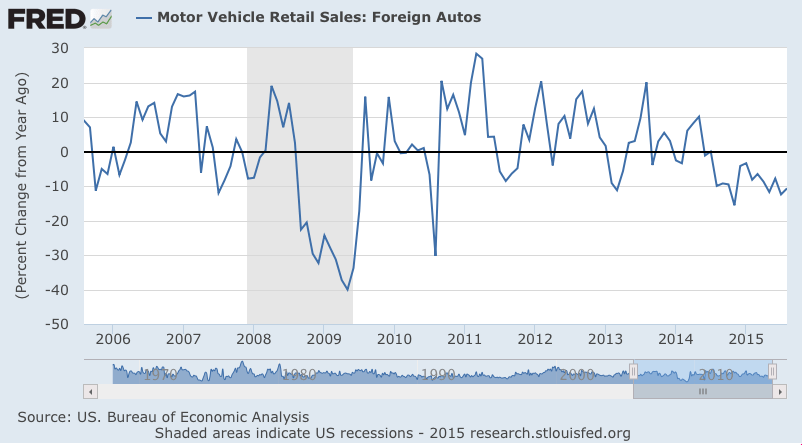
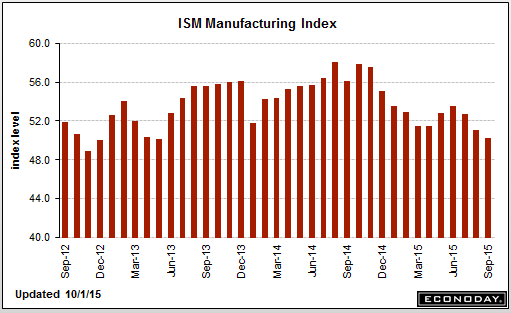
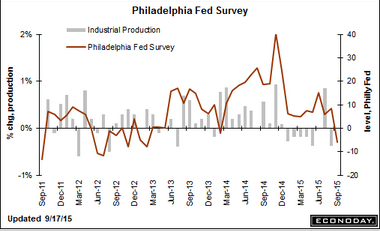
And note that it all went bad after the collapse in oil prices:
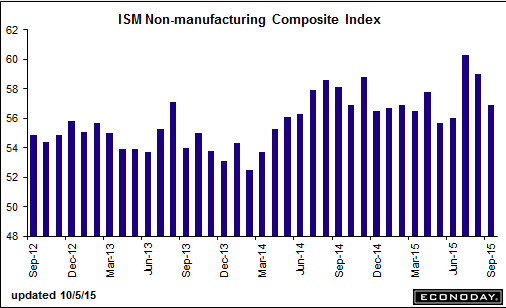
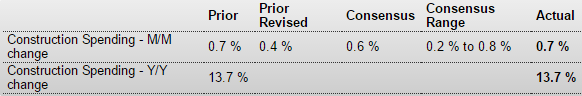
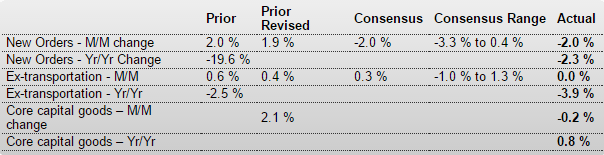
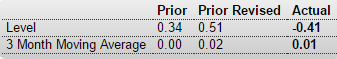
Chicago PMI
er-9-30-3
er-9-30-4
er-9-30-5

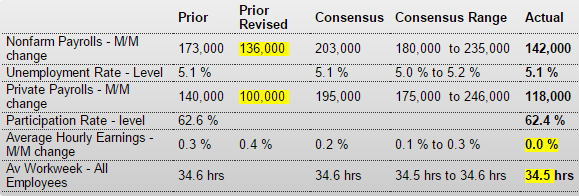
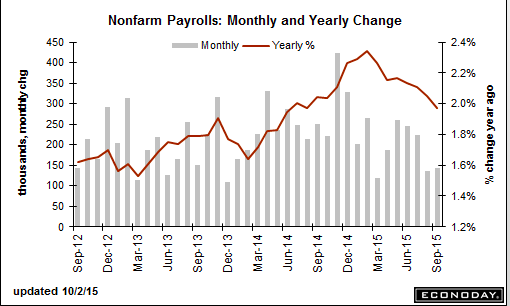
This is their forecast for Friday’s number, and the downward trend since November continues for both ADP and the BLS payroll series:

ADP Employment Report
er-9-30-6
Highlights
ADP’s call for Friday’s September employment report is on the high side but only slightly, at 200,000 for private payroll growth vs Econoday expectations for 190,000. ADP’s call for August, an initial 190,000 now revised to 186,000, proved much stronger than the initial government total of 140,000. Today’s result won’t likely shake up the outlook for Friday’s employment report where another month of moderate improvement is expected.
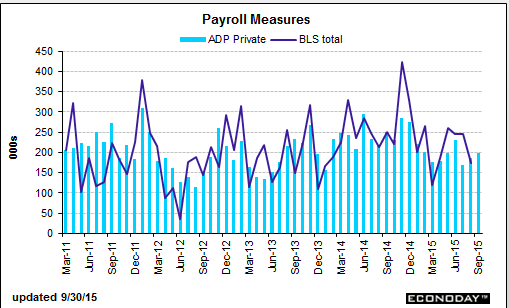
er-9-30-7

From ADP:

Goods-producing employment rose by 12,000 jobs in September, off from 15,000 the previous month. The construction industry added 35,000 jobs in September, almost double the 18,000 gained in August. Meanwhile, manufacturing dropped into negative territory losing 15,000 jobs in September, the worst showing since December 2010.

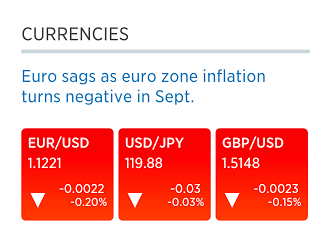
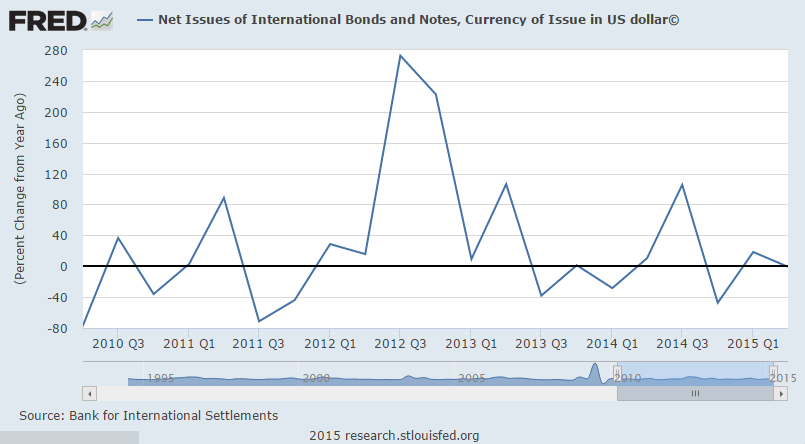
Revealing CNBC headline, as ultimately ‘purchasing power parity’ does hold. That is, high inflation means the value of the currency is falling, and longer term currencies that experience high inflation depreciate vs currencies with low inflation. That is, high inflation policy is not the stuff of strong currencies, regardless of interest rates.

So what the headline is implying, at best, is that the ECB policy response will be to lower rates/do more QE to promote inflation, and thereby weaken the currency. It is also probably implying that a lower rate and QE per se make
the euro weaker.

My narrative is a bit different. I see the deflation as further supporting the euro area’s record high and growing trade surplus, a force which fundamentally drives the euro higher, as non residents continuously sell their currencies to buy euro to pay for imports from the euro area. This ultimately drives the euro higher, as happened with the yen for the 2 decades it ran large and persistent trade surpluses, along with a zero rate policy, and far more QE than the ECB or the Fed has done.
er-9-30-8

Q2 GDP, Atlanta Fed, Manuf. vs Real GDP chart, Corp Debt, Rail Traffic

Revised up, but same story as previously discussed, with several volatile series moving up and likely to revert at least that much in Q3 when reported late October:

GDP
er-9-25-1
Highlights
Personal spending was stronger than thought in the second quarter, helping to drive real GDP to a very solid 3.9 percent annualized rate. Boosted by the consumer, final sales also rose 3.9 percent for a 4 tenths upward revision.

Personal consumption expenditures were revised 5 tenths higher to 3.6 percent as the service spending component, reflecting strength in travel, was revised 7 tenths higher to 2.7 percent. Revisions to goods spending were mixed with durables down 2 tenths to a vehicle-led surge of 8.0 percent with nondurables up 2 tenths to 4.3 percent. Consumer strength is also evident in a 1.5 percentage point upward revision to residential fixed investment, now at 9.3 percent.

But businesses also contributed to the quarter’s growth as nonresidential fixed investment, driven by structures, is revised 9 tenths higher to 4.1 percent. Another plus in the report is a downward revision to inventory growth.

The second quarter managed in the end to meet what were tough expectations for a big bounce from the transitory factors of the first quarter when growth came in at only 0.6 percent. The outlook for the third quarter, however, is so far subdued, at roughly the 2 percent area.

Q3 forecast revised down a tenth:
er-9-25-3

Atlanta Fed revises its Q3 forecast down a tenth:
er-9-25-2
Interesting chart:
er-9-25-4
Corps are borrowing to buy each other’s debt, not to invest, seems, so net credit expansion for sector not as high as some suggest?

Big Buyers of Corporate Debt Are Other Corporations

(WSJ) — Companies reaching for better returns on their cash have found a new favorite investment—other companies’ bonds—and they are loading up. More than half of corporate cash held by U.S. companies this August was invested in investment-grade corporate bonds, a record, according to investment-software company Clearwater Analytics. Meanwhile, treasurers have reduced their companies’ holdings of more traditional investments such as U.S. Treasurys, commercial paper and bank certificates of deposit.

Rail Week Ending 19 September 2015: Year-over-Year Trends Continue to Degrade

Week 37 of 2015 shows same week total rail traffic (from same week one year ago) declined according to the Association of American Railroads (AAR) traffic data. Intermodal traffic insignificantly expanded year-over-year, which accounts for approximately half of movements. but weekly railcar counts continued in contraction. This cannot be a positive data point for the USA economically.

Posted in GDP

Durable Goods Orders, Chicago Fed, KC Fed, Philly Fed State Indicator, Claims, New Home Sales

Weak capital goods expenditures and another report indicating weak exports:

United States : Durable Goods Orders
er-9-24-1

Highlights
Transportation equipment, specifically aircraft orders, are once again skewing durable goods orders which fell 2.0 percent in August as expected. Excluding transportation, durable goods were unchanged which is slightly lower than expected. Weakness here in part reflects a pause for capital goods as nondefense ex-auto orders slipped 0.2 percent following two prior months of very solid growth. This report falls in line with last week’s industrial production data where manufacturing basically held flat in August. Weakness in exports is the balancing factor tipping the factory sector away from growth.

er-9-24-2
er-9-24-3
er-9-24-4
er-9-24-5
Not good:

United States : Chicago Fed National Activity Index
er-9-24-6
Chicago Fed National Activity Index in the United States decreased to -0.41 in August from an upwardly revised 0.51 in July of 2015, the lowest since January of 2014. All four broad indicators declined from July: production (-0.3 from +0.36); employment (-0.01 from +0.18); personal consumption and housing (-0.08 from -0.06); sales, orders, and inventories (-0.03 from +0.03). Chicago Fed National Activity Index in the United States averaged 0 from 1967 until 2015, reaching an all time high of 2.66 in September of 1983 and a record low of -4.96 in December of 1974. Chicago Fed National Activity Index in the United States is reported by the Federal Reserve Bank of Chicago.

Another bad one:

Kansas City Fed Manufacturing Index
er-9-24-7
Highlights
At an index of minus 8, contraction continues apace in the Kansas City manufacturing sector which reports export weakness tied to the strong dollar and energy-sector weakness tied to low commodity prices. Metals and machinery are showing particular weakness with new orders at minus 8 and backlog orders at minus 12. Employment is at minus 7 with the workweek at minus 12. Despite contraction in the workweek, production is the only component in the plus column, but just barely at plus 1. Price data, like for many other reports, show contraction for both inputs and outputs.

Manufacturing was basically flat in August, as evidenced by this morning’s durable goods report. And the early indications on September, including the Kansas City report, are all pointing to increasing weakness.
er-9-24-8

Still looking suspect:
er-9-24-9
I’m still suspecting there’s something keeping more people from filing than in prior cycles:
er-9-24-10
This looks a touch better but could just be some buying in front of fears of rate hikes. And still very depressed historically:

New Home Sales
er-9-24-11
Highlights
Because of a small sample, new home sales can be very volatile month-to-month as they are in the August report where, at 552,000, the annual rate came in far above the high-end estimate. This is the highest rate since February 2008. Adding to the momentum is a 15,000 upward revision to July.

In especially welcome news for builders, the sales strength pulled supply relative to sales even lower, to 4.7 months from 4.9 months. Still, low supply is a constraint on sales in contrast to pricing which remains favorable, at a median $292,700 for a 0.5 percent gain on the month but at a paltry year-on-year gain of only 0.3 percent. By comparison, the year-on-year sales gain is 22 percent.

Regional data show August strength for the Northeast and more importantly the South which, for new home sales, is larger than all other regions combined. Year-on-year, sales in the South are up 28 percent which leads the regions. At the rear is the West where sales growth, however, is still in the double digits at plus 11 percent.

Volatility aside, this report is impressively strong and likely marks an upturn for housing data which, like Monday’s existing home sales report, had been showing limited and uneven strength.

er-9-24-12

Japan Downgrade, China GDP Model, Earnings Reports, Italian Trade, Housing Starts, Rail Traffic, Fed Comment

Yields on JGB’s fall a bit with S&P downgrade. I’ve spoken to S&P. They know better. They are intellectually dishonest.
er-9-18-1
er-9-18-2

I included these as they give some indication of the macro outlook:

FedEx Trims Outlook on Weak Freight Demand

Sept 16 (WSJ) — FedEx said it expects adjusted earnings of $10.40 to $10.90 a share for the year ending May 31, down from its previous guidance of $10.60 to $11.10 a share. Average daily volume for Ground’s package business grew 4% in the quarter, which was about in line with the company’s expectations. Ground’s operating income slipped 1% to $537 million, while revenue shot up 29% to $3.83 billion in part from the addition of GENCO. For the first quarter ended Aug. 31, FedEx posted a profit of $692 million, or $2.42 a share, up from $653 million, or $2.26 a share, a year earlier. Revenue increased 5% to $12.3 billion.

Oracle Reports Decline in Profits

Sept 16 (WSJ) — Oracle said net income fell 20% in the period ended Aug. 31, but was off only 8% excluding currency effects. Total revenue, off 2%, was up 7% on a constant-currency basis, Oracle said. Oracle said new licenses declined 16% in dollars, or 9% in constant currency. Overall, Oracle reported a profit of $1.75 billion, or 40 cents a share, down from $2.18 billion, or 48 cents a share, a year earlier. Excluding stock-based compensation and other items, profit would have been 53 cents a share, compared with 62 cents a year earlier. Total revenue declined to $8.45 billion from $8.6 billion a year earlier.

Euro friendly:

Italy : Merchandise Trade
er-9-18-3
Highlights
The seasonally adjusted trade balance was in a E3.7 billion surplus in July, up from an unrevised E2.6 billion excess in June.

However, the headline improvement masked contractions in both sides of the balance sheet. Hence, exports fell 0.4 percent on the month, their third decline since March but only due to weakness in energy (ex-energy exports grew 0.4 percent). Imports were off a steeper 3.7 percent (minus 4.0 percent ex-energy). Compared with a year ago, exports were up 6.3 percent after a 9.4 percent rise in June and imports 4.2 percent higher following a 12.2 percent gain last time.

The July black ink was more than 6 percent above its average level in the second quarter. This suggests that net exports could provide a boost to real GDP this quarter having been a drag in the previous period.

They talk about the ‘portfolio balance channel’ meaning investors shifting to ‘riskier assets’ due to QE, etc. But at the macro level, it’s about the total ‘risky assets’ available, and it looks like the growth rate is declining:
er-9-18-4
No sign of a burst in issuance here:
er-9-18-5
er-9-18-6
er-9-18-7

Housing Starts
er-9-18-8

Highlights
Housing starts fell back in August but not permits which gained and point to strength for starts ahead. Starts fell 3.0 percent in the month to a lower-than-expected 1.126 million annual pace while permits rose 3.5 percent to a higher-than-expected 1.170 million. Starts for single-family homes, like the headline for starts, also fell 3.0 percent in August but follow a 10.9 percent surge in July. Permits for single-family homes rose 2.8 percent in the latest month to 699,000 which is the highest since 2008.

Housing under construction is also at a 2008 high, at 920,000 vs 908,000 in July. But completions were down in the month, from July’s 966,000 pace to a still healthy 935,000.

By region, starts data show increasing strength for the South which is by far the largest region, up 7.1 percent in the month. Permits in the South rose 2.4 percent for a 10 percent year-on-year gain. Permits in the West are the strongest of any region, up 9.6 percent in the month for a year-on-year rate surge of 36 percent.

Revisions to July were mixed with starts revised lower but permits higher. On net, this report is another positive for housing which is proving to be a key sector for the 2015 economy.
er-9-18-9

Steady progress but still depressed and still well below the lows of the 2001 recession:
er-9-18-10

Too soon to tell if the prior spike will be followed by a more serious collapse:
er-9-18-11

Philadelphia Fed Business Outlook Survey
er-9-18-12

Highlights
There may very well be something wrong with the manufacturing sector, at least in the Northeast where the Empire State index has been in deep negative ground for the last two months followed now by a minus 6.0 headline for the Philly Fed index. This is the first negative reading since February 2014.

But the headlines for both of these reports, which are not composite scores of separate components, are sentiment scores of sorts, rough month-to-month assessments of general conditions. A key positive in today’s is continued strength in new orders which rose 3.6 points to 9.4. Unfilled orders, nevertheless, have been trending into contraction, at minus 6.6 for the third straight negative reading.

But some details are very strong with shipments at plus 14.8 and employment at plus 10.2 for a 5-month high. In a negative signal also seen in the Empire State report, prices received, that is prices for final goods, is in contraction at minus 5.0.

The Fed is wondering whether global volatility and stock market losses are affecting consumer confidence. Early data this month from regional Feds suggest the effects may also be extending to business sentiment.
er-9-18-13

Rail Week Ending 12 September 2015: Tremendous Unimprovement After Previous Week’s Improvement

Sept 17 (Econintersect) — Week 36 of 2015 shows same week total rail traffic (from same week one year ago) collapsed according to the Association of American Railroads (AAR) traffic data. Intermodal traffic significantly declined year-over-year, which accounts for approximately half of movements. and weekly railcar counts continued in contraction. It could be that the data last week was screwed up – and the data this week was an adjustment.

And so how good can the US economy be if the Fed thinks the appropriate fed funds rate is still near 0%?

;)