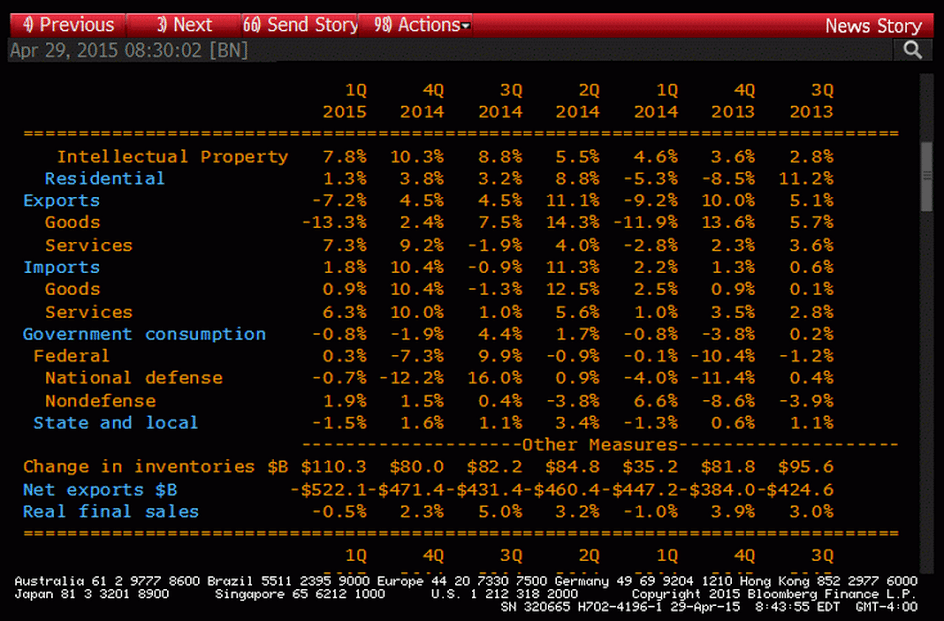
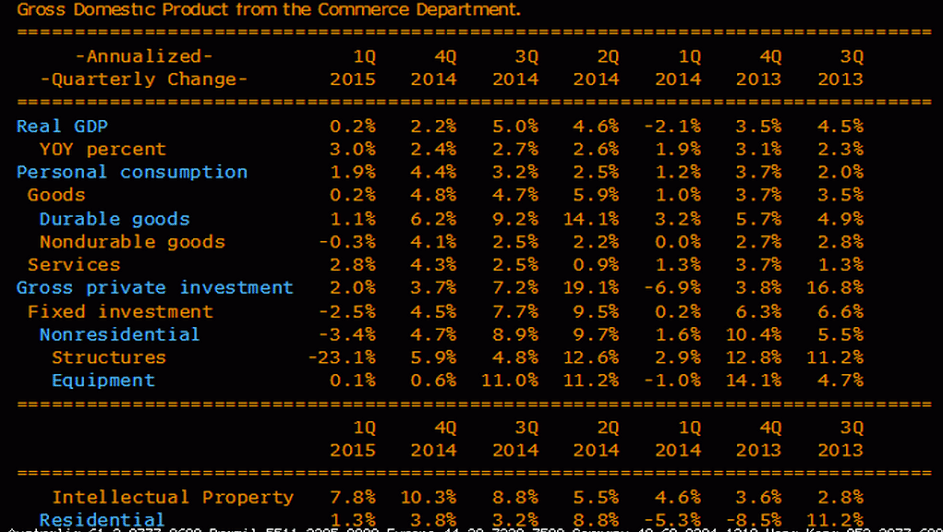
Note that if/when the adjustments are changed it looks like they make Q4 and Q1 a bit higher and Q2 and Q3 a bit lower. The net adjustments are 0 for the year.
Nicole Mayerhauser, chief of BEA’s national income and wealth division, which oversees the GDP report, said in the statement that the agency has identified several sources of trouble in the data, including federal defense service spending. Mayerhauser said initial research has shown this category of spending to be generally lower in the first and the fourth quarters. The BEA will also be adjusting “certain inventory investment series” that have not previously been seasonally adjusted. In addition, the agency will provide more intensive seasonal adjustment quarterly service spending data.
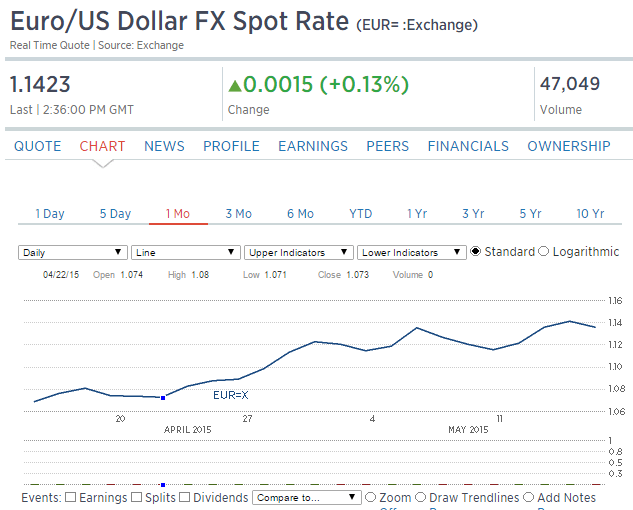
My narrative goes something like this: The CB euro selling drives the price down to the point where the euro zone net exports increase sufficiently to absorb the cb selling, at which point the euro reverses as the trade flows overwhelm the selling from those portfolios and the euro then continues to rise until the current account surplus goes away:
Job creation at four-year high despite slower pace of economic growth
May 21 (Markit) — Eurozone PMI Composite Output Index at 53.4 (53.9 in April), Services PMI Activity Index at 53.3 (54.1 in April), Manufacturing PMI at 52.3 (52.0 in April), and Manufacturing PMI Output Index at 53.5 (53.4 in April). Faster growth in manufacturing was offset by a slowdown in services, though the pace in the latter merely eased slightly further from March’s eight-month high to suggest a broad-based upturn remains in place. Weaker order book growth was centred on the service sector, with manufacturing reporting the strongest inflows of new orders for just over a year, linked to improved export performance.
PMI data signals further slowing of private sector output growthMay 21 (Markit) — PMI data signals further slowing of private sector output growth () Germany Composite Output Index at 52.8 (54.1 in April), Services Activity Index at 52.9 (54.0 in April), Manufacturing PMI at 51.4 (52.1 in April), and Manufacturing Output Index at 52.7 (54.3 in April). Mirroring the trend for output, German private sector companies also signalled a weaker rise in new business. While a pick-up in construction activity and rising domestic demand were reasons behind the overall increase, some survey participants linked the slowing in the rate of growth to economic uncertainties. Meanwhile, manufacturers reported a fourth successive monthly rise in new export orders.
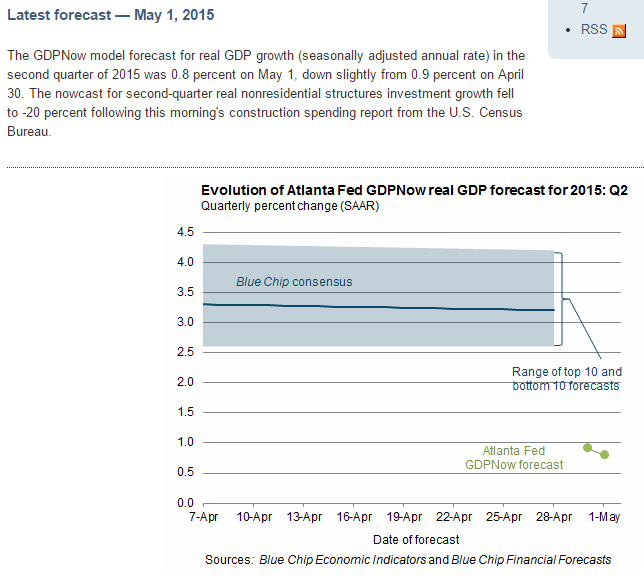
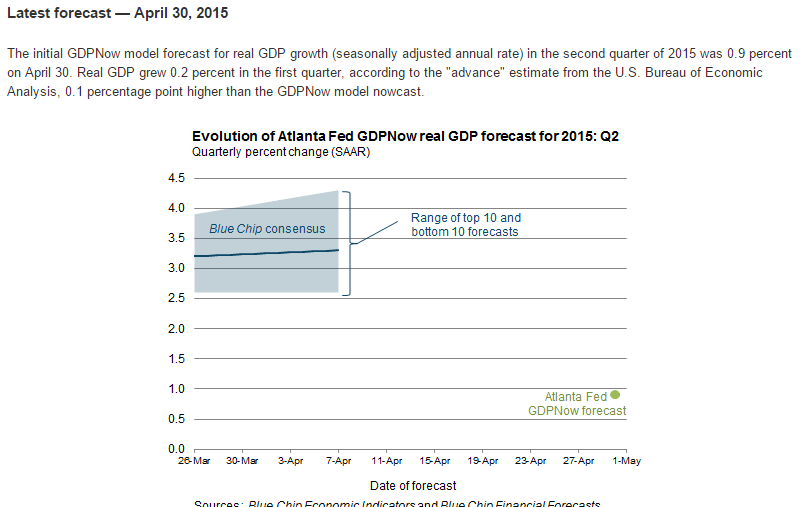
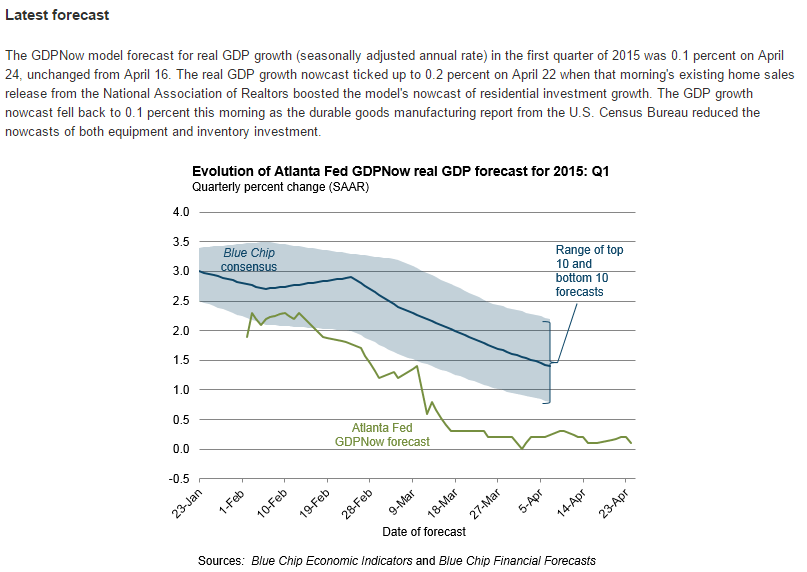
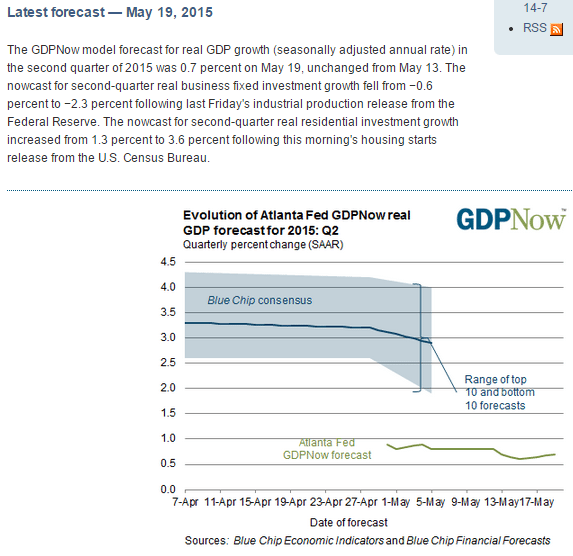
Recent data leaves their forecast unchanged:
Negative and looking weak:
Weaker here too:
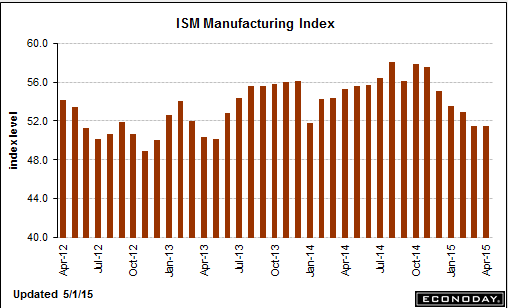
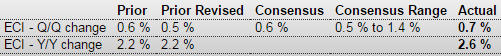
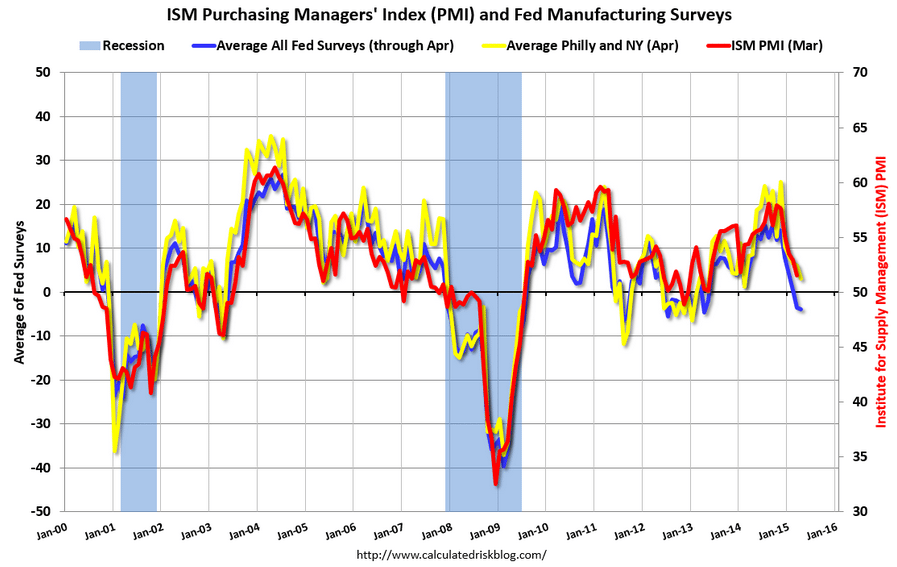
PMI Manufacturing Index Flash
Highlights
Markit’s US manufacturing sample had been far stronger than other readings on the sputtering sector but is a little less so with the May report where the index slipped slightly to a 16-month low of 53.8, 8 tenths below the Econoday consensus.
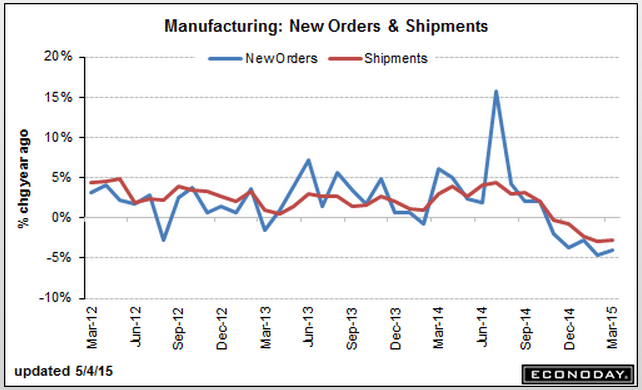
Slowing growth in new orders, including weakness in export orders tied directly to strength in the dollar, held down the May index. Another area of weakness remains the energy sector where business spending is down. Shipment growth slowed to its slowest rate so far this year.
Strength in the report is centered in employment, but this won’t last if orders continue to slow. Deliveries continue to be delayed in part by persistent bottlenecks tied to the long since resolved port strike. Costs are up but inflation remains marginal.
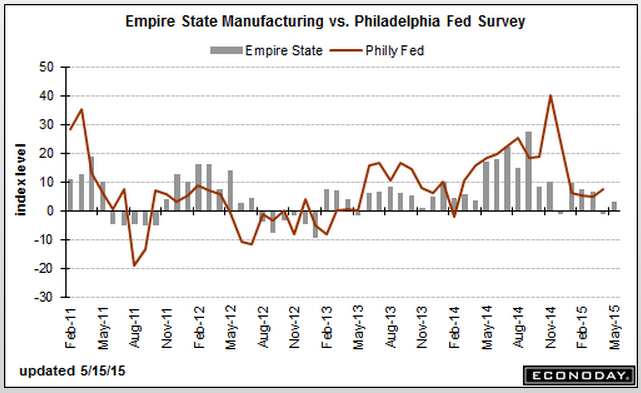
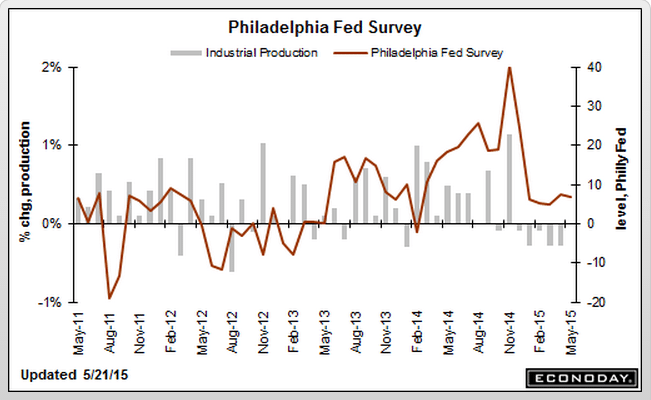
The manufacturing sector is having a tough spring following six prior months of slowing. Watch for the Philly Fed report coming up this morning at 10:00 a.m. ET.
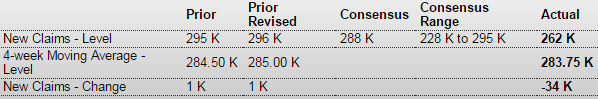
Less than expected and weak:
Less than expected and weak:
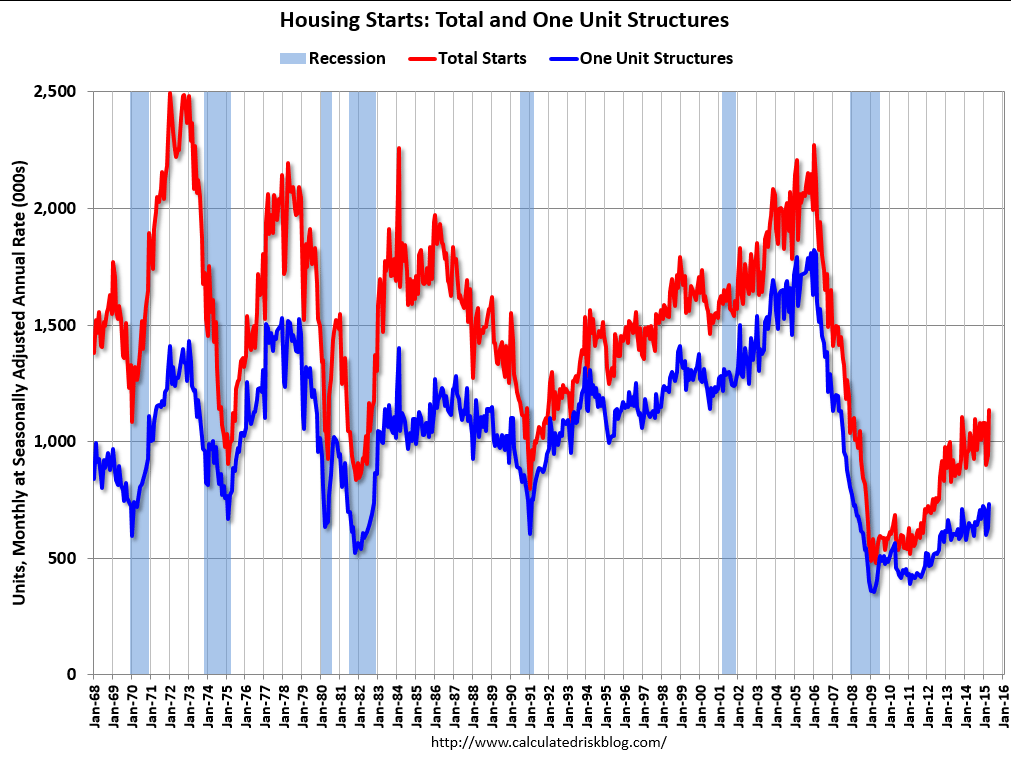
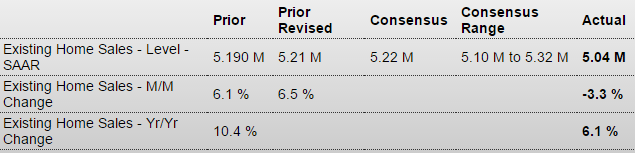
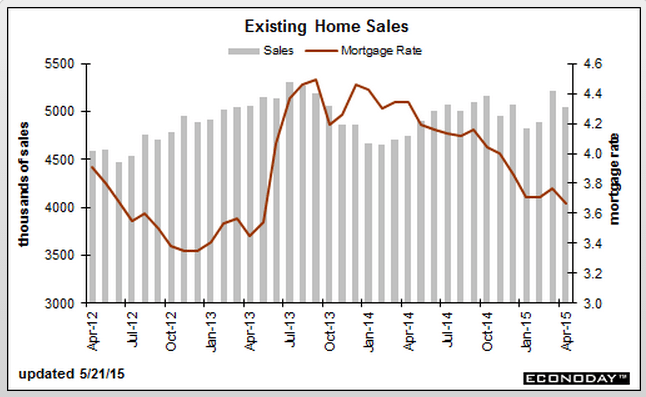
Existing Home Sales
Highlights
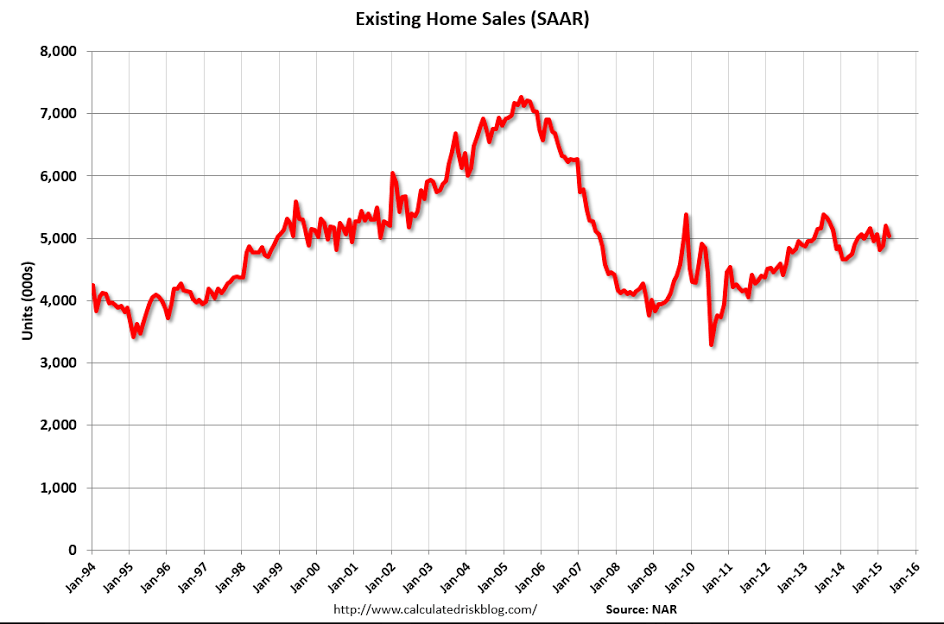
Existing homes sales are not living up to springtime expectations, down 3.3 percent in April to a 5.04 million annual rate which is just below the low-end Econoday forecast. Three of 4 regions show contraction in April with the sharpest decline, minus 6.8 percent, in the South, which is by far the largest housing region. Year-on-year, total sales are still up a respectable 6.1 percent.
Another positive is a rise in supply with 2.21 million used homes on the market vs 2.01 million in March. This rise, together with the drop in sales, raises supply relative to sales to 5.3 months from 4.6 months. And another positive is a 4.1 percent rise in the median price to $219,400 which is up 8.9 percent year-on-year.
But this report in sum is a disappointment, failing to point to any building momentum. Strength in the housing sector may be switching, from existing home sales to new home sales at least based on this report compared to the historic surge earlier this week in housing starts & permits. But housing data month-to-month are always volatile and, on net, it’s too soon to decipher how strong the spring housing season is right now.
And one last negative for today:
Kansas City Fed Manufacturing Index
Highlights
The early indications on May’s manufacturing activity have been slightly positive, that is until the Kansas City Fed report where the composite index is in deeply negative ground at minus 13. This is the weakest of the recovery for this reading and follows an already weak minus 7 in April.
New orders this month are deeply negative, at minus 19, as are backlog orders at minus 21. These readings, reflecting contraction for export orders and trouble in the energy sector, point to significant trouble for the region’s manufacturing activity in the months ahead.
Shipments are already in contraction, at minus 9, as is employment, at a deeply negative minus 17 that contrasts with mostly positive employment indications in other reports.