US macro update, FX update

US macro update:

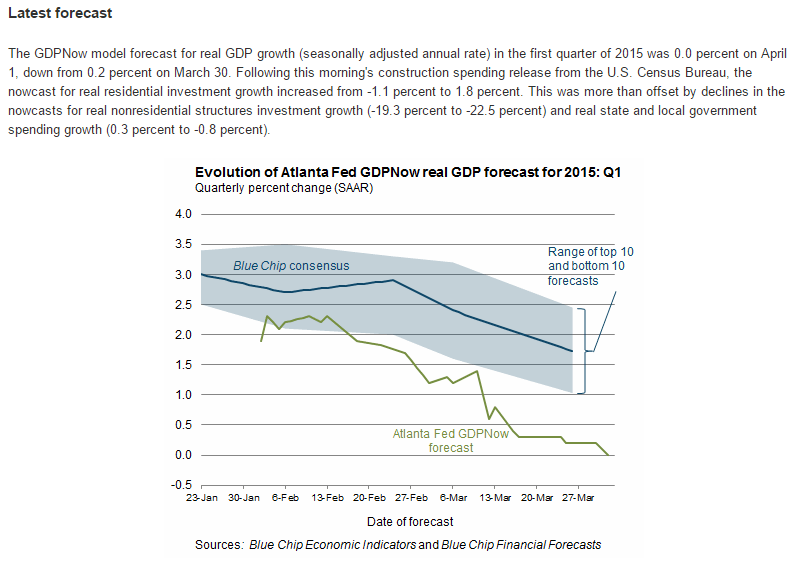
So looks to me like it’s all gone bad since the oil price crash, exactly as feared, and the Atlanta Fed most recently lowered it’s Q1 GDP estimate to 0.

First, a quick review of the accounting.
GDP = spending = sales = income.
An increase in spending = an increase in sales = an increase in income.

And, on a look back, as a point of logic, is this critical, fundamental understanding:

For every agent that spent less than his income (aka demand leakages) another must have spent more than his income (aka deficit spending/spending from savings) or that much output would not have been sold.

And this also means that to sustain last year’s rate of GDP growth, all the sectors on average need to grow at least at the same rate as last year, and higher if GDP growth is to increase.

Next, in that context, a quick look back at the last few years.

When stocks fell after the 2012 Obama reelection I called it a buying opportunity, as I saw sufficient total deficit spending along with sufficient income growth for additional private sector deficit spending that I thought would support maybe 4% GDP growth.

But that changed when we were allowed to at least partially go over what was called ‘the fiscal cliff’ with the expiration of my (another story) FICA tax cut and some of the Bush tax cuts amounting to what was then estimated to be a $180 billion tax hike- the largest in US history. And the sequesters about 4 months later cut about 70 billion in spending. That all lowered my GDP estimate by that much and more, and I began referring to a macro constraint that would keep an ever declining lid on GDP.

The fundamental problem was that govt, the agent that was spending more than its income to offset the demand leakages, had suddenly removed that support, and I didn’t see any other agent stepping up to the plate or even capable of stepping up to the plate to increase his deficit spending to replace it. Historically it would be housing and cars, but with the income cuts from the decrease in govt net spending I didn’t see those sectors sufficiently increasing private sector deficit spending.

So GDP growth was lower than expected in 2013, and even what we had towards the end of the year looked bogus to me, including the mainstream claiming the rise in inventories this time was a good thing, not to be followed by reduced production, as it meant there were high sales forecasts and it all would be self sustaining. I thought otherwise and wrote about heading to negative growth by year end.

And in fact Q1 2014, originally forecast to grow at about 2%, was first released as positive before being subsequently revised down to less than -2%, with maybe 1% of that drop due to cold weather. At that point I continued to not see any source of deficit spending to offset the demand leakages that were dragging down the economy.

However, what I completely missed in early 2014 was the increase in deficit spending underway in the energy sector as new investment chased $90 crude prices. I knew crude production was expanding, and likely to grow by maybe a million barrels/day or so, but I didn’t realize the magnitude of the rate of growth of that capital expenditure until after prices collapsed several months ago and economists started estimating how much capex might be lost with lower prices.

It was then I realized that the energy sector had been the mystery source of the growth of deficit spending that had been offsetting the drop in govt deficit spending, and thereby supporting the positive GDP prints that otherwise might have gone negative much sooner, and that the end of that support was also the end of positive GDP growth.

So here we are, with Q1 GDP forecasts all being revised down after Q4 was also revised down, as all the charts are pointing south, and all are in denial that it is anything more than a random blip down as happened last year in Q1, along with the pictures of houses and cars covered in snow, as forecasts for Q2 and beyond remain well north of 2%.

But without some agent stepping up to the plate to replace the lost growth in energy CAPEX that replaced the lost govt deficit spending, all I can see is the automatic fiscal stabilizers- falling tax revenues and rising unemployment comp- as the next source of deficit spending that eventually reverses the decline.
nowcast-3-30

FX:

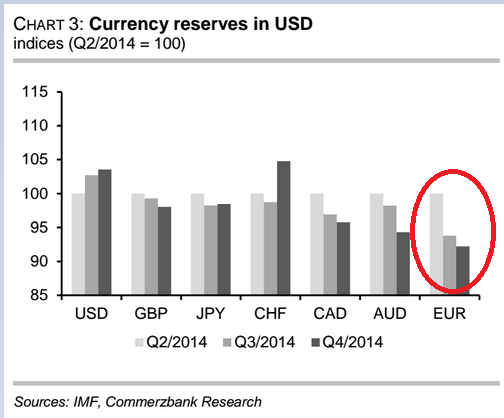
The euro short/underweight looks to me to be the largest short of any kind in the history of the world. The latest reports confirmed large scale global central bank portfolio shifting out of euro both through historically massive active selling, as well as passively as valuations changed relative weightings. And at the same time, the speculation and portfolio shifting that drove the euro down resulted in the real global economy selling local currencies to buy euro to use to purchase real goods and services from the EU. In other words, the falling euro has supported a growing EU current account surplus that’s removing net euro financial assets from the global economy.

The portfolio shifting has been driven by fundamental misconceptions that include the belief that
1. The old belief that lower rates from the ECB are an inflationary bias and therefore euro unfriendly
2. The old belief that QE is an inflationary bias and therefore euro unfriendly
3. The belief that Greek default is euro unfriendly
4. The new belief that the EU current account surplus creates a domestic savings glut that is euro unfriendly.

The operational facts are the opposite:

1. Lower rates paid by govt reduce net euro financial assets in the economy while net govt spending is not allowed to increase, the net of which functionally is a tax on the economy and euro friendly.
2. QE merely shifts the composition of euro deposits at the ECB while (modestly) reducing interest income earned by the economy and increasing ECB profits that get returned to members to contribute to deficit reduction efforts and not get spent, the net of which is functionally a tax on the economy and euro friendly.
3. Greek bonds are euro deposits at the ECB that are reduced by default, thereby acting as a tax on the economy and euro friendly.
4. The EU current account surplus is driving by non residents buying real goods and services from the EU which entails selling their their currencies and buying euro used to make their purchases, which is euro friendly.

So it now looks to me like the portfolio shifting has run its course as the EU current account surplus continues to remove euro from the global economy now caught short. This means the euro is likely to appreciate to the point where the current account surplus reverses, and since the current account surplus is not entirely a function of the level of the euro, that could be a very long way off. Not to mention that as EU exports soften additional measures will likely be taken domestically to lower costs to enhance competitiveness, which will only drive the euro that much higher.
eu-reserves

trade anecdotes, CPI, FHFA House Price Index, New home sales, Richmond Fed, PMI

It’s the net exports, paid for by non residents selling their currency to buy euro to spend, that drives up the euro until the net exports cease and trade goes negative. And with the rigidities/J curve/etc. the move up could be extreme, with the ECB unable to dampen it due to ideological restrictions on fx purchases.

German private sector output increases at strongest rate in eight months

March 24 (Markit) — German private sector output increases at strongest rate in eight months () Germany Composite Output Index at 55.3 (53.8 in February), Services Activity Index at 55.3 (54.7 in February), Manufacturing PMI at 52.4 (51.1 in February), and Manufacturing Output Index at 55.4 (52.2 in February). Survey participants noted that a positive economic environment combined with strengthening demand from both domestic and foreign markets accounted for much of the rise in new orders. Manufacturers reported the sharpest rise in new export business for eight months in March. Panel members partly attributed this to a weaker euro.

And the market of consequence for net exports is the US, where non petro imports continue their strong growth, with the strong dollar demand from portfolio shifting and speculators likewise having driven it to current levels that give the euro zone a cost advantage:

Italian-made version of iconic Jeep goes on sale in US

By Joseph Szczesny

March 23 (AFP) — US off-roaders seeking to rev up the four-wheel drive of a Jeep might soon find out that their American icon is made in Italy.

In a sign of what comes with the takeover of Chrysler by Italian giant Fiat, US auto dealers have begun selling the Italian-made Jeep Renegade.

Brisk exports a plus, but consumption key to full-blown recovery

March 24 (Nikkei) — Brisk exports a plus, but consumption key to full-blown recovery (Nikkei) “Production and exports are picking up,” State Minister for Economic and Fiscal Policy Akira Amari told a press conference. The index for transport equipment — including automobiles — rose 4% on the month, helped by increased shipments to the U.S. and Europe. The index for electronic parts and devices climbed 1.7% amid brisk exports to Asia. The ministry projects that the index for production machinery will drop 0.3% in February and 7.3% in March, and that the index for transport equipment will fall 1.6% and 0.5%.

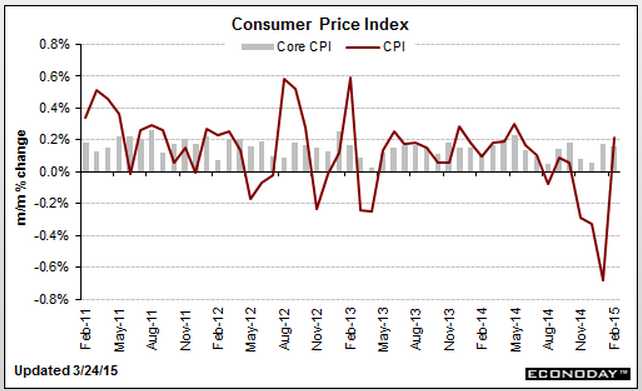
As expected, still below Fed’s targets:

Consumer Price Index
cpi-feb-table
cpi-feb-graph

Less than expected and looks to still be softening to me:

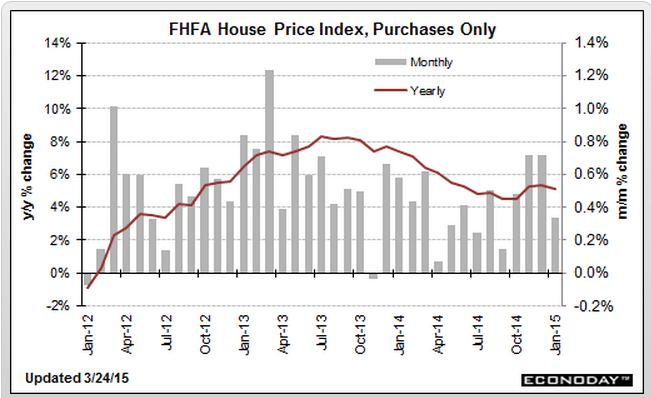
FHFA House Price Index
fhfa-jan-table
Highlights
House prices continue to rise in January but at a slower pace. FHFA house prices advanced 0.3 percent, following a gain of 0.7 percent in December. Analysts projected a 0.5 percent gain for January. The year-ago rate came in at 5.1 percent, compared to 5.4 percent in December.

Regionally, six Census regions reported gains in January while three declined.
fhfa-jan-graph

Better than expected, and only slightly suspect, and still severely depressed vs prior cycles even as the population has grown:

New Home Sales
new-home-sles-feb-table
Highlights
In a positive jolt out of the housing sector, new home sales picked up sharply in February to a 539,000 annual rate. Adding to the good news is a big upward revision to January, to 500,000 from 481,000. These are the first two 500,000 readings going all the way back to April and May of 2008.

The gain drew down what was already thin supply on the market, to 4.7 months at the current sales rate vs 5.1 and 5.3 months in the prior two reports. The current reading is the lowest since June 2013 and will undoubtedly encourage builders to expand construction. The lack of supply, however, did not lift prices where the median fell a sharp 4.8 percent in the month to $275,500. Sellers, in fact, seem to be giving price concessions with the year-on-year price up only 2.6 percent.

Looking at sales by region shows a big surge in the Northeast where, however, sales levels compared to other regions are very low. Sales in the Midwest, which is also a small region for new home sales, fell sharply in the month as they did in the West, a large region for sales that represents 23 percent of all sales. Sales, however, were very strong in the South, a region that makes up a whopping 59 percent of all sales and where sales are back to where they were in February 2008.
new-home-sales-feb-gaph

Lower than expected and not good:

Richmond Fed Manufacturing Index
richmond-fed-mar
Highlights
March has not been a good month for the Richmond manufacturing sector where the index fell into contraction, to minus 8 vs zero in February. Order readings, both for new orders and backlogs, are down substantially as are shipments and the workweek. Hiring, however, remains respectable, at least for now. Price readings show only the most marginal pressure.

The early signals from the regional manufacturing reports (that is this report together with last week’s Philly Fed and Empire State reports) are all showing weakness in orders, a trend also highlighted by this morning’s PMI flash where weakness in export orders is specifically cited. Just last week, the FOMC underscored weak exports as a major factor holding back economic growth.

PMI Manufacturing Index Flash
pmi-flash-mar
Highlights
The manufacturing sector has gotten off to slow start this year but may have picked up slightly in March, based at least on the PMI flash which is at 55.3, a 5-month high and vs 55.1 in final February and 54.3 in mid-month February. New orders are also at a 5-month high as rising domestic sales offset declining export sales and weak sales out of the oil sector. Output is at a 6-month high and employment at a 4-month high. Input costs are down for a 3rd straight month and output prices are rising at their slowest pace in 3-1/2 years.

The decline in export sales is of special note in this report which cites concerns among respondents that the dollar’s strength against the euro is hurting demand. Last week’s FOMC statement pointed to weak exports as a major factor holding down growth. This report in general has been running noticeably hotter than hard data from the government which have been no better than flat, if that, and which would correspond to a roughly 50 level for the PMI.

Chicago Fed, Existing home sales

More bad new, and, again consumption down even with lower gas prices:

Chicago Fed National Activity Index
chicago-fed-feb-table-2
Highlights
The economy has indeed gotten off to a slow start this year, confirmed by the national activity index which came in at minus 0.11 in February vs minus 0.10 in January. The 3-month average is now in negative ground, at minus 0.08 in February vs plus 0.26 in January.

The weakest component in February is for personal consumption & housing, at minus 0.17. The component for production-related indicators, at minus 0.07, is the second weakest. These readings offer tangible confirmation that both housing and manufacturing are pulling down economic growth.

But employment, importantly, continues to be the bright spot for the economy, at plus 0.11 with sales/orders/inventories fractionally positive at plus 0.02.

Also less than expected and depressed:

Existing Home Sales
existing-home-sales-feb
Highlights
Existing home sales bounced 1.2 percent higher in February to a 4.88 million annual pace which is above January’s 4.82 million but still isn’t that strong. The year, in fact, opens with the two weakest months for existing home sales since April last year. The year-on-year rate, however, is showing strength, at plus 4.7 percent in February for the strongest reading since October 2013.

The data are split between single-family homes and condos with the single-family component in front which is encouraging, up 1.4 percent to a 4.10 million pace and a year-on-year gain of 5.9 percent. The condo component was unchanged in February at 0.540 million for a year-on-year minus 3.6 percent.

The South is by far the largest region for total sales and rose 1.9 percent in February for a year-on-year plus 6.0 percent. The West and Midwest are the next largest regions with the Midwest unchanged in the month and up 4.9 percent year-on-year with the West up 1.9 percent in February for a year-on-year gain of 2.8 percent. February sales fell 6.5 percent in the Northeast, which lags in the distance in size. The year-on-year rate for the Northeast is plus 3.6 percent.

Existing homes on the market are still on the scarce side, at 4.6 months of supply and unchanged from January. A year ago, the rate was 4.9 months. Prices firmed in the latest report, up 2.5 percent to a median $202,600 and a respectable 7.5 percent ahead of a year ago. Note, however, that price data in this report are subject to volatility. Still the year-on-year reading is the best since February last year.

The housing market is soft though there are some signs of life in this report including the month’s gain for single-family sales. New home sales, like sales of existing homes, have also been soft and a decline is expected in tomorrow’s data.
existing-home-sales-feb-graph

Oil Price Drop Hurts Spending on Business Investments

By Nick Timiraos

March 22 (WSJ) — Business capital spending rose 6% last year due to gains from a broad base of U.S. industries. The drag from energy this year could cut that growth rate in half in 2015, according to Goldman Sachs. Moreover, equity analysts at the bank estimate capital spending globally by energy companies in the S&P 500 will fall 25%. Already, energy companies in the S&P 500 have announced about $8.3 billion in spending cuts. Excluding energy, capital spending will grow 4% for S&P 500 companies this year, says Citi.

Think of it this way- portfolios and speculators sold euro for dollars last year to people who sold dollars to buy euro to then make purchases from the EU, as the EU ran a trade surplus and the US ran a trade deficit.

So those euro that were sold were ‘reabsorbed’ by euro exporters who used them to pay expenses domestically, etc. as tight fiscal policy in the EU continued to keep euro in short supply.

That means the euro ‘aren’t there’ to be repurchased should the portfolios and speculators attempt to rebalance until they drive the euro high enough to reverse the trade flows.

;)

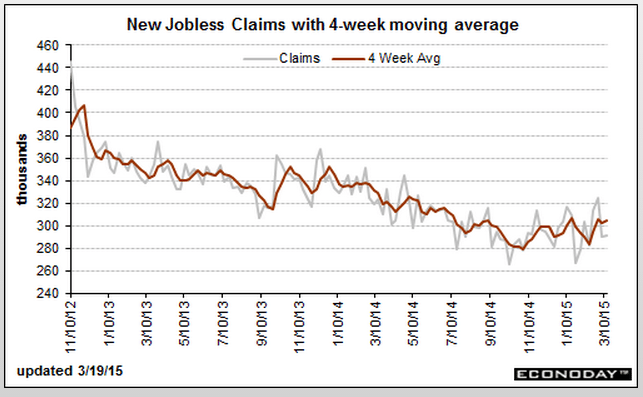
QE, the dollar, and the euro, jobless claims, US trade deficit, Philadelphia Fed survey

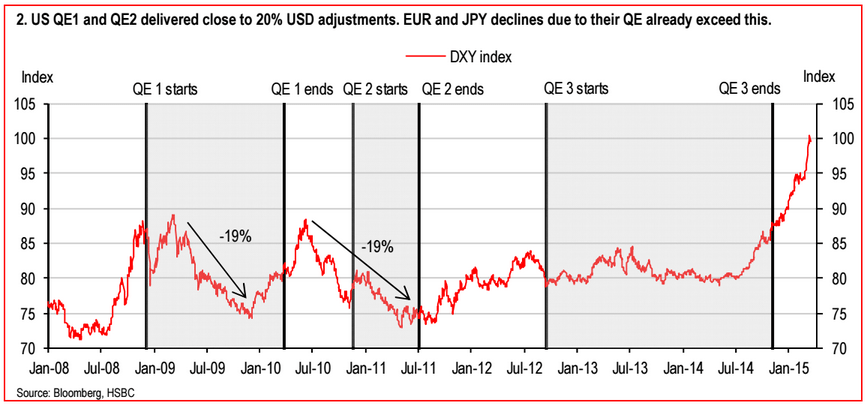
So my story is that traders and portfolio managers worried about inflation and currency depreciation from QE caused the depreciation during those periods, covering shorts and restoring dollar weightings after QE ended, returning the dollar to where it was. And now the latest spike is largely from the ECB’s QE announcement which caused strong desires to shift out of euro and into dollars. And this too should reverse at some point as, like everywhere else it’s been tried, QE will not reverse their deflationary forces or add to aggregate demand, and the euro shorts and underweight portfolios will be scrambling to get their euro back, while at the same time the current account surplus that resulted from the weak euro works to make those needed euro that much harder to get.
dxy
claims-3-12

This should take q4 GDP down a bit more for the next published revision.
And it’s also consistent with my oil price narrative as well:

Current Account
ca-q4
Highlights
The nation’s current account gap widened sharply in the fourth quarter, to $113.5 billion vs a slightly revised $98.9 billion in the third quarter and driving the gap, relative to GDP, up 4 tenths to 2.6 percent. The gap on income is the main culprit, up $11.4 billion in the quarter and reflecting declining equity in foreign affiliates as well as transfers for fines and penalties. On trade, the goods gap rose $4.1 billion but was offset in part by a $1.0 billion increase in the services surplus.

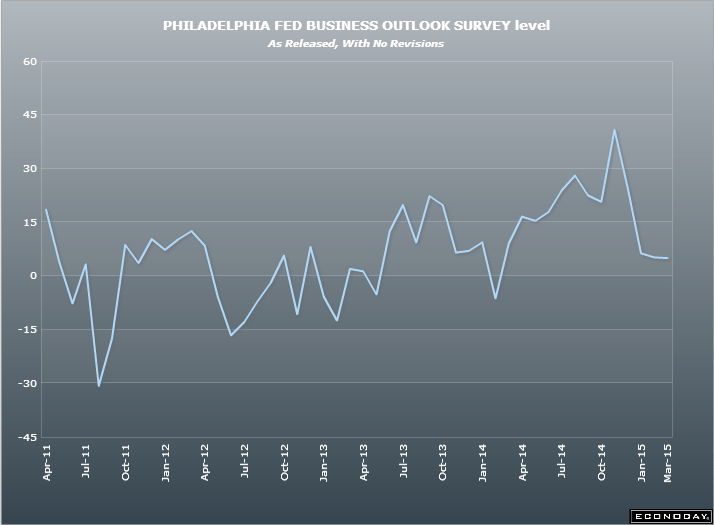
Down from last month and a bit worse than expected:

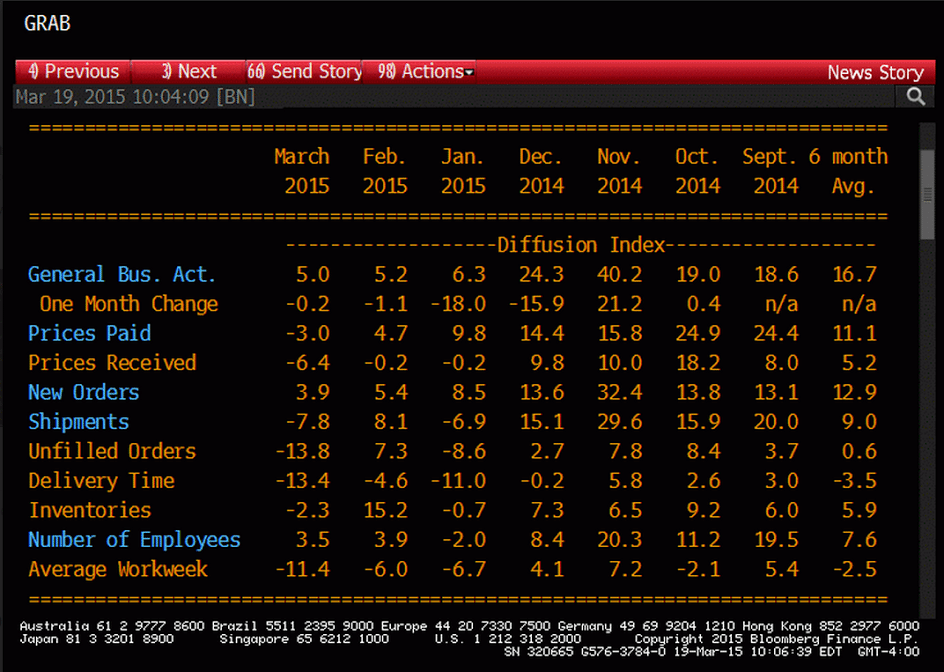
Philadelphia Fed Business Outlook Survey
philly-fed-mar-table
philly-fed-mar-detail
philly-fed-mar-graph

trade and the dollar/euro- supply and demand doing their thing

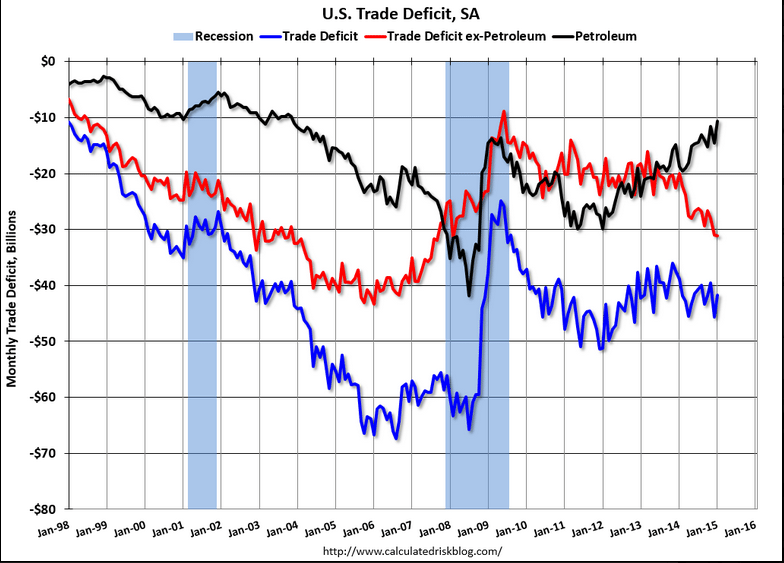
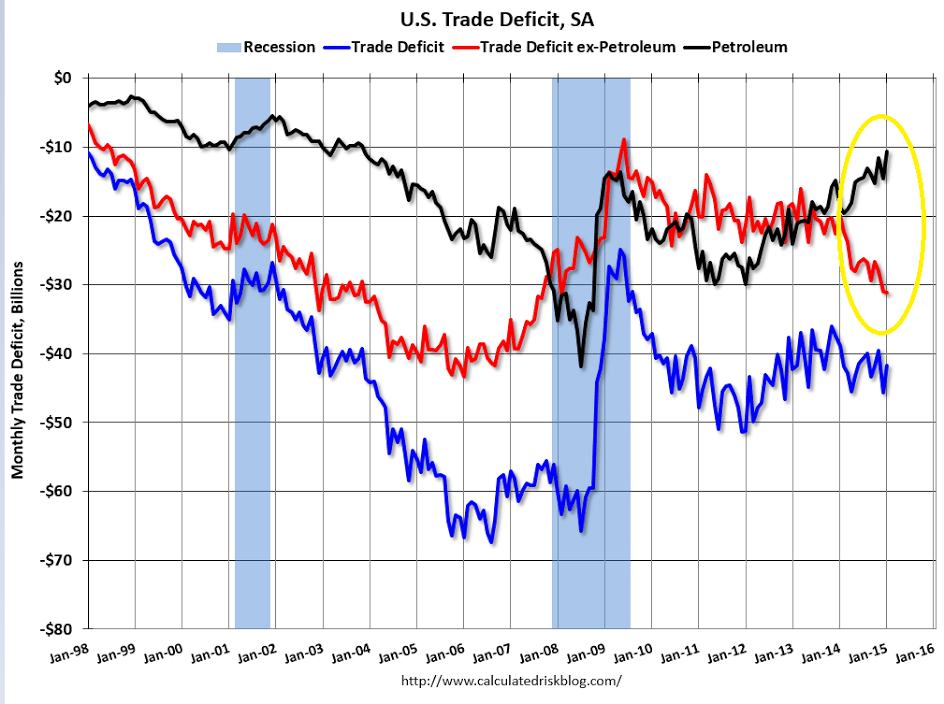
Note how the portfolio shifting that caused the dollar to appreciate has also caused the US trade deficit, excluding petroleum, to likewise increase. That is, it’s not wrong to say that the global portfolios shifting to dollars are getting more and more of those dollars from US resident’s growing net purchases of imports.

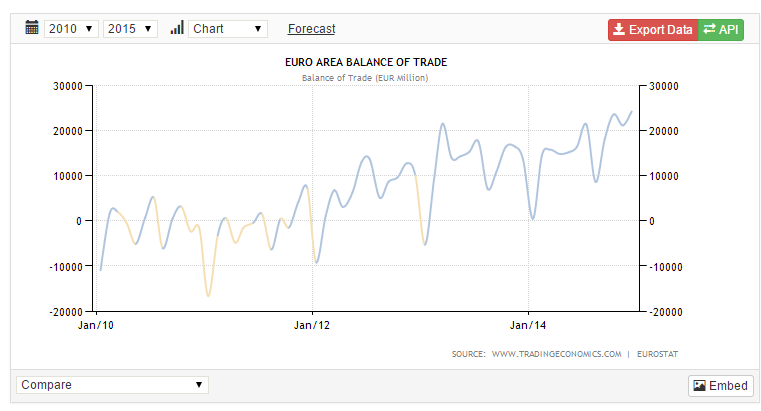
And likewise the EU is experiencing a rising trade surplus as the weak euro/strong dollar has increased EU ‘competitiveness’ by lowering their costs of labor and other domestic inputs vs their trading partners. From the EU point of view they are net selling to US residents and the selling those dollars/buying euro in the market place to get the euro they need to meet their domestic costs of production. This ‘removes’ the euro that are being sold to buy dollars.

This process continues as portfolios afraid of QE and negative rates continue to shift from euro to dollars, driving the exchange rate to the point where the trade flows accommodate their demands as markets continually adjust to express indifference levels.

Note however, that today, for example, the currencies are priced by portfolios where the US has a reasonably large and growing trade deficit and the EU has a reasonably large and growing trade surplus accommodating the ongoing portfolio shifting from euro to dollars. But what happens when the portfolio shifting subsides (which it sooner or later does as portfolios can only shift what they have in stock)? With the exchange rate at a level that is adding dollars and removing euro in line with the prior desired portfolio shifting, a drop in portfolio dollar buying/euro selling means the trade flows are generating an excess supply of dollars and creating a shortage of euro, in which case the exchange rate at the same time adjusts as per the new supply/demand dynamic. In other words, when that happens the dollar falls vs the euro and continues to fall until the trade flows sufficiently reverse to ‘restore’ balance.

From a trading point of view, however, I don’t know when the reversal will take place or from what level, but if any of you might know please let me know thanks!

us-trade-deficit

eu-trade-balance

consumer credit, trade deficit chart

Nothing good happening here either.
Looks like the jobs report was about 100,000 people taking menial jobs out of desperation again.
:(

Consumer Credit
consumer-credit-jan
Highlights
Consumer credit rose $11.6 billion in January vs an upwardly revised gain of $17.9 billion in December. Consumers did go to their credit cards in December, when the revolving credit component rose $6.2 billion, but not in January as the component fell $1.1 billion. As always, the data were boosted by the non-revolving component which rose $12.7 billion reflecting strength in auto financing and the government’s acquisition of student loans. Today’s jobs report underscores the strength of the consumer who, boosted also by low gas prices, has less and less reason to turn to credit card debt to fund purchases.

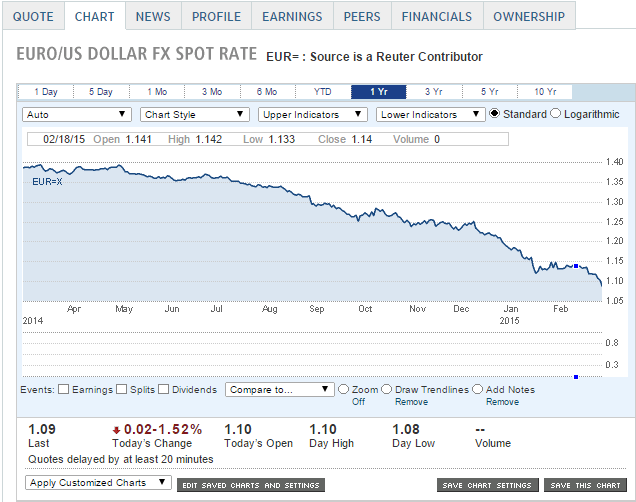
Note the rising trade deficit ex petroleum going up due to the strong dollar from portfolio shifting. And at the same time in the euro zone trade has gone strongly to surplus. This indicate the trade flows remain strongly in favor of the euro even as it declines to new lows due to portfolio managers getting underweight euro and overweight dollars due to misguided notions about QE and interest rates. And this has been happening for quite a while, from back when the dollar/euro was 130. When this shifting is exhausted, and portfolios are left underweight and short with trade removing 20+ billion euro and adding 40+ billion dollars every month to global balances, it all reverses and moves aggressively the other way. But the charts still looking like there’s still more to go as managers react to ECB QE and possible Fed rate hikes:
trade-deficit
eur-us

Jobs, Currency wars, etc.

Heaps stronger than expected:

Employment Situation
payrolls-jan
Highlights
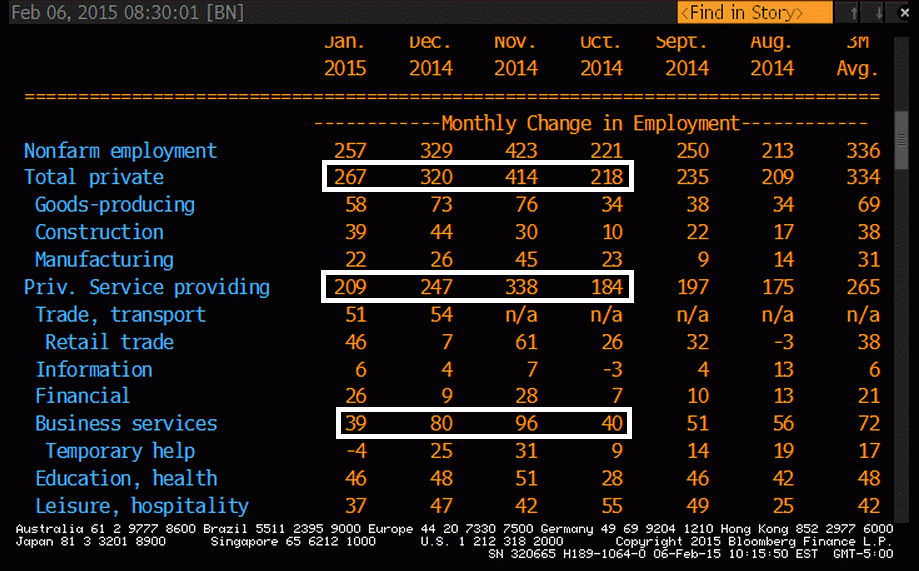
Today’s employment situation was heavily positive even though the unemployment rate edged up. Payroll jobs gained 257,000 in January after strong increases of 329,000 in December and 423,000 in November. December and November were revised up a net 86,000. With the revision, November is the strongest month since May 2010. Today’s report may tip the balance for the Fed to think about a first increase in policy rates this year rather than next-although still at a slow pace.

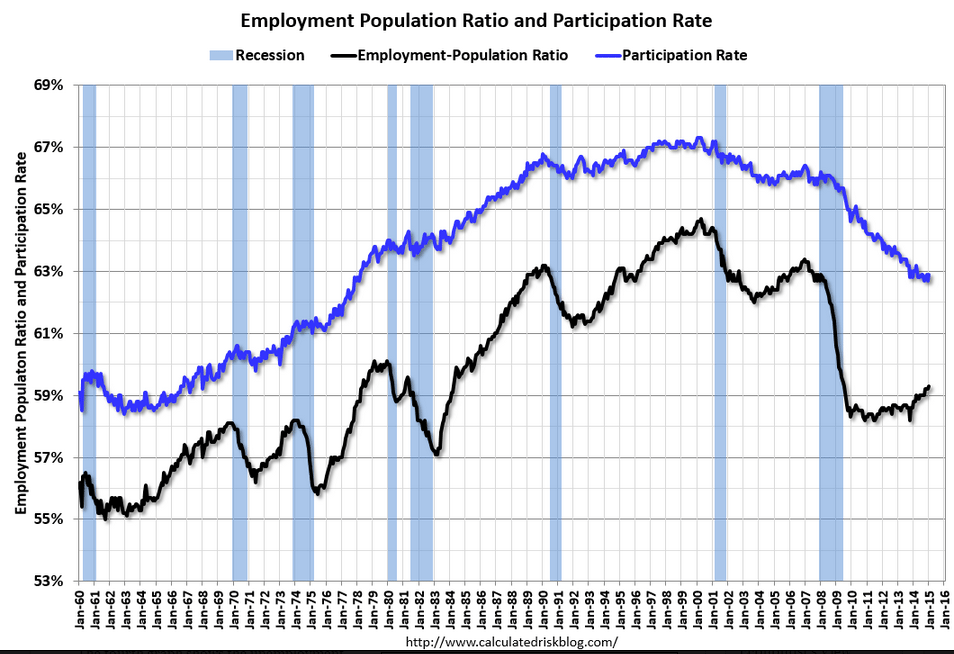
The unemployment rate nudged up to 5.7 percent from 5.6 percent in December. The rise was due to a sharp rebound in the labor force. The labor force participation rate rose to 62.9 percent from 62.7 percent in December. It appears that some discouraged workers are returning to the labor force—a positive sign for how workers view the economy.

Turning back to the establishment survey, private payrolls increased 267,000 in January after a 329,000 boost the month before.

Goods-producing jobs increased 58,000 after a 73,000 boost in December. Manufacturing increased 22,000 after rising 26,000 in December. Construction jumped 39,000 in January after gaining 44,000 the month before. Mining slipped 4,000 after rising 3,000 in December. These numbers offer hope that the manufacturing and construction sectors are improving. In recent months, they have been sluggish.

Private service-providing industries posted a 209,000 increase after a gain of 247,000 in December. Government jobs declined by 10,000 in January after a rise of 9,000 the month before.

The labor force may be tightening a bit as average hourly earnings rebounded 0.5 percent, following a 0.2 percent dip in December. However, part of the boost in wages was due to increases in some states’ minimum wage. The average workweek held steady at 34.6 hours.

Overall, the latest employment situation suggests that the consumer sector is still the current backbone of the recovery. Also, the labor market has been given an upgrade with upward revisions to November and December. A caveat for the latest report is that seasonal factors for cold weather months can be volatile.

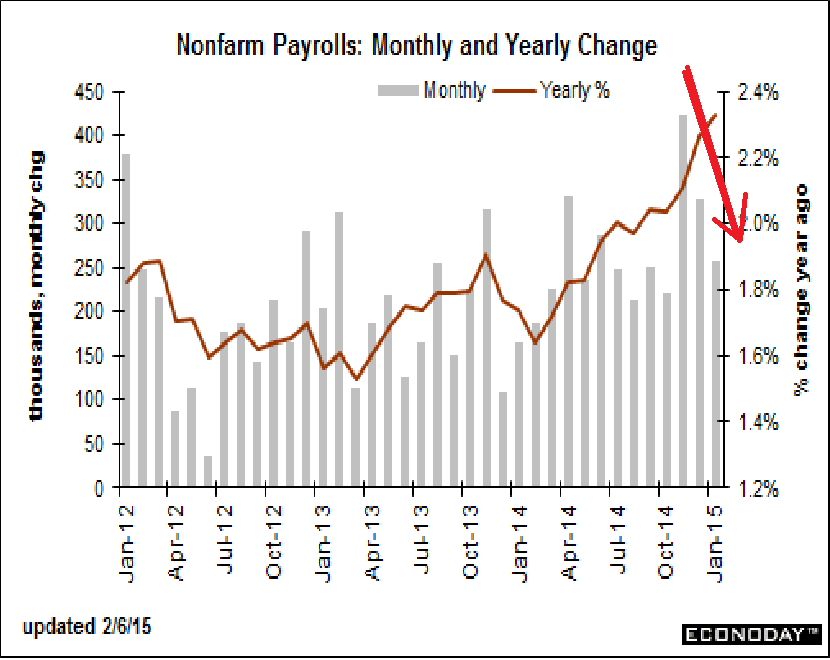
So anyone remember what that big spike in November was all about?

I don’t recall anything at the time in the news, etc. that would have indicated any kind of hiring surge was happening?

Anyway, whatever it was seems to be unwinding?
payrolls-jan-2

payrolls-jan-3

payrolls-jan-4

Currency wars, deflation fights, and with all the guns shooting backwards. As the carpenter said, ‘no matter how much I cut off it’s still too short.’

History will not be kind to these people…

Currency war a worry ahead of G-20 finance gathering (Nikkei) With a number of countries loosening monetary policy, avoiding competitive currency devaluation has emerged as a key issue for the meeting of Group of 20 finance ministers and central bankers that kicks off Monday in Istanbul. The communique released after the September G-20 meeting in Cairns, Australia, included language that in effect tacitly condoned monetary easing aimed at economic improvement. “Monetary policy in advanced economies … should address, in a timely manner, deflationary pressures where needed,” it read in part. The IMF, in January, projected growth of 1.2% in the eurozone, down 0.2 point from the October 2014 edition. The IMF cut its outlook for emerging markets by 0.6 point as well.

Fed’s Rosengren: Weak inflation is key challenge for central banks (WSJ) “The problem of significantly undershooting inflation—a dynamic which could well keep interest rates at the zero lower bound—is likely to be a key challenge to central bankers in the first two decades of the 21st century,” Federal Reserve Bank of Boston President Eric Rosengren said. “As with the oil shock in the 1970s, the current shock has served to accentuate a potential monetary policy pitfall—in this case, the failure to quickly and vigorously address a significant undershooting of inflation targets,” the central banker said. “We still are a long way from normalizing either short-term interest rates or our balance sheet,” the official said.

Benefits of aggressive Fed policy still to peak (WSJ) “The net stimulus to real activity and inflation was limited by the gradual nature of the changes in policy expectations and term premium effects, as well as by a persistent belief on the part of the public that the pace of recovery would be much faster than proved to be the case,” according to a new Fed board paper. “The peak unemployment effect—subtracting 1¼ percentage points from the unemployment rate relative to what would have occurred in the absence of the unconventional policy actions—does not occur until early 2015, while the peak inflation effect—adding ½ percentage point to the inflation rate—is not anticipated until early 2016,” write the authors.

Denmark Cuts Rates Again to Protect Currency Peg (WSJ) Denmark’s central bank scrambled to defend its under-pressure currency peg Thursday, cutting its benchmark interest rate for the fourth time in less than three weeks. The decision to cut the interest rate on deposits—to -0.75% from -0.5%–marks the latest effort to maintain the peg. Last week, the central bank, known as Nationalbanken, announced the surprise suspension of government bond auctions, and the bank said Tuesday it sold record amounts of kroner in January to weaken its currency. Nationalbanken Governor Lars Rohde tried to calm any fears about the future of the policy cornerstone. The central bank “has the necessary instruments to defend the fixed exchange rate policy for as long as it takes,” he said in a statement.

China cuts bank reserve requirement to spur growth (Reuters) China’s central bank made a system-wide cut to bank reserve requirements on Wednesday, the first time it has done so in over two years, to unleash a fresh flood of liquidity to fight off economic slowdown and looming deflation.

Greek leadership assures policy is good for its banks, while real economy and real people are devastated:

Greek central bank says ‘absolutely no problem’ with banks (Reuters) Greek central bank governor Yannis Stournaras said on Thursday that Greek banks were solid and under control. “Deposits and liquidity are absolutely safe,” Stournaras, who is also a member of the European Central Bank’s Governing Council, told reporters. “There is absolutely no problem with the banks. We are under control. It was a calm day today,” he said referring to bank deposits. Greek Prime Minister Alexis Tsipras and Finance Minister Yanis Varoufakis have been seeking support for a new deal with Greece’s international lenders that would allow an end to years of imposed austerity. “The ECB’s decision can be taken back if there is a deal from the Greek government (and its EU partners),” he said.

Not a good sign:

Baltic Dry Freight Index Plummets Amid Commodities Slump (WSJ) The Baltic Dry Index fell to 577 this week, a far cry from its peak of 11,793 in 2008. The size of the world’s fleet of dry-bulk ships far exceeds demand for the vessels which carry commodities, with over capacity estimated at around 20% above demand over the past few years. Many ships ordered at a time of booming global trade before the 2008 financial crisis have come into service as economic growth has spluttered in the years since. Rui Guo, a freight analyst at ICAP Shipping, said the tonnage in the water of dry-bulk vessels has gone up 85% since 2008, even as demand has fallen. Mr. Guo said daily freight rates for a 150,000-ton freight vessel are now around $5,500, with the break-even point around $7,500.

The Korea International Trade Association reported that exports of general machinery to China declined 7.1% in the January-November period of 2014, in contrast to a 2.0% increase in 2013.

payrolls-jan-5

flow news in 2014 is bad for the Euro

So I still see all the fundamentals/trade flows favoring the euro vs the $US, with the EU running a trade surplus and the US a deficit, and low oil prices ‘helping’ the EU trade balance while ‘hurting’ the US’s.

But the portfolio shifts continue to go the other way, including this report of CB’s shifting some 100 billion out of euro, spurred by the belief that what the ECB is doing and the Greek risk is euro unfriendly, and what the Fed is doing is $US friendly.

It’s as if the corn crop failed, and supply fell below demand, but someone with a large warehouse full of corn decided to sell it all. The price would go down until he was finished, and then the shortage due to the ongoing consumption would start driving prices higher.

Subject: flow snippet: last piece of flow news in 2014 is bad for the Euro

Every quarter the IMF puts out a snapshot of global central bank reserve composition (with a quarters lag).

Today, we got the Q3 numbers, and after accounting for valuation effects, the numbers seem to signal a shift in central bank behavior.

Normally, central banks operate with fairly fixed currency allocation targets, and when a currency goes down in value, they accumulate, to stabilize its share.

In Q3, the Euro dropped sharply vs the dollar, but both G10 and EM central banks were on the margin active sellers of Euro’s.

This is a big deal, as it suggest ‘portfolio rebalancing’ has been put on hold.

This means that stabilizing flows, which could have been in the region $100bn, are not materializing.

If this is indeed the new trend, there may be potential for a faster move lower in the Euro in early 2015, driven more purely by private sector flows.

Happy new year!
Jens Nordvig

The Euro share of global central bank reserves fell significantly in Q3. According to IMF COFER data published today, the Euro share of global reserves dropped 1.5 percentage points to 22.6%. This is one of the largest quarterly declines in the share ever. What is particularly interesting about the fall is that it was a function both of the valuation effect (a weaker Euro vs the USD) and active sales of Euros. This is striking, as normally „portfolio rebalancing‟ would create positive flows (EUR buying) to offset valuation effects when the price of the Euro declines (this happened during the early part of the Euro-crisis for example). As such, it seems that global reserve managers have may have put „portfolio rebalancing on hold‟ in the face of monetary policy divergence and negative interest rates on a large portion of their EUR holdings. If this trend continues, leaving central banks on the sidelines as the Euro declines, the Euro has potential to decline steadily in coming months in line with the trend in private sector flows.

Central Banks accumulate reserves, valuation causes total to fall

In the 2014 Q3 update of the IMF Composition of Official Foreign Exchange Reserves (COFER) data, global reserves decreased by $218bn, bringing the total reserves to $11.8trn. This is the first quarter that global reserves have fallen since the first quarter of 2009, and is only the third quarter total since the IMF began providing quarterly COFER data in 1999. The most recent data shows allocated reserves decreased by $128bn, while the unallocated reserves decreased by $90bn. However, the decline in reserves was driven by valuation adjustments. Excluding the valuation adjustments, advanced countries added $21bn in reserves, while emerging markets added $31bn.

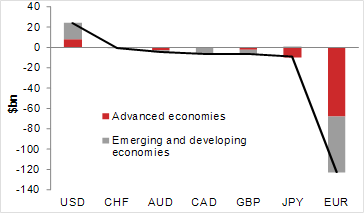
Adjusting the allocated reserves for currency valuation effects, there was central bank reserve buying of $52bn. This was dominated by USD buying, which totaled $24bn, with advanced economies buying $8bn and EM buying $16bn. EUR stood out as the most sold currency, with $3bn sold total, split with $1bn of selling from advanced economies and $2bn from emerging. EUR showed the biggest decline when including valuation and measured in USD, with reserves falling by $123bn (or just over 8% of outstanding EUR denominated (allocated) reserves).
cur-1

cur-2
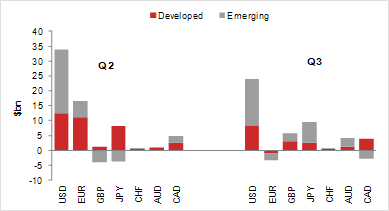
According to our central bank intervention tracker, intervention slowed significantly to just $22bn in Q3, driven primarily by a large change in tact by China, which switched to FX selling (see Quarterly central bank reserve update, 16 October 2014). The valuation-adjusted flows from the IMF also suggest that intervention slowed, although to a lesser degree, with $52bn of total accumulation compared to $71bn in Q2 (in allocated reserves).

Allocation to USD up, EUR down

With the US dollar gaining strength in the third quarter, it would have been logical to assume a tendency to sell USD and buy some of the relatively cheaper currencies in order to maintain allocations in central bank portfolios. At least this has been the general pattern of central bank behavior in the past, including during the Euro-crisis.

However, in Q3 we saw the opposite. Reserve managers actively accumulated USD and sold EUR. Meanwhile, portfolio rebalancing worked as normal for other currencies, with reserve managers actively buying JPY, AUD and GBP during Q3, helping to stabilize allocated shares. With regard to the Euro, the active selling exacerbated the valuation effect rather than countering it. Hence the USD allocation jumped sharply to 62.3% from 60.7% (a 1.6pp increase) globally and EUR allocation fell to 22.6% from 24.1% (a 1.5pp decline). This fall in EUR allocation globally is the largest in a quarter since Q1 2004 (and larger than the declines during the Euro crisis periods). The USD allocation gain is tied historically with Q1 2004 as the largest.

One reason for the shift out of EUR as a reserve currency could be the low and often negative yields in Eurozone assets. As we highlighted in The Trillion Euro Question, a large amount of short-term bonds and deposits held in Eurozone assets were earning negative yield and at risk for a shift out of the Eurozone. If global reserve managers have indeed disabled portfolio rebalancing in the context of their EUR share, it has important negative implications for the Euro in coming months

If global reserve managers have indeed disabled portfolio rebalancing in the context of their EUR share, it has important negative implications for the Euro in coming months.

Comments on Greece

A couple of ‘fundamentals’

A default/restructure/debt reduction of any form removes euro financial assets and is a contractionary/deflationary bias that makes euro ‘harder to get’ and thereby firms the currency.

Also, Greece has been running a budget deficit, which adds net euro the global economy, making euro easier to get, etc. so if Greece leaves the euro that source of net euro financial assets goes away as well, also fundamentally firming the euro.

And any Greek contribution to the euro trade surplus would be lost, which would work to weaken the euro.

Not that markets would initially react this way!!!
;)

As we had been expecting, the third and final round of the Greek parliamentary vote to elect a new President failed this morning and the country is now headed for a general election. The most likely date for this is January 25th (+/- a week, elections are always held on a Synday), with the constitution stipulating that parliament has to now be dissolved within ten days (most likely tomorrow) and elections held as soon as possible after. With Greek banks still reliant on the ECB for funding and bond maturities ongoing throughout 2015, a significant period of political and financial uncertainty now opens up for Greece and the Eurozone as a whole. Here are the three major questions that need to be answered as we enter the New Year:

1. What will the European response to early elections be?
Greece now has to deal with exceptionally pressing deadlines from its creditors. The current financing programme has been extended to the end of February to allow Troika negotiations to conclude and disburse the remaining 1.8bn EFSF funding before transitioning into a new financing arrangement (most likely an ECCL). If this deadline lapses without agreement, Greece will legally no longer be “under a program” and the undisbursed amounts will cease to exist. The European position across three fronts will therefore need to be clarified.

First, how “hard” is the February headline? Assuming the election takes place on January 25th, it will take around another 10 days to elect a new president (three 5-day distance parliamentary rounds are required, but the second round only requires 150 MP majority), and probably at least a week to form a new governing coalition.* With at best a few weeks left for a new government to negotiate the disbursement of the final tranche and a new credit line, completing talks will be a tall order. European partners will need to discuss if they would be open to another program extension, or if talks would have to start on a blank slate. Both avenues would require fresh approval of the extension or new funding from national parliaments.

The second question relates to ECB funding of Greek banks. We estimate that at least a third of the current 42bn EUR of Eurosystem financing is reliant on collateral that currently benefits from a credit rating threshold suspension from the ECB. It would become ineligible in the event the Greek program expires in February without a financing umbrella. Where the program to lapse after February, part of Greek bank funding would have to shift to Emergency Lending Assistance (ELA) at the Bank of Greece. With the size and scope of ELA financing being under bi-weekly review and press reports suggesting that the Governing Council is considering a broader re-think of its terms and conditions, ECB policy on Greek bank funding remains a key source of uncertainty as well as the most direct means of putting pressure on a new Greek government.

The third and final question relates to the Troika’s broader willingness to negotiate and compromise with a new government. As with the negotiations this year, the primary source of disagreement is likely to remain the fiscal gap for 2015, with the Troika’s current demands standing at a 3 percent primary balance target equivalent to a 2bn fiscal gap versus the current government’s budgeted measures. Our prior is that with a new government in place and a fresh 4-year mandate, the Troika would be more willing to give leeway to authorities to assess budget execution over the course of 2015 rather than voting a large number of proposed fiscal measures upfront, if not revising the primary balance target lower. Still, the timing and extent of such concessions remains highly uncertain, if at all possible.

Despite the pressing nature of the above questions, we would not expect full clarity from European authorities on any of the three fronts above while the election period in Greece is in full swing. The Eurogroup next meets on January 18th where local press reports that the European Commission will present a preliminary report on the terms and conditions which Greece would need to satisfy to remain eligible for an ECCL as well as complete the final review of the current program. A further extension of the latter in any case requires a formal request from the Greek government, and we would expect international creditors to remain quiet on most fronts until a new Greek government has emerged.

2. Who will win the Greek election?

The ability to meet the deadlines above in large part depends on the outcome of the general election and the position of the new government. Opinion polls have been showing a consistent lead for the Radical Left SYRIZA party over ruling New Democracy in the last few months, and our baseline remains that SYRIZA wins the elections. Still, the parliamentary and governmental outcome is not a foregone conclusion. First, SYRIZA’s opinion poll lead over New Democracy has narrowed from 4-6 percentage points over the last few months to 3-4 percent currently. With the political environment remaining particularly fluid (and polls unreliable), the outcome on voting day is not a done deal. Second, a SYRIZA first does not guarantee a parliamentary majority. Greek electoral law operates under an enhanced representation system that allocates the first 50 parliamentary seats as a bonus to the first party, with the rest split proportionately. This in practice requires a party to win 34-38 percent of the national vote to gain an absolute majority. As things stand, SYRIZA would win around 140 MPs in parliament and be required to form a coalition* with at least one of the following four smaller parties that are projected to enter parliament:

The River (“To Potami”) – this is a newly founded moderate left-off-centre party that has been founded by journalist Stavros Theodorakis a few months ago. We would consider this the most likely coalition partner, given that the party has openly expressed a desire for coalition-making. The party is currently polling around 7pct.

Independent Greeks – this is a radical populist party sitting on the right of the current government, whose main policy plank has been opposing current “memorandum policies”. While the party stands at the opposite end of the spectrum from SYRIZA on a number of non-economic issues (eg. immigration, separation of church and state), both sides have indicated they would be open to discussions on a governmental program. The party is currently polling at the fringe of the 3 percent threshold required to enter parliament.

PASOK – the current junior coalition party member, the stigma attached to this party would make it a more difficult coalition candidate for SYRIZA. Still, it is possible that the party is faced with internal pressure in coming weeks that forces a leadership change making coalition-making easier. Indeed, local press is reporting that former prime minister Papandreou (whose father founded the party) is considering running under his own separate platform.

Communists – with the agenda of this party being firmly against EU membership, it is the least likely coalition partner of the above.

As things stand, our baseline remains that either a SYRIZA-Potami or SYRIZA- Independent Greek coalition remain the most likely outcomes after a Greek election.

3. What will the new government’s position be?

A New Democracy win is likely to lead to a relatively swift agreement with the Troika by the end of February, likely meeting the relevant deadlines. In contrast, a SYRIZA government has the potential to create a much wider set of possible outcomes. Even more so that international creditors, the negotiating position of a new SYRIZA government is highly uncertain, and not yet fully clarified within the party itself.

Speaking in a Reuters interview a few days ago, SYRIZA leader Alexis Tsipras stated that the party is fully committed to Eurozone membership, and has no intention of making unilateral moves on the existing agreements “unless forced”. Ultimately however, the party’s position is likely to be dependent on a number of factors: (i) the internal political dynamics within the party, which is composed of a number of competing groups. Most vocal of these is the “left platform” led by current parliamentary spokesperson Panagiotis Lafazanis, who sits to the left of the leadership and favours a more confrontational stance versus international lenders; (ii) the outcome of the general election and the potential partner that emerges, with a “River” or PASOK coalition having a much greater moderating influence on the party than Independent Greeks or an outright SYRIZA majority; (iii) market pressure in the run-up to the election.

Ultimately, the party’s position on Europe is unlikely to be fully fleshed out until February, most likely formulated by the leadership team that emerges around party leader Tsipras, inclusive of the person that is appointed to lead the finance ministry. Nikos Pappas (party leader’s chief of staff), Yannis Milios (responsible for economic policy), George Stathakis (responsible for development policy), Yannis Dragasakis (current deputy Speaker of parliament) and Dimitris Papadimoulis (current member of the European parliament) all stand out as potential influential members of a new SYRIZA-led government.

Conclusion
To sum up, markets are likely to be left with more questions than answers until the domestic political progress in Greece plays out more fully over the next two months. In the meantime Greek financing needs over the course of 2015 are ongoing, with large uncertainty on when the government will lose its ability to repay maturing obligations. We estimate this would take place at some point in the second quarter of next year, with a 1.4bn IMF maturity being due in March, another 2.5bn due to the IMF over Q2 and a large 4.2bn GGB payment due to the ECB in July. Ahead of that the role of the ECB – in particular the willingness to tolerate ELA financing of Greek banks in the face of potential renewed deposit pressure on the financial system – will be a key pressure point between Europe and a new Greek government.

Ultimately, we see a consensual outcome between a SYRIZA-led government and its creditors as achievable, but it would require a moderation from both sides. On the European front, it would consist of a lowered primary balance target for this and coming years and an offer of additional official sector debt-relief via maturity extensions – we would consider neither impossible given the adjustments in fiscal targets already granted to other peripheral economies and the low political cost of maturity extensions. On the SYRIZA side, agreement would require the party to give up on its pledges to reverse structural reforms as well as a commitment to maintaining a path of fiscal prudence.

This notwithstanding, convergence is not currently apparent and is unlikely to become so until well after January. It requires both sides to shift to a consensual rather than confrontational approach, in turn perhaps dependent on greater market pressure. Either way, large uncertainty and path-dependent outcomes suggest damaging confrontation cannot be ruled out, which in turn has the potential to generate much greater destabilizing outcomes for Greece and the Eurozone as a whole in 2015. The New Year welcomes Europe with renewed challenges.

George

*If a government does not win an outright 151 majority of MPs, the leader whose party leader comes first is given a 3-day mandate to explore the possibility of a coalition government with other parties. If this fails, the mandate is passed to the second largest party and so on. If all three largest parties fail to secure a coalition, the country goes to a new general election

**The rating threshold exemption is apparent in the ECB document detailing GGB haircuts here: https://www.ecb.europa.eu/ecb/legal/pdf/en_ecb_2014_46_f_sign.pdf

Japan etc.

The 10 year note in Japan closes below .3%- that’s what happens when you have the largest deficit in the world…
;)

jgb-rates

And note the yen has gone from just under 80 to the $ not that long ago to just over 120 recently. That’s over 50%, about the same as the ruble. So the ruble vs yen is about back to where it was before both depreciated vs the $. And that goes for other currencies as well, including the euro. Which also means the price of oil in those currencies has been steady to only a bit lower.

In other words, if you squint, it all has the appearance of a US deflation…

Merry Christmas!!!