Truck tonnage, Philly Fed Coincident Index, ECB policy, Credit Check

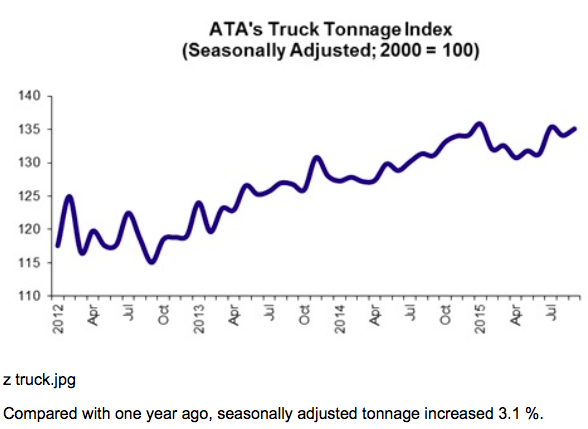
Signs of stabilizing:
er-10-25-1
er-10-25-2

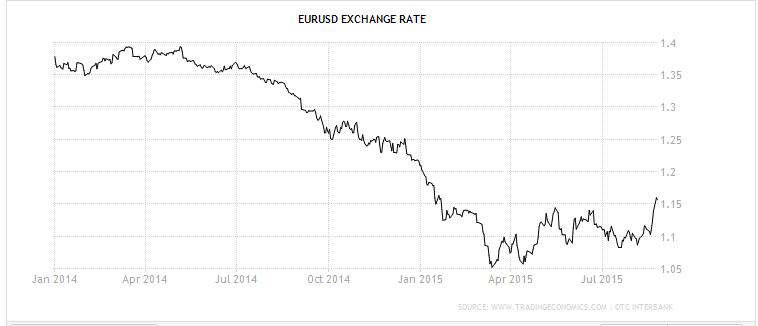
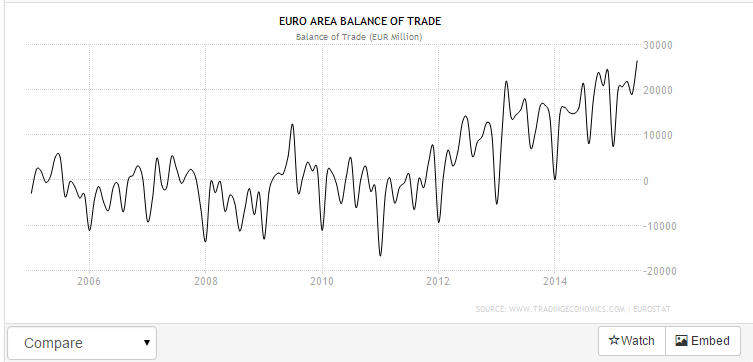
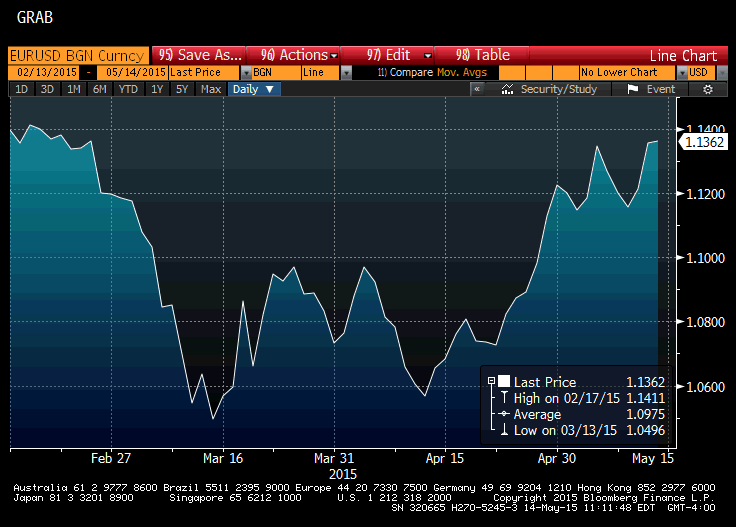
So the ECB threatened more negative rates and QE, both placebos at best, analogous to spraying the crowd with a barrage of blanks, which nonetheless dispersed the crowd. However, with the record and growing euro area 31 billion trade surplus last month and a growing US trade deficit augmented by increased petro imports as domestic production falls, I expect those fundamentals to dominate:
er-10-25-3

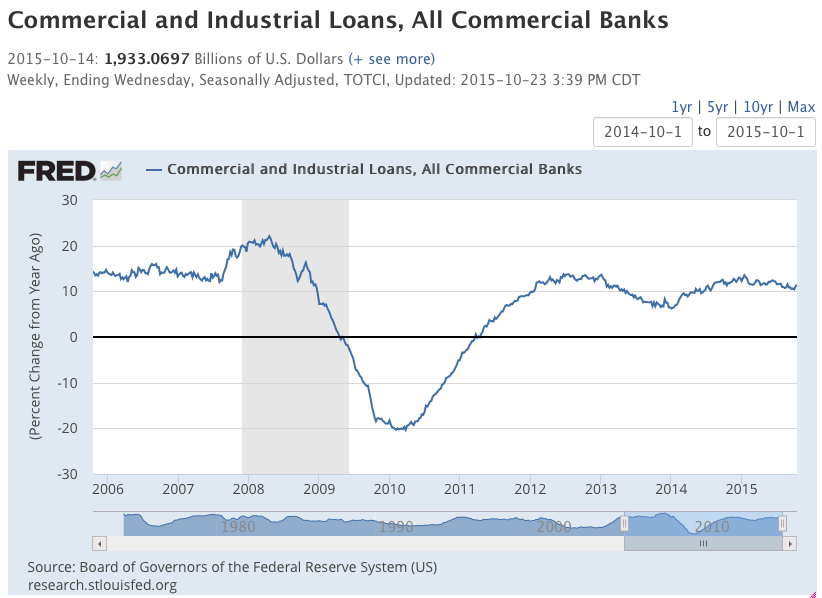
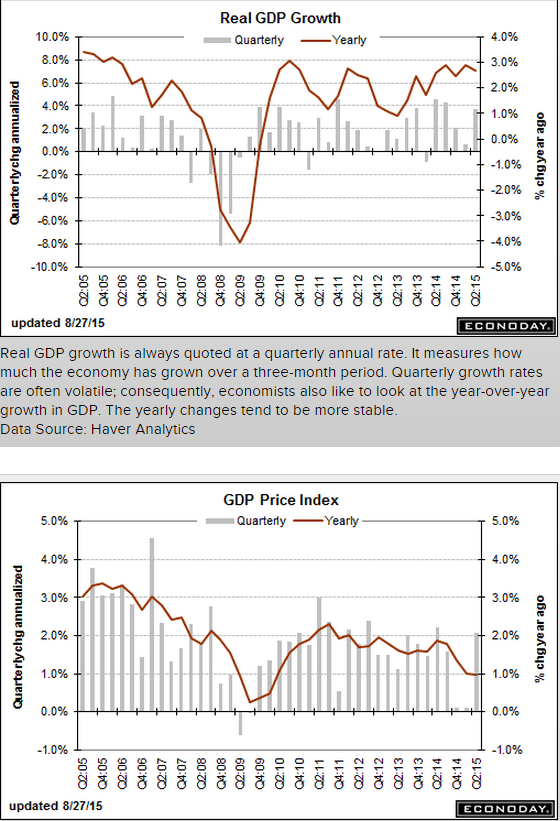
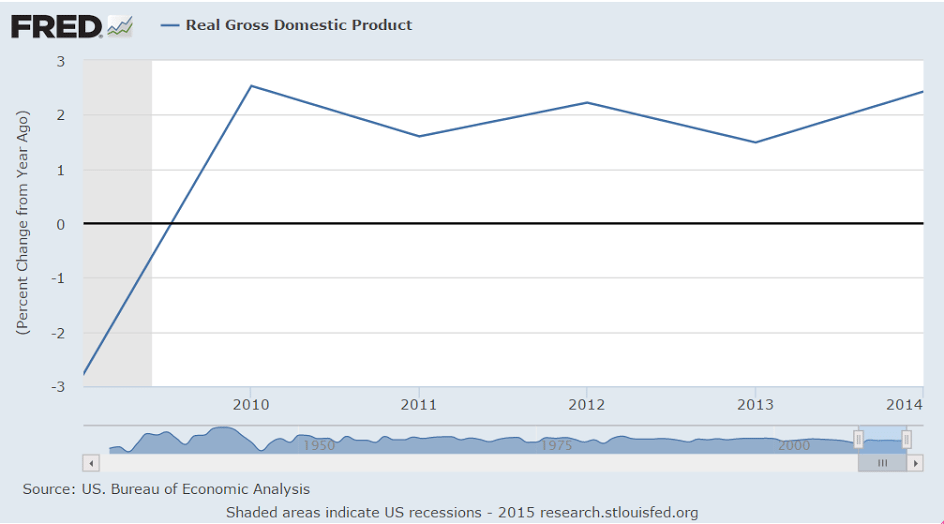
Interesting how growth that supported GDP in 2014 peaked as oil price broke down:
er-10-25-4
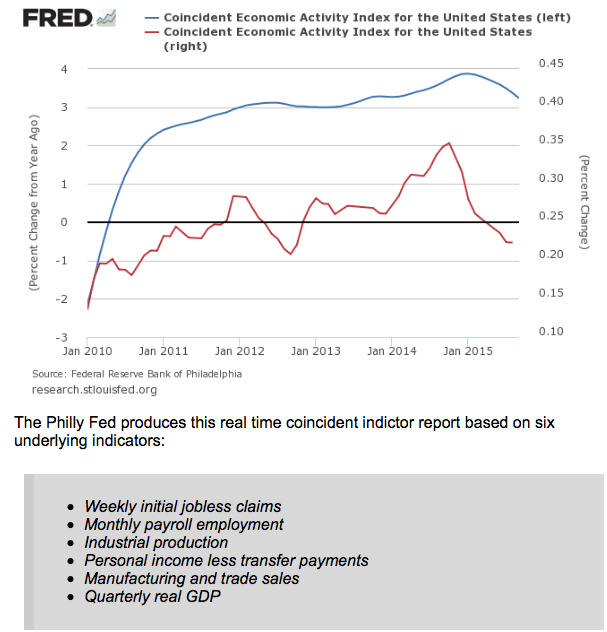
This new indicator now shows 2 weeks flattening, but not enough history to make a call based on it:
er-10-25-5
This, too, changed slope after oil supported growth reversed:
er-10-25-6
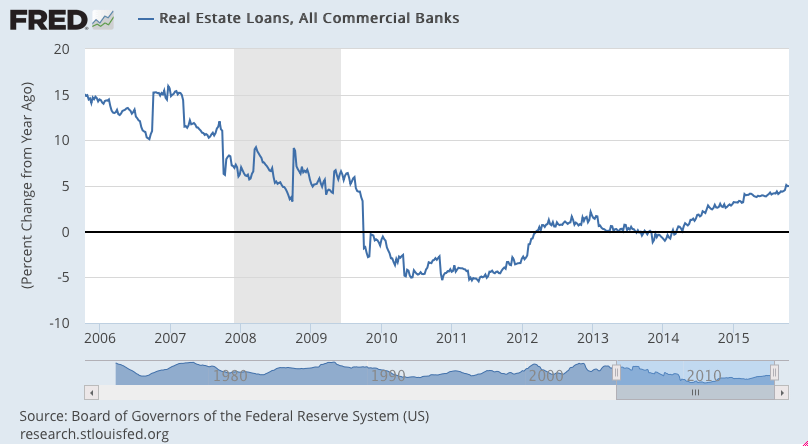
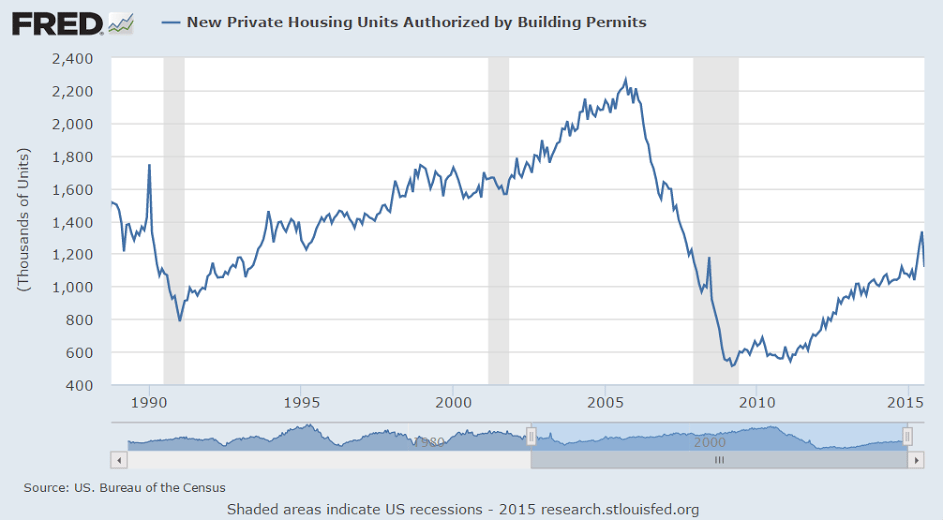
The growth rate remains historically very low (particularly given the ultra low rates?). Some of the increase is due to the drop in ‘all cash’ purchases, some due to the higher sales prices, etc.
er-10-25-7

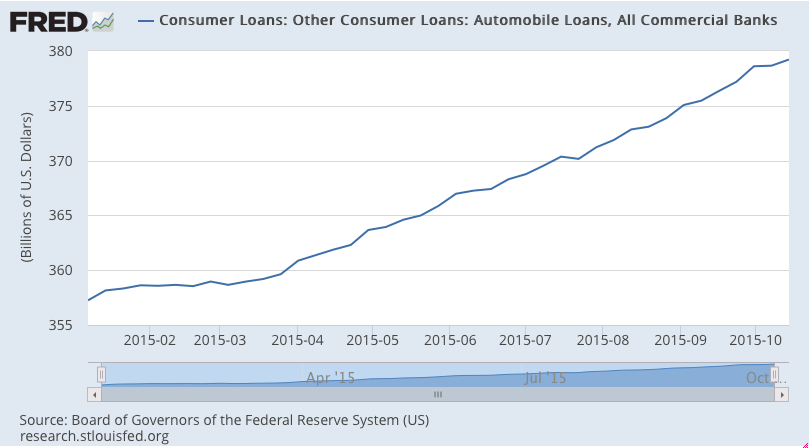
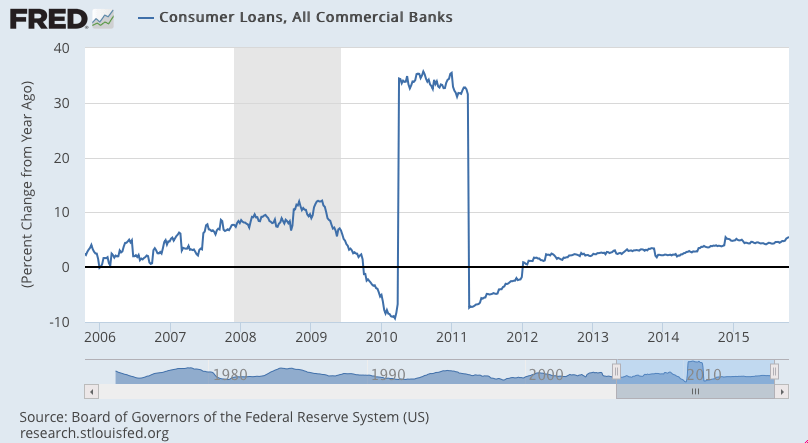
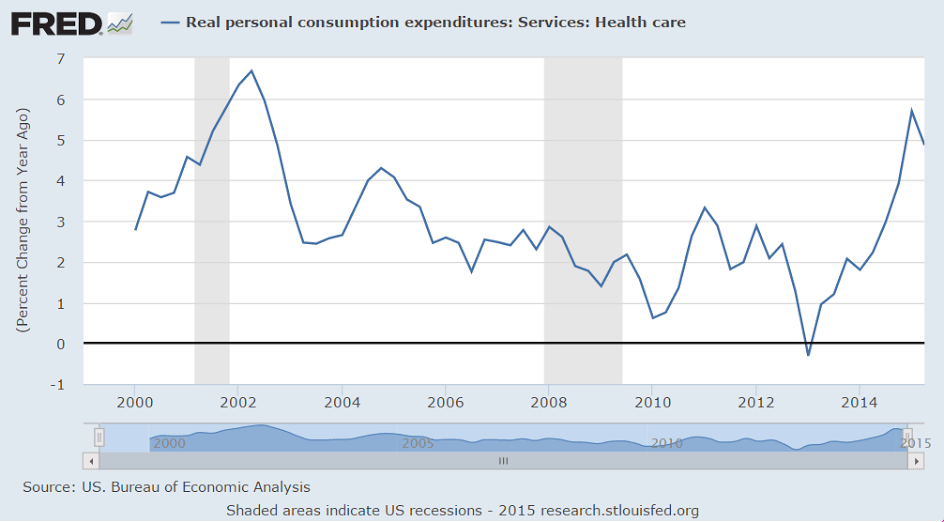
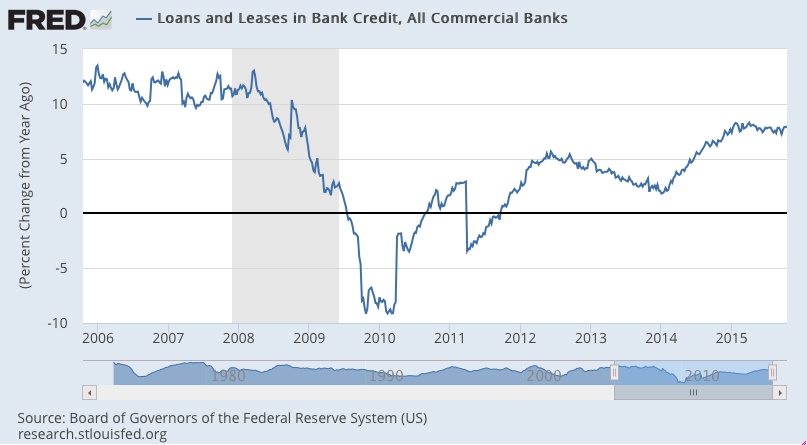
The growth rate has picked up some as it tends to do when entering a recession and consumers borrow extra for a while as incomes are stretched before breaking:
er-10-25-8

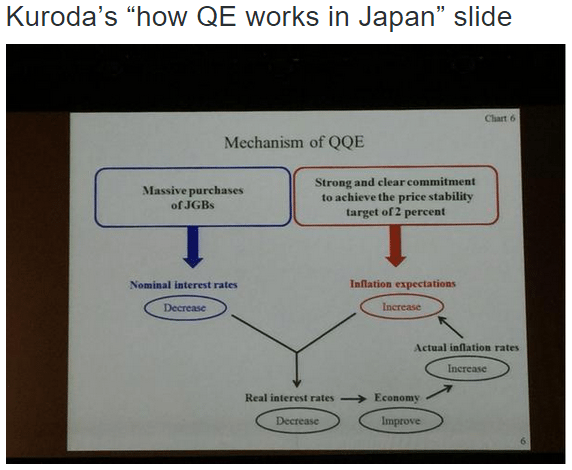
WRKO Interview, GDP, Pending Home Sales, KC Fed, Corporate Profits, BOJ QE chart

WRKO Interview

Higher than expected, still a bit lower year over year, and supported by heavy unsold inventory building that’s exceeding the growth of new orders, as well as an increase in net exports which is counter to all the survey information and other hard data as well. Net export reports tend to be volatile, with relatively large zigs followed by large zags. And note reported GDI- gross domestic income (the flip side of GDP)- was up only .6 as discussed below. And a few comments below on health care premium expense:

United States : GDP
er-8-27-1
Highlights
The second-quarter did show a big bounce after all, up at a revised annualized growth rate of 3.7 percent which is 5 tenths over the Econoday consensus and just ahead of the high estimate. The initial estimate for second-quarter GDP was 2.3 percent. This report points to better-than-expected momentum going into the current quarter.

Consumer demand was strong with personal consumption expenditures at a 3.1 percent rate led by an 8.2 percent rate for durables, a gain that was tied to vehicle spending. Residential investment was very strong, at plus 7.8 percent, as was nonresidential fixed investment which, boosted by an upward revision to structures, came in at plus 3.2 percent. Inventories contributed to second-quarter growth as did improvement in net exports. Final demand proved very solid, at plus 3.5 percent. The GDP price index, unlike many other price readings, is showing some pressure, at 2.1 percent and just above the Fed’s general policy goal.

The economy’s acceleration is now much more respectable from the first quarter when growth, at only 0.6 percent, was depressed by heavy weather and special factors. Splitting the difference, first-half growth came in a bit over 2 percent which, as it turns out, is right in line with the similar performance of 2014 when first-quarter growth, again depressed by severe weather, fell 2.1 percent followed by a 4.6 percent surge in the second quarter. Growth in the third quarter last year was 4.3 percent which would be a very good performance for this third quarter.

The impact of today’s report on Fed policy for September’s FOMC is likely to be minimal. Focus at the upcoming meeting will be on the state of the global financial markets and, very importantly, the strength of next week’s employment report for August.

er-8-27-2

Note the volatility of exports and imports, particularly for the last two quarters:
er-8-27-3
er-8-27-4

The state and local increase looks suspect as well:
er-8-27-5
er-8-27-6

The upward revisions to second-quarter growth also reflected the accumulation of $121.1 billion worth of inventories, up from the previous estimate of $110 billion. That meant inventories contributed 0.22 percentage point to GDP instead of subtracting 0.08 percentage point as reported last month.

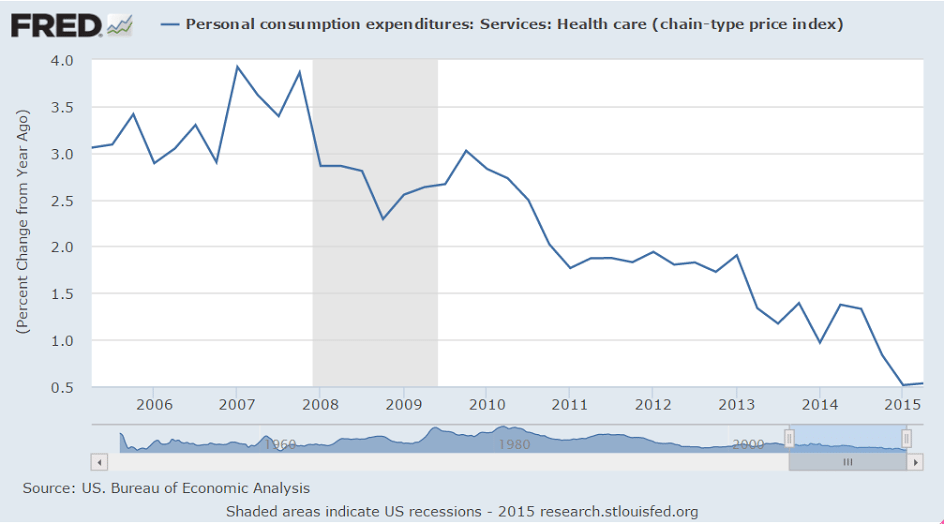
Apparently health care premiums are counted as personal consumption expenditures, and with the ACA there’s a one time increase in progress as more people get funded to pay premiums. This is adding some support to GDP growth until it levels off.
er-8-27-7

This has not necessarily increased actual health care services received or costs:
er-8-27-8

Gross domestic income was also released. While GDP measures total sales, GDI measures total income received from those sales. So while those numbers are necessarily identical, in practice they tend to differ initially as they are calculated independently and entail numerous estimates, and converge over time as hard numbers become available.

This is from the US Bureau of Economic Analysis:

Real gross domestic income (GDI) — the value of the costs incurred and the incomes earned in the production of goods and services in the nation’s economy — increased 0.6 percent in the second quarter, compared with an increase of 0.4 percent (revised) in the first. The average of real GDP and real GDI, a supplemental measure of U.S. economic activity that equally weights GDP and GDI, increased 2.1 percent in the second quarter, compared with an increase of 0.5 percent in the first quarter.

No acceleration here:

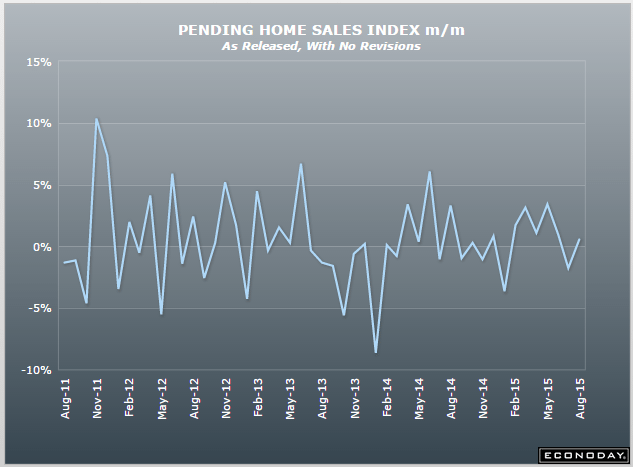
United States : Pending Home Sales Index
er-8-27-9
Highlights
Pending home sales came in at the low end of expectations, up however a still respectable 0.5 percent. Regional data show a strong 4.0 percent gain for the Northeast, which however is the smallest region for existing home sales, and a 1.4 percent dip for the West. Sales were unchanged in the Midwest and rose 0.6 percent in the South which is the largest region. This report is positive but far from exceptional, pointing to no more than moderate growth ahead for existing home sales.

er-8-27-10

The bad news in manufacturing continues:

United States : Kansas City Fed Manufacturing Index
er-8-27-11
Highlights
Factory activity in the Kansas City Fed’s region remains in deep contraction, at minus 9 in August vs minus 7 in July and deeper than the Econoday consensus for minus 4. New orders are also at minus 9 with backlog orders at minus 21. These are deeply depressed readings that point to a long run of weak activity in the months ahead. Production is already far into the negative column at minus 16 with hiring at minus 10. Price readings in the August report are in contraction.

This report speaks to significant distress for the region which is getting hit by the oil-led fall in commodity prices. Taken together, regional reports have been mixed to soft so far this month, pointing to slowing for a factory sector that got a bit boost from the auto sector in June and July. The Dallas Fed report, which like this one has been badly depressed, will be posted on Monday.
er-8-27-12

This is amateur hour.

After 20 years of this stuff, they still just need more time…
er-8-27-13

quick macro update

It all started when the FICA tax cuts and a few of the Bush tax reductions were allowed to expire at the end of 2012, followed by the sequesters a few months later 2013. That resulted in 2013 GDP growth of a bit less than 2% or so that might have been closer to 4% without the tax hikes and spending cuts.

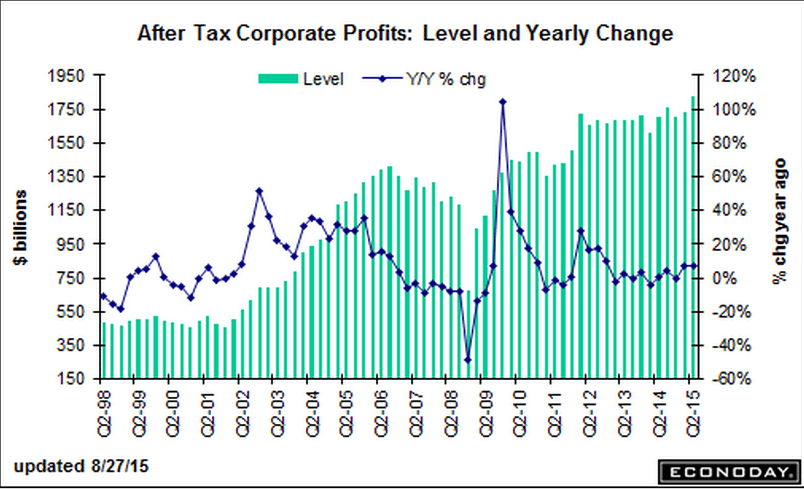
Going into 2014 GDP I suggested growth might be closer to 0 than to the 3.5% being forecast. It again printed about in the middle averaging a bit over 2% (with some ups and downs…), and then towards the end of 2014 the price of oil collapsed and it was discovered there had been $hundreds of billions of planned capital expenditures that would be cut, domestically and globally, after which I again suggested GDP growth for the year- this time 2015- would now be near 0, and in fact could well be negative. Additionally, it was revealed the extent to which it was the large and growing oil capex expenditures up to that time that had been supporting at least 1% GDP growth up to that point. And so far GDP growth for 2015 has been less than 2014, even after 2014’s recent downward revisions, and along with slowing GDP has come slowing corporate revenues and earnings growth. All subject to further revisions, of course, which lately have been downward revisions.
macro-8-24-1

Meanwhile, in the first half of 2014 the euro began falling against the $ as well as other currencies. The fall coincided with the ECB threatening and then following through with negative rates and QE, much to the consternation of global portfolio managers, including Central Bankers, pension funds and hedge funds, who collectively proceeded to lighten up on their euro allocations. And along the way, issues surrounding Greece further frightened the portfolio managers into further selling of euro assets. This relentless selling pressure drove the euro down, particularly vs the US dollar. Specifically, a euro based portfolio manager might, for example, sell his euro securities, and then sell the euros to buy dollars, and then use the dollars to buy US stocks. Or a CB might manage its reserves such that the % of euro assets declined vs dollar assets. And a hedge fund might simply buy the $US index, which is about half dollar/euro and a way to sell euro and other currencies vs the dollar. All of this, along with several other ways to skin the same cat, constituted euro selling that drove the dollar up and the euro down, and at the same time produced buyers of US stocks.

Fundamentally, however, the opposite was happening. The euro area had a (small) trade surplus, which was removing euro from global markets, but not as fast as the sellers were selling, and the euro went ever lower. But as it did this it made the euro area that much more ‘competitive’ (euro area goods and services were that much less expensive in dollar terms) which resulted in an ever larger trade surplus, with the latest release showing a record trade surplus of about 24 billion euro per month. And at the same time, the increased euro exports helped support the economy and generated forecasts for improved future growth, all of which supported euro stocks.

It now appears the curves (finally) crossed, with the euro area trade surplus now exceeding the euro portfolio selling which seems to have run its course, which caused the euro to bottom and start to appreciate. This started generating adverse marks to market for those short euro and long US stocks, for example, who subsequently began reversing their positions by buying euro and selling US stocks. And the strong euro also threatens euro area exports and therefore output, employment, and GDP forecasts, causing euro stocks to sell off as well.

So far I’ve left out what turned out to be the catalyst for this reversal- China. When China moved to allow the yuan to trade lower against the dollar, it was deemed a credible threat to both euro and US exports, and world demand in general, which set off the latest wave of selling.
macro-8-24-2
macro-8-24-3

So what’s next?

More selling of US stocks and buying euro to reverse those positions. Hedge funds might move quickly, but, for example, pension funds often do their reallocating at quarterly and annual meetings, so it could all take quite a bit of time.

Additionally, buying of euro will drive the euro up, as there is no ‘excess supply’ being generated. Quite the reverse, in fact, as the trade surplus works to make euro that much harder to get. That means the euro will appreciate until the trade surplus reverses (whether there is any causation or not…), which should prove highly problematic for the euro economy and euro stocks. The other side of this coin is the weaker dollar that should lend some support to the US stock market, though a collapsing euro area economy with it’s associate debt issues and political conflicts might do more harm than the weak dollar does good, not to mention the weakening domestic demand in the post oil capex world with no relief in sight from other sectors.

Lastly, the stock market has been maybe the best leading indicator, and probably because of it’s direct effect on perceptions of wealth and its influence on spending and investing decisions. And the Fed doesn’t target stocks,
but it doesn’t ignore them either, as it too recognizes the influence it can have on output and employment, especially on the downside.

Of course all of this can be reversed for the better with a simple fiscal expansion, as the underlying problem remains- the Federal deficit is too small in the absence of sufficient private sector deficit spending needed to offset desires to not spend income. (Yes, it’s always an unspent income story…)

But politics, at least for now, renders that sure fire remedy entirely out of the question.

Fed white paper, building permits, transport charts, Japan trade


So someone on high sees it much like I do…

;)

In a white paper dissecting the U.S. central bank’s actions to stem the financial crisis in 2008 and 2009, Stephen D. Williamson, vice president of the St. Louis Fed, finds fault with three key policy tenets.

Specifically, he believes the zero interest rates in place since 2008 that were designed to spark good inflation actually have resulted in just the opposite. And he believes the “forward guidance” the Fed has used to communicate its intentions has instead been a muddle of broken vows that has served only to confuse investors. Finally, he asserts thatquantitative easing, or the monthly debt purchases that swelled the central bank’s balance sheet past the $4.5 trillion mark, have at best a tenuous link to actual economic improvements.

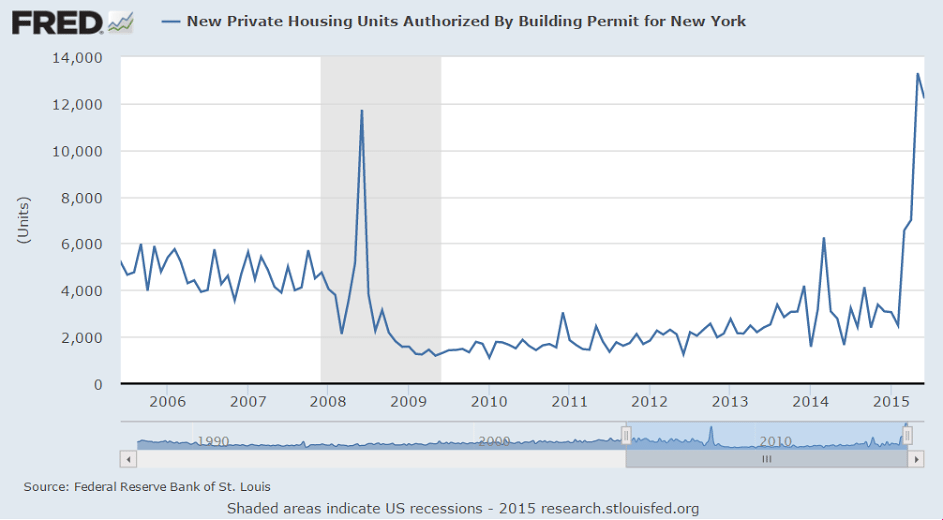
Remember last month cautioning about how a spike up in building permits has sometimes been followed by recession?
er-8-19-1
And the NY benefits that expired June 15 were supporting the total numbers and are likely to be followed by much lower numbers:
er-8-19-2
Once again Varoufakis reconfirms he’s clueless with regard to public finance:

Varoufakis Proposal for Eurozone Sovereign Debt

August 18 (Econintersect) — Former Greek finance minister Yanis Varoufakis has proposed a debt restructuring process for over-indebted Eurozone countries that does not involve writing down debt or bailing out insolvent countries. It is based on an idea proposed by Varoufakis with Stuart Holland and James K. Galbraith (link below).

The proposal is for a complex and costly process functionally identical to a simple, no cost, ECB guarantee.

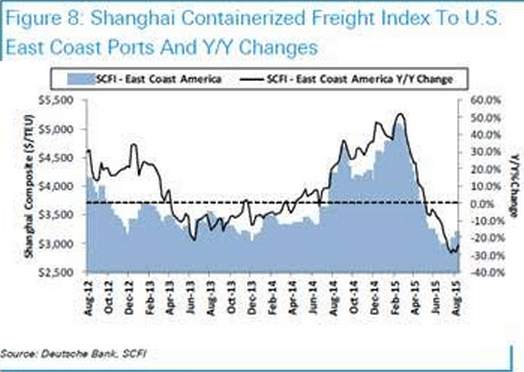
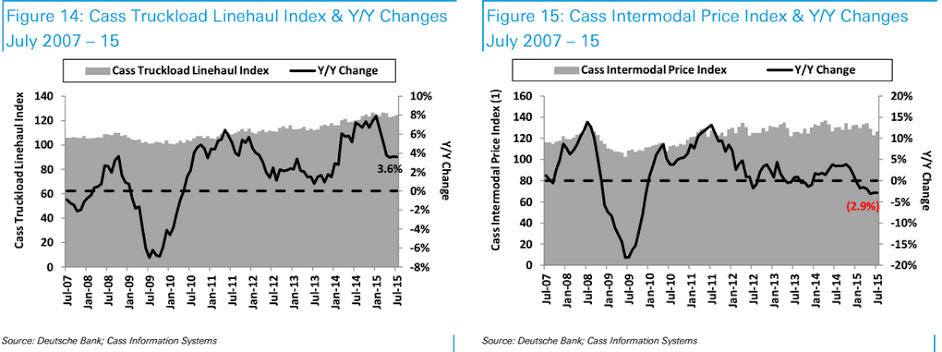
DB Charts:

er-8-19-3

er-8-19-4

Exports growing though at a slower rate, imports declining at a faster rate:

Japan : Merchandise Trade
er-8-19-5

Empire manufacturing, housing market index, EU merchandise trade

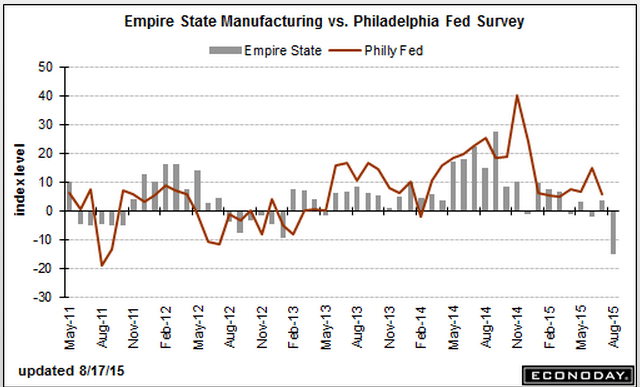
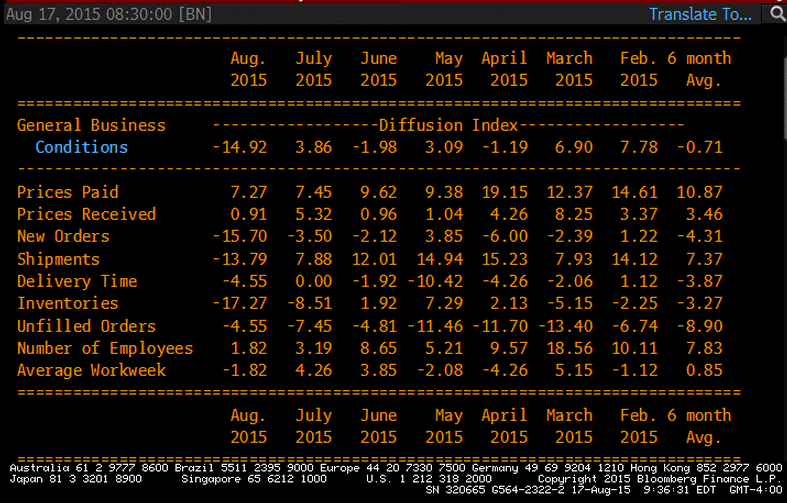
The lack of support from the lost oil capex continues to ripple out:

United States : Empire State Mfg Survey
er-8-17-1
Highlights
Out of the blue, the Empire State index has plunged deeply into negative column this month, to minus 14.92 in August vs plus 3.86 in July. This is by far the weakest reading of the recovery, since April 2009. New orders, which had already been weak in this report, fell from July’s minus 3.50 to minus 15.70 for the weakest reading since November 2010. Backlog orders, which had also been weak, came in at minus 4.55 from minus 7.45. Shipments, in the weakest reading since March 2009, fell to minus 13.79 from positive 7.99.

Last week’s industrial production report, boosted by the auto sector, offered hope but today’s report is a reminder that weak exports and weakness in the energy sector are stubborn negatives for the factory sector. Today’s results scramble the outlook for Thursday’s Philly Fed report which was expected to show moderate strength.
er-8-17-2
er-8-17-3

Home builders remain optimistic:

United States : Housing Market Index
er-8-17-4
Highlights
The new home sector is increasingly a central source of strength for the economy and builders are increasingly optimistic. The housing market index rose 1 point to a very strong 61 in August with the future sales component leading the way at 70. Current sales are at 66 with traffic continuing to lag but less so, at 45 for a 2 point gain in the month. By region, the South and West show the greatest composite strength at 63 each followed by the Midwest at 58 and the Northeast, which is the smallest region for new homes, still showing contraction at a sub-50 reading of 46.

Strength in the labor market is the driving force behind strength for new homes where lack of supply continues to motivate builders. Today’s report points to another strong housing starts report for tomorrow.

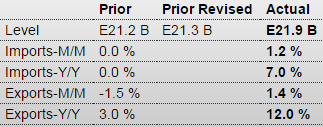
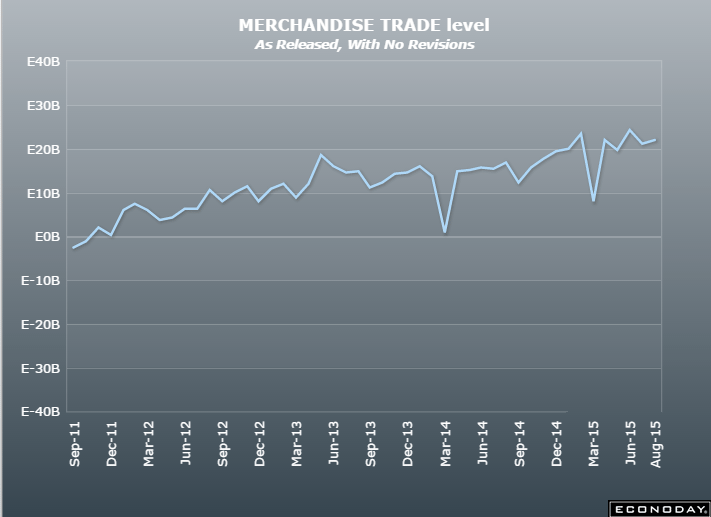
Never yet seen a positive trade balance and a weak currency, without an inflation problem. The euro is down only because of portfolio shifting, particularly CB’s, which may have run its course, and the general outlook remains deflationary. While this includes the (minority) non euro members, the trend is the same for just the ‘euro area’ which is also reported separately:

European Union : Merchandise Trade
er-8-17-5
Highlights
The seasonally adjusted trade balance was E21.9 billion, up from a revised E21.3 billion in May. Exports of goods to the rest of the world were €182.7 billion, an increase of 12 percent from a year ago. Imports from the rest of the world were E156.4 billion, 7 percent higher from a year ago. Intra-euro area trade rose to E151.2 billion in June 2015, up 10 percent compared with June 2014.

For the six months to June 2015, euro area exports of goods to the rest of the world rose 6 percent compared with January to June 2014), while imports were up 3 percent compared with the year earlier period.

Apart from the weakness of the oil market, the current soft level of the euro should help to ensure continued strong trade data over the rest of 2015.
er-8-17-6

China, Germany, Productivity, NFIB Index, Redbook, Wholesale Trade


A few thoughts:

China’s US Tsy holding had been falling perhaps because they were selling $ to buy Yuan to keep it within in the prior band.

Pretty much all exporting nation’s currencies have already weakened vs the $, including the Yen and Euro, so this is a bit of a ‘catch up.’

In a weakening global economy from a lack of demand (sales) and ‘western educated, monetarist, export led growth’ kids now in charge globally, the path of least resistance is a global race to the bottom to be ‘competitive’. And the alternative to currency depreciation, domestic wage cuts, tends to be less politically attractive, as the EU continues to demonstrate.

The tool for currency depreciation is intervention in the FX markets, as China just did, after they tried ‘monetary easing’ which failed, of course. Japan did it via giving the nod to their pension funds and insurance companies to buy unswapped FX denominated securities, after they tried ‘monetary easing’ as well.

The Euro zone did it by frightening China and other CB’s and global and domestic portfolio managers into selling their Euro reserves, by playing on their inflationary fears of ‘monetary easing’-negative rates and QE- they learned in school.

The US used only ‘monetary easing’ and not any form of direct intervention, and so the $ remains strong vs all the rest.

I expect the Euro to now move ever higher until its trade surplus goes away, as global fears of an inflationary currency collapse are reversed and Euro buying resumes as part of global export strategies to export to the Euro zone. And, like the US, the EU won’t use direct intervention, just more ‘monetary easing’.

Ironically, ‘monetary easing’ is in fact ‘fiscal tightening’ as, with govts net payers of interest, it works to remove interest income from the global economy. So the more they do the worse it gets.

‘No matter how much I cut off it’s still too short’ said the hairdresser to the client…

The devaluations shift income from workers who see their purchasing power go down, to exporters who see their margins increase.
To the extent exporters then reduce prices and those price reductions increase their volume of exports, output increases, as does domestic employment. But if wages then go up, the ‘competitiveness’ gained by the devaluation is lost, etc., so that’s not meant to happen.

Also, the additional export volumes are likewise reductions in exports of other nations, who, having been educated at the same elite schools, respond with devaluations of their own, etc. etc. in a global ‘race to the bottom’ for real wages. Hence China letting their currency depreciate rather than spend their $ reserves supporting it.

The elite schools they all went to contrive models that show you can leave national deficit spending at 0, and use ‘monetary policy’ to drive investment and net exports that ‘offset’ domestic savings. It doesn’t work, of course, but they all believe it and keep at it even as it all falls apart around them.

But as long as the US and EU don’t have use of the tools for currency depreciation, the rest of the world can increase it’s exports to these regions via currency depreciation to lower their $ and Euro export prices, all of which is a contractionary/deflationary bias for the US and EU.

Of further irony is that the ‘right’ policy response for the US and EU would be a fiscal adjustment -tax cut or spending increase- large enough to sustain high enough levels of domestic spending for full employment. Unfortunately, that’s not what they learned in school…

The drop in expectations is ominous, particularly as the euro firms:

Germany : ZEW Survey
er-8-11-1

Highlights
ZEW’s August survey was mixed with a slightly more optimistic assessment of the current state of the economy contrasting with a fifth consecutive decline in expectations.

The current conditions gauge was up 1.8 points at 65.7, a 3-month high. However, expectations dipped a further 4.7 points to 25.0, their lowest mark since November 2014.


The drop in unit labor costs and downward revision of the prior increase gives the Fed cause to hold off on rate hike aspirations:

United States : Productivity and Costs
er-8-11-2

Highlights
A bounce back for output gave first-quarter productivity a lift, up a quarter-to-quarter 1.3 percent vs a revised decline of 1.1 percent in the first quarter. The bounce in output also held down unit labor costs which rose 0.5 percent vs 2.3 percent in the first quarter.

Output in the second quarter rose 2.8 percent vs a depressed 0.5 percent in the first quarter. Compensation rose 1.8 percent, up from 1.1 percent in the first quarter, while hours worked were little changed, up 1.5 percent vs 1.6 in the first quarter.

Looking at year-on-year rates, growth in productivity is very slight at only plus 0.3 percent while costs do show some pressure, up 2.1 percent in a reading, along with the rise in compensation, that will be welcome by Federal Reserve officials who are hoping that gains in wages will help offset weakness in commodity costs and help give inflation a needed boost.


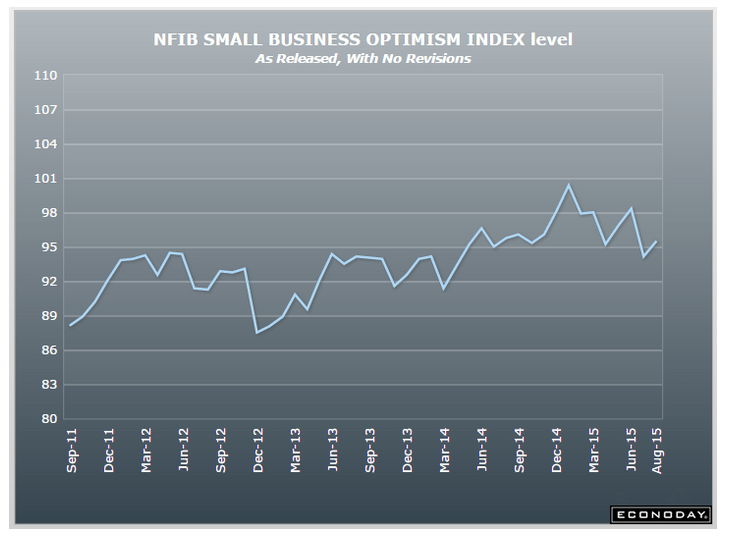
Up a touch but the trend remains negative:
er-8-11-3


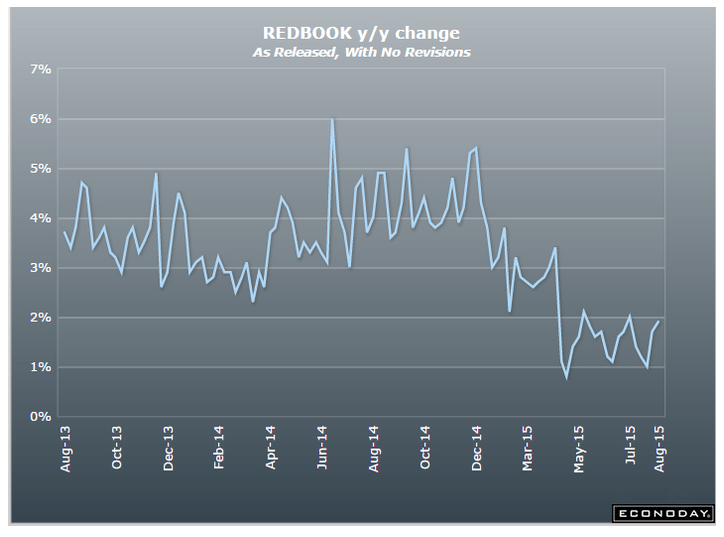
Redbook retail sales report still bumping along the bottom:
er-8-11-4


A decline in sales growth and rise in inventories is yet another negative:

United States : Wholesale Trade
er-8-11-5

Highlights
A build in auto inventories as well as for machinery drove wholesale inventories up a much higher-than-expected 0.9 percent in June. Sales at the wholesale level rose only 0.1 percent in the month, in turn driving the stock-to-sales ratio up 1 notch to a less-than-lean 1.30. This ratio was at 1.19 in June last year.
Greece loses the gambit

It now looks to me like Greece has lost the wrestling match.
gw

The other EU members are very sensitive to market reactions.

The question was whether the EU economy needed Greece, and the answer is now looking more and more like ‘no’.

Not a good position for Greece to find itself after posturing as if it is needed.

That is, Greece forced a test of that question and appears to have the leverage the possibility that they were needed gave them.

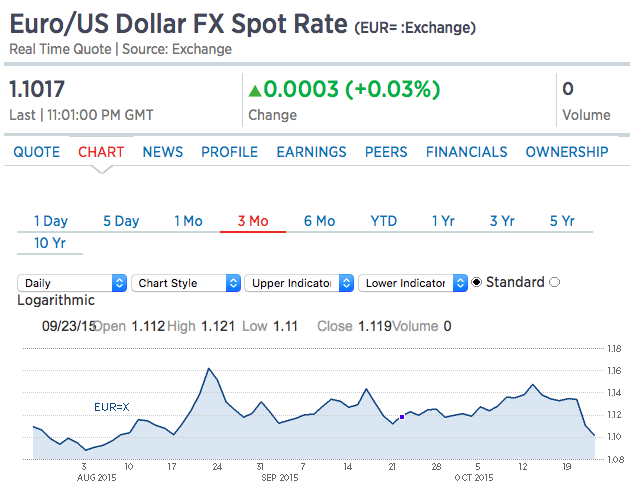
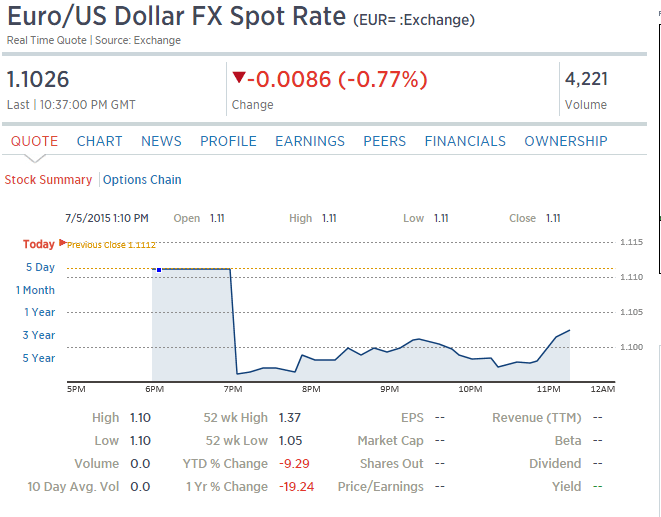
The euro did fall, which was extremely worrisome even though it did help exports. There is always the fear, particularly in Germany, of a currency collapse that brings inflation with it. At least so far, that hasn’t happened, with the euro holding about 5% above the lows and recovering from the initial knee jerk reaction from today’s referendum.
eur-usd-2
Real GDP forecasts remain positive, helped quite bit by the lower euro, and while high, unemployment has stabilized.

The camp claiming that Greece has been dragging down the entire EU economy is getting more support from the same data.

And so now while Greece isn’t being formally ousted, it will see it’s economy continue to deteriorate if it doesn’t agree to troika terms and return to ‘normal funding’ via securities sales at low rates under the ECB’s ‘do what it takes’ umbrella, and rejoin the rest of the members.

If the govt starts paying in IOU’s payments get made for a while, however they will be discounted ever more heavily with time, raising the cost of re entry to ‘normal’ funding, and the EU counts those as additions to deficit spending which could cause the terms of re entry to be that much steeper.

And any movement by Greece to use alternative funding will be taken as reason not to return Greece to ‘normal’ funding under the ECB umbrella.
Comments on Greece

So the euro is down a % or 2 because of the Greek debt drama. Generally currencies go down on debt drama when the debt is in a foreign currency and it’s feared the govt will have to sell local currency to get the fx to make the payments. For example, the peso might go down should there be concern over Mexico paying the IMF in dollars. But with Greece this isn’t the case, as there’s no fear they will sell euro to get euro to make payments. But the players sell euro anyway, because that’s what you do when there is a debt crisis. Then they have to buy them back, with no state selling to help them cover.

What’s been exposed yet again is a world that doesn’t understand its monetary systems, including central bankers who don’t understand banking, as well as the mainstream media and all of the politicians and their finance ministers talking and doing the big stupid at the expense of their electorate, which also doesn’t understand it enough to have any awareness whatsoever of the total lack of expertise at the highest levels.

Meanwhile, at the macro level, deflationary policy continues including negative rates, QE, tight fiscal, structural reforms, and all that goes with it. And debt defaults, should they happen are also deflationary. And all of this deflationary bias is also evidenced by most all market prices.

China cuts rates, Atlanta Fed, car sale comment, Greek PM comments

As the carpenter said about his piece of wood, ‘no matter how much I cut off it’s still too short’:

China’s central bank cut its benchmark lending rates by 25 basis points to 4.85 percent on Saturday, the fourth reduction since November, as it gears up to lower borrowing costs and support a slowing economy.

The People’s Bank of China (PBOC) also reduced one-year benchmark deposit rates by 25 basis points to 2 percent, it said in a statement on its website, adding that the reductions would take effect on Sunday.

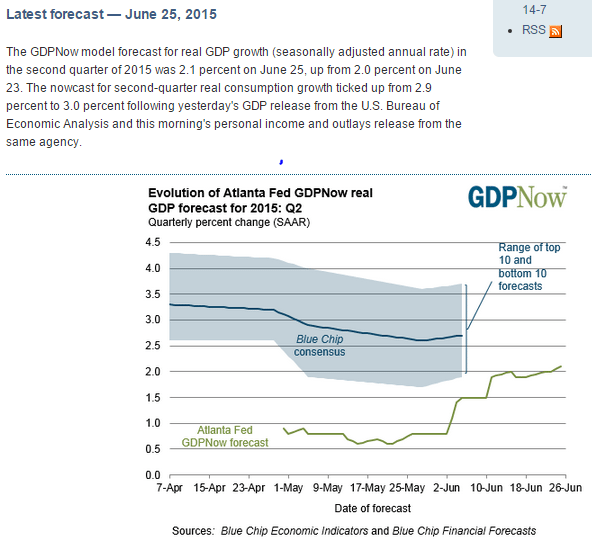
atl-nowcast-6-29
Yes, car sales are up a bit, but seems import content is growing so it’s working against US GDP and employment?

Number of ‘American-made’ autos drops to new low

By Phil LeBeau

So why would the Prime Minister do this?

The Greek banks are ECB members, regulated and supervised by the ECB, with liquidity provided by the ECB. Should liquidity end, the ECB via the Bank of Greece simply stops making payments on that bank’s behalf. And why close the banks and prevent them from performing ongoing bank services that don’t require ECB liquidity, should it not be available as needed? Just more evidence that the Greek leaders aren’t playing with a full deck, so to speak…

Greek PM calls for bank closures, capital controls

By Phillip Tutt

June 29 (CNBC) —Despite a tweet from Greek Finance Minister Yanis Varoufakis that his government “opposed the very concept” of any controls, Greek Prime Minister Alexis Tsipras said later Sunday that he had forced the country’s central bank to recommend a bank holiday and capital controls.

claims, producer prices, euro comments, public sector jobs

Just a reminder, claims measure those losing jobs who file for benefits, not new hires:

Jobless Claims
er-5-14-1
er-5-14-2

The euro has been moving higher vs the dollar, as CB selling winds down as they reach the lower limits of their reserve targets along with fundamental support from a large and growing EU current account surplus that’s drained those euro sold by those CB’s and other sellers from global markets. This may have left the short sellers and others needing to recover euro allocations subject to a dramatic short squeeze for as long as the current account surplus continues. And this poses an extreme risk to the EU. Growth forecasts have been largely based on ‘weak euro’ and as it moves higher that growth never materializes, and instead the economy deteriorates/unemployment goes higher, etc. etc. and, making matters worse, the ECB is left ideologically bankrupt, having seen negative rates and QE do nothing more than exacerbate the deflation they were trying to reverse. All they can do is try more of the same, which will be a very depressing environment for those who have been suffering under the failed policies. All of which has the potential to accelerate the already growing support for the various anti euro forces.
sg2015051440308

Yes, President Obama wins the Tea Party trophy for downsizing government:
er-5-14-3