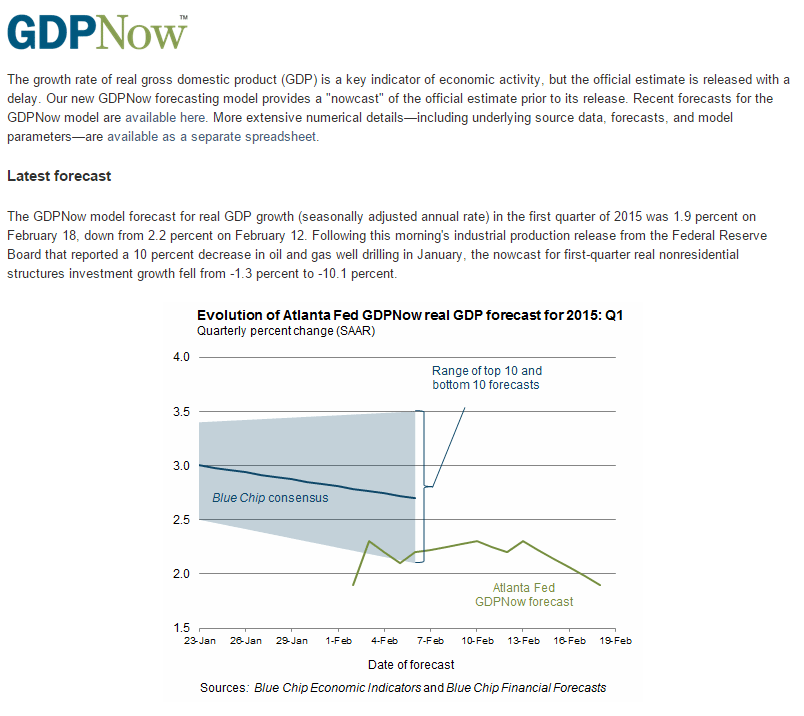
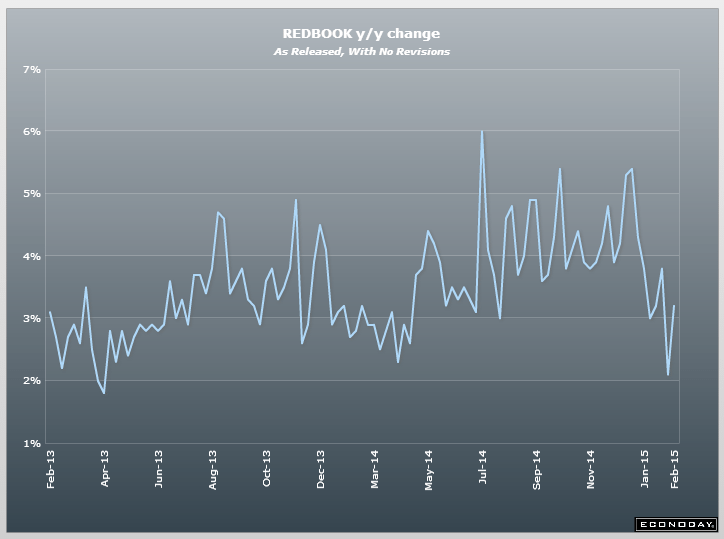
Now below 2% for Q1,
Even with lower oil prices…
;)

More US consumption of imports indicated here as well as with US trade data, as US growth continues to get downgraded post oil price collapse:
Japan’s annual exports jump most since late 2013 in boost to economy
Feb 18 (Reuters) — Japan’s annual exports in January jumped the most since late 2013. The 17.0 percent year-on-year gain in exports marked the fifth straight month of increase, supported by brisk shipments of cars to the United States and of electronics parts to Asia. The export data followed a 12.8 percent rise in December.
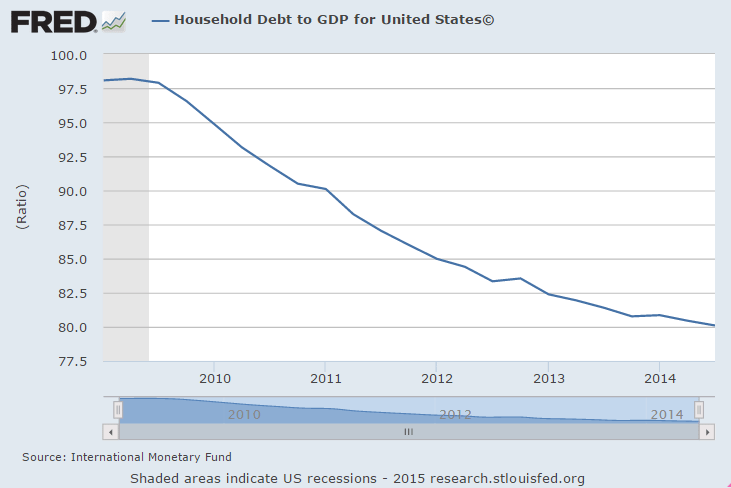
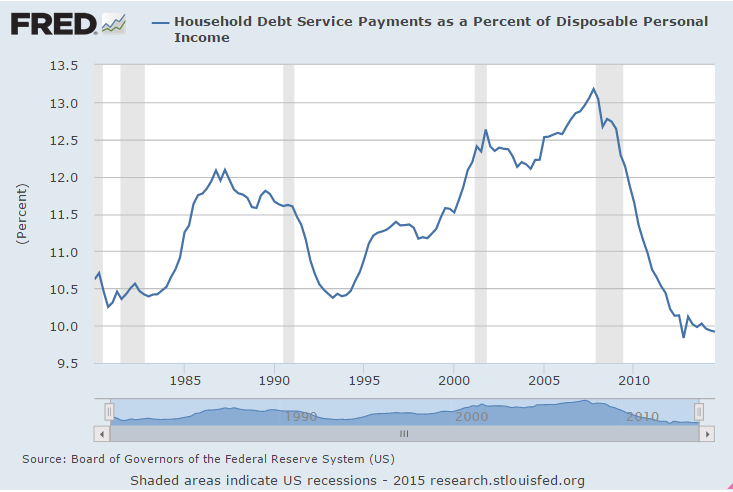
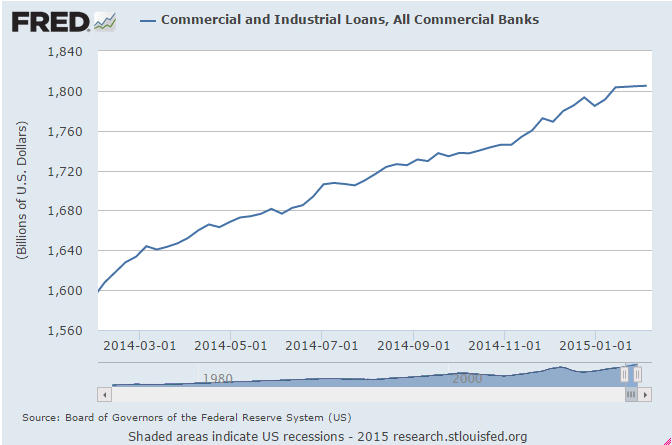
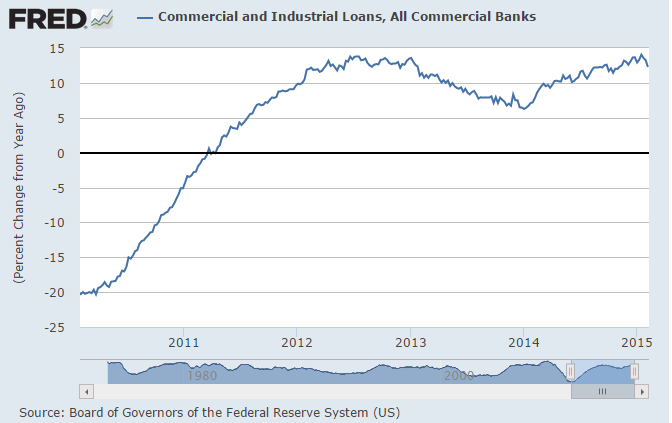
As the US demand leakages (agents spending less than their incomes) grow relentlessly, I look for the deficit spending required to sustain GDP growth. Turns out last year it came from the energy sector which ended abruptly in Q4 2014, with GDP growth sagging accordingly. And so far no sign of a credit expansion from the household sector. You can argue debt is more affordable, but not that it’s happening:
Philly Fed index falls to lowest in a year
As previously discussed, and relayed to the finance minister in Greece, there is no reason to assume the ECB will cut off liquidity to Greek banks.
First, those banks are private institutions, and regulated and supervised by the ECB, who has deemed them ‘solvent’ and ‘adequately capitalized’ and therefore eligible for liquidity support as members in good standing.
Think of it this way, if NY went rogue, would the Fed cut off Citibank?
ECB extends liquity for Greek banks: Report
Seems the last thing the Fed wants to do now is engineer higher mtg rates and set back the anemic housing markets.
Sort of like Bernanke did just before housing turned south and has yet to recover…
Federal Reserve minutes indicate no rush to raise interest rates
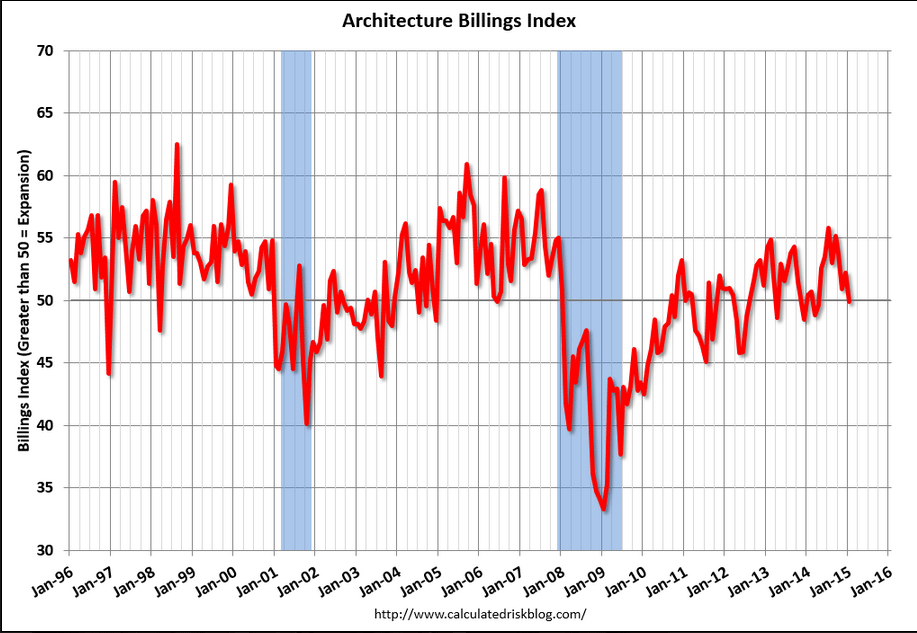
Below 50, not good:
More bad housing news:
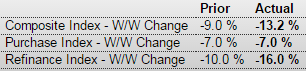
MBA Purchase Applications
Highlights
The purchase index is down for a 5th straight week, 7.0 percent lower for the 2nd consecutive week. Rates have been rising in recent weeks including the latest week which is especially depressing refinancing activity where the index fell a very sharp 16.0 percent following the prior week’s 10 percent fall. The report notes that demand for larger refinancing loans is especially down.
The average mortgage for conforming loans ($417,000 or less) rose 9 basis points in the week to 3.93 percent. The decline in the purchase index is a negative signal for underlying home sales.
More bad housing news:
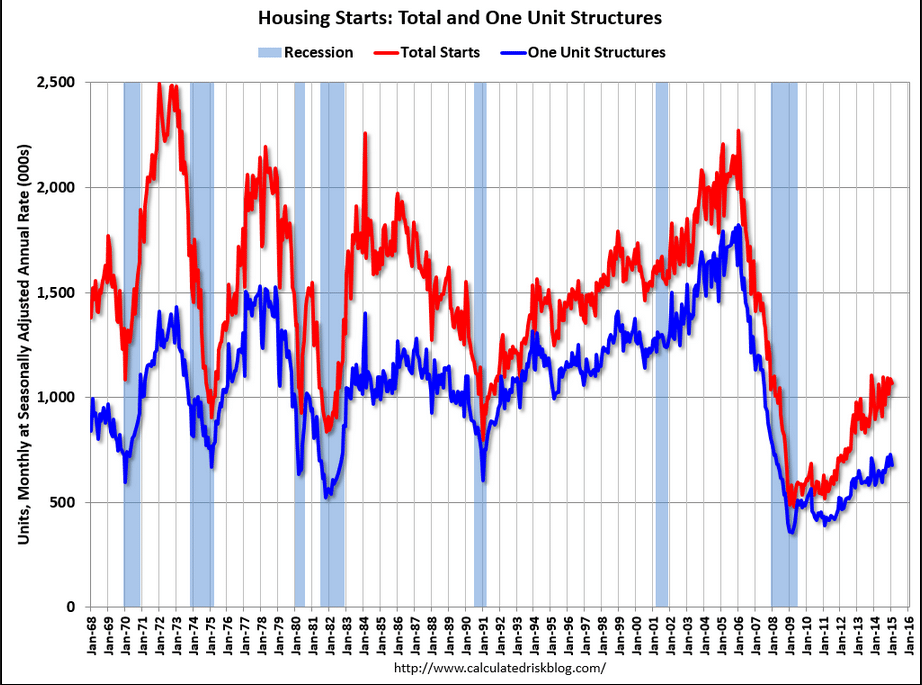
Housing Starts
Highlights
Housing is not adding to economic momentum. Housing starts slipped in January on weakness in single-family starts. Housing starts declined 2.0 percent in January after a 7.1 percent jump the month before. The 1.065 million unit pace was up 18.7 percent on a year-ago basis. Expectations were for a 1.070 million pace for January.
Single-family permits dropped 6.7 percent after a 7.9 percent boost in December. Multifamily starts gained 7.5 percent, following a 5.6 percent rise in December.
Again, permits suggest that housing activity is muted. Housing permits dipped 0.7 percent, following no change in December. The 1.053 million unit pace was up 8.1 percent on a year-ago basis. The market consensus was for a 1.070 million unit pace.
The bottom line is that housing is not adding to economic activity. This means the Fed likely will continue to reinvest mortgage-backed securities to keep rates low. But the long-term trend appears to be that single-family housing is not viewed as strong an investment as in the past.
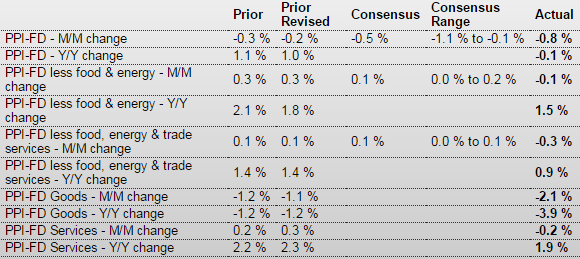
PPI-FD
Highlights
The PPI for total final demand decreased 0.8 percent after falling 0.2 percent in December. The consensus forecast a 0.5 percent drop. A sharp drop in energy pulled the headline number down. Excluding food and energy, producer price inflation slipped 0.1 percent after firming 0.3 percent the month before. Expectations were for a 0.1 percent rise.
The index for final demand goods fell 2.1 percent after dropping 1.1 percent in December. The January decrease was led by prices for final demand energy, which fell a monthly 10.3 percent. The decline in prices for final demand goods was led by the index for gasoline, which dropped 24.0 percent. Prices for diesel fuel, jet fuel, basic organic chemicals, dairy products, and home heating oil also moved lower. Conversely, the index for residential electric power moved up 1.2 percent. Prices for pharmaceutical preparations and for fresh and dry vegetables also advanced. Prices for final demand foods decreased 1.1 percent after slipping 0.1 percent in December.
The index for final demand services eased 0.2 percent after advancing 0.3 percent in December. In January, prices for final demand services less trade declined 0.3 percent after rising 0.1 percent the month before. This was the first decline since falling 0.3 percent in September 2014. In January, a major contributor to the decline in the index for final demand services was prices for outpatient care (partial), which fell 0.7 percent.
On a seasonally adjusted year-ago basis, PPI final demand was down 0.1 percent, compared to up 1.0 percent in December. Excluding food & energy, PPI final demand was up 1.5 percent versus 1.8 percent the month before.
Overall, inflation at the manufacturers’ level is muted even after discounting energy declines. The Fed is likely to see the numbers as allowing delayed rate increases.
And yet another disappointing report:
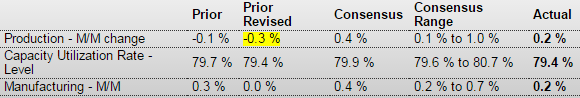
Industrial Production
Highlights
The industrial sector turned modestly positive in January-including for the manufacturing component. Industrial production for January rebounded 0.2 percent after a December decrease of 0.3 percent. Market expectations were for a 0.4 percent boost for January.
Manufacturing rose 0.2 percent in January after no change the month before. But the negative is that December manufacturing was revised down from a 0.3 percent gain. The manufacturing increase fell short of the 0.4 percent market forecast.
Manufacturing output rose 0.2 percent in January, as the production of durable goods advanced 0.4 percent and the production of nondurable goods was unchanged. Gains were posted by all major durable goods industries except motor vehicles and parts, aerospace and miscellaneous transportation equipment, and furniture and related products. Increases of more than 1.0 percent were recorded in the production of primary metals and of computer and electronic products. Among the major nondurable goods industries, gains in the indexes for apparel and leather, for chemicals, and for plastics and rubber products offset losses elsewhere. The production of other manufacturing industries (publishing and logging) moved down 0.4 percent.
Mining dropped 1.0 percent in January after a 2.1 percent jump the prior month. Utilities made a partial rebound of 2.3 percent after plunging 6.9 percent in December.
Overall capacity utilization was unchanged at 79.4 percent.
The biggest news from this report was the downward revision to December. Manufacturing is still sluggish although on a barely positive uptrend.
All these surveys are now declining:
From the NY Fed: Empire State Manufacturing Survey
The February 2015 Empire State Manufacturing Survey indicates that business activity continued to expand at a modest pace for New York manufacturers. The headline general business conditions index edged down two points to 7.8. The new orders index fell five points to 1.2—evidence that orders were flat—while the shipments index climbed to 14.1. Employment indexes pointed to an increase in employment levels and little change in the average workweek.
Indexes assessing the six-month outlook, though generally positive, conveyed considerably less optimism about future business activity than in recent months. The index for future general business conditions plunged twenty-three points to 25.6, its lowest level in more than two years.
emphasis added
Maybe it’s because lower oil prices merely shift income from sellers of oil to buyers of oil? Leaving falling capital expenditures as the net effect? Along with the negative effect of falling net worth as the value of energy holdings declines?
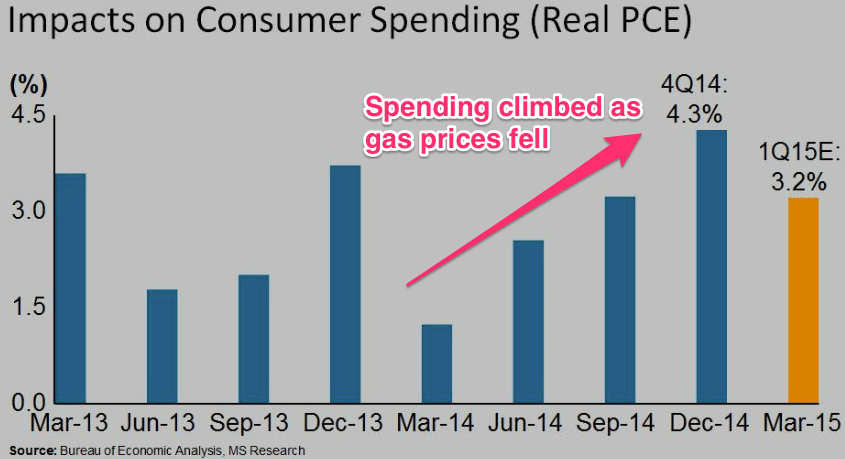
MORGAN STANLEY: US consumers just aren’t spending their gas savings like we thought they would
By Akin Oyedele
Feb 16 (BI) — US consumers are getting more cautious about how they spend their savings from low gas prices.
Gas prices have fallen 40% since September, giving consumers a ‘tax break’ of more than $60 billion, according to Morgan Stanley chief US economist Ellen Zentner.
As gas prices fell, the pace of real Personal Consumption Expenditures (PCE) growth accelerated above the 2% average of the last four years, Zentner said in a video Friday. It reached 4.3% for the fourth quarter of 2014.
Yet, that was less than what it could have been.
“What we found is some lingering caution, that sales could actually be stronger,” Zentner said. “So some of the discretionary categories have shown some weakening of late. Households simply aren’t spending as much out of the gas savings as we thought they would.”
“That lingering caution we think continues in the first quarter,” she added, showing that real PCE growth is estimated to fall to 3.2% for the first quarter. The benefit of the slowdown in spending is that people are using the extra money to pay off debt, or are stashing it away as savings, Zentner said. This ultimately improves households’ finances.
Housing Market Index
Recent History Of This Indicator
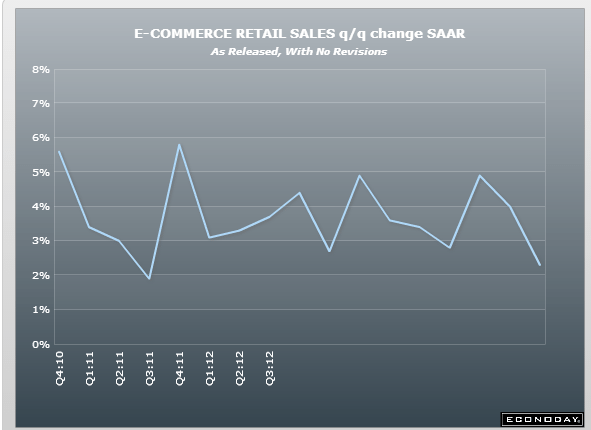
The NAHB housing market index continued to report solid conditions with the housing market index at 57 in January versus an upwardly revised 58 in December. January was the 7th plus-50 score in a row. January’s strength was led by the most heavily weighted component, present sales, which held steady at 62. But the second most heavily weighted component, traffic, remained weak, down 2 points to 44 and reflecting a significant lack of first-time buyers in the new home market. The final component, future sales, did fall 4 points but remained very solid at 60.E-Commerce Retail Sales
Greece must threaten Grexit to get best outcome from Troika
Edward talks to Warren Mosler, chairman of Consulier Engineering on why the EU’s approach to the Greek debt crisis has failed to lift the Greek …
So for decades the BOJ has tried to create inflation and failed, for 7 years the Fed has tried and failed, the ECB has tried and failed, etc. etc. etc. Maybe it’s not so easy for a CB to create inflation? Or impossible…;)
UK inflation hits lowest level since records began
Abe hopes BOJ keeps stimulus to meet inflation goal, upbeat on economy
Feb 16 (Reuters) — Abe hopes BOJ keeps stimulus to meet inflation goal, upbeat on economy (Reuters) Japanese Prime Minister Shinzo Abe said on Monday praised the BOJ’s aggressive stimulus program for helping revive the economy and wipe out the public’s “sticky deflationary mindset.” “I hope the BOJ continues to steadily proceed with bold monetary easing to achieve 2 percent inflation,”
No consideration that the lower prices in the first instance only shift income from sellers of oil to buyers of oil:
Even excluding gas, retail spending was flat last month after ticking down 0.2% in December. The retail restraint is somewhat surprising given that the average household is expected to save hundreds of dollars this year on gas that averaged $2.23 a gallonon Thursday, down from $3.32 a year ago, according to the AAA.
Greece demands a credible growth package:
“No more loans — not until we have a credible plan for growing the economy in order to repay those loans, help the middle class get back on its feet and address the hideous humanitarian crisis.” YV
Italy : Merchandise Trade
Highlights
The seasonally adjusted trade balance returned a sizeable E5.1 billion surplus in December following a slightly larger revised E3.8 billion excess in November.December’s sharp improvement was mainly attributable to a 2.6 percent monthly bounce in exports, their fourth increase in the last five months, which easily more than reversed a 1.1 percent mid-quarter drop. Outside of durable consumer goods all of the major sectors saw solid monthly gains and total exports were up 6.3 percent from their level in December 2013.
However, weak domestic demand and lower oil costs were also once again a factor in the expansion of the black ink. Hence, imports were down 1.6 percent versus December (minus 0.5 percent ex-energy), their third straight month of decline. Compared with a year ago, purchases from overseas were off 1.3 percent.
Having hit a low of E-4.1 billion in March 2011 the turnaround in the Italian trade balance has been sharp and quite steady. Net exports probably provided a useful boost to economic growth last quarter and look likely to play a key role in any sustained upswing in 2015.
This is seriously strong euro stuff:
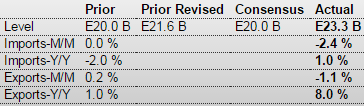
European Union : Merchandise Trade
Highlights
The seasonally adjusted trade balance was in a record E23.3 billion surplus in December, up from a stronger revised E21.6 billion print in November. Unadjusted the black ink stood at E24.3 billion, nearly double the comparable outturn a year ago. The results were on the high side of expectations.
However, the improvement in the headline masked weakness in both sides of the balance sheet. Hence, exports fell 1.1 percent on the month while imports were off a sharper 2.4 percent, their third straight decline. Versus December 2013 exports grew 8.0 percent but weak domestic demand again restricted imports to a modest 1.0 percent advance.
Still, the December report made for an average fourth quarter surplus of E21.7 billion, a significant expansion from the previous period’s E15.7 billion. Although lower oil costs will have been an important factor here the signs are that net export volumes made a positive contribution to Eurozone real GDP growth last quarter. For 2014 as a whole the black ink weighed in at E194.8 billion after a E152.3 billion excess in 2013. Euro weakness should ensure that exports provide a still larger boost over 2015.
When taxes went up and the sequesters hit, seems it was the oil and gas credit expansion that (under the radar) grew sufficiently to support GDP growth and employment. And so now, as credit expansion for the energy sector fades, something else has to step up to the plate to sustain GDP growth.
If you see it let me know!
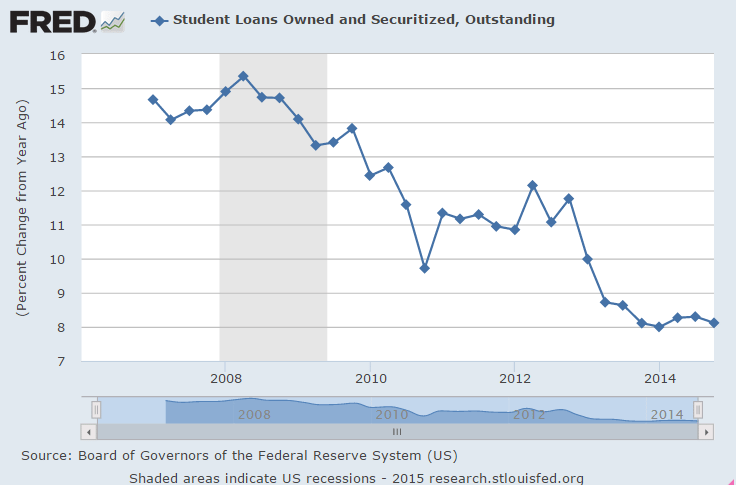
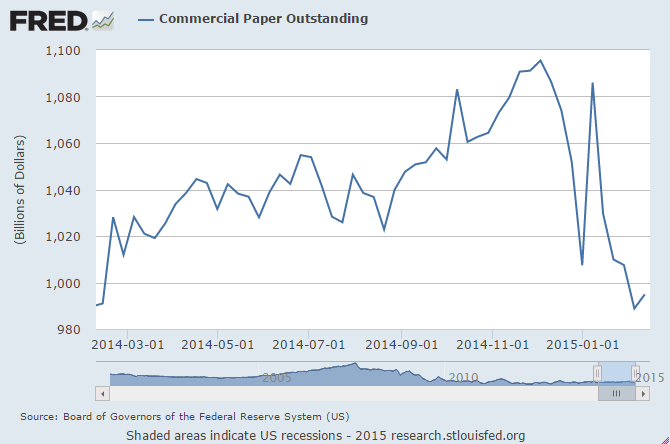
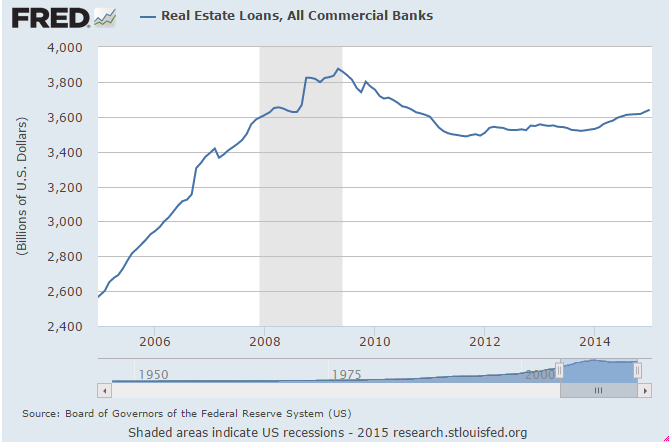
Still down over $90 billion from the recent high:
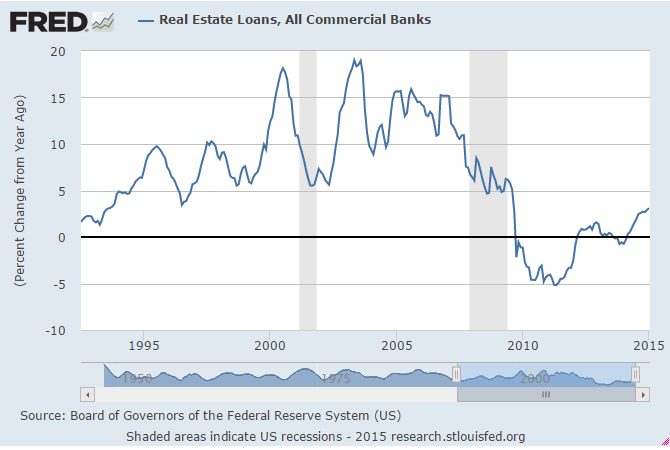
Flattened a bit:
Growth rate rolled over?
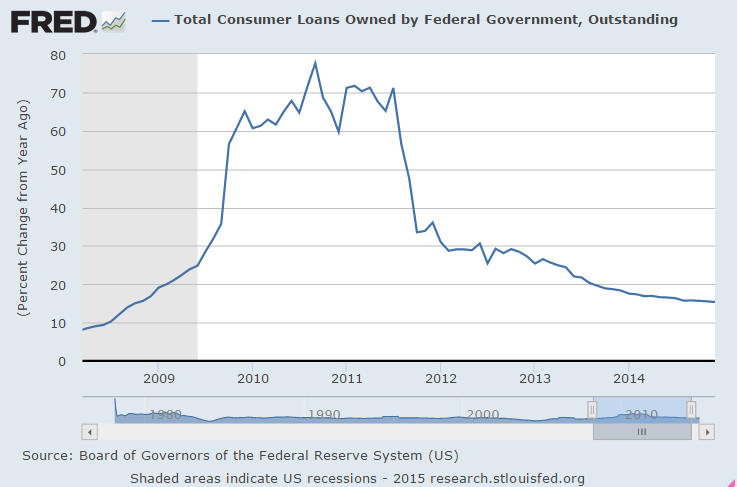
Boring:
Whoops
This isn’t supposed to happen with the lower gas prices:
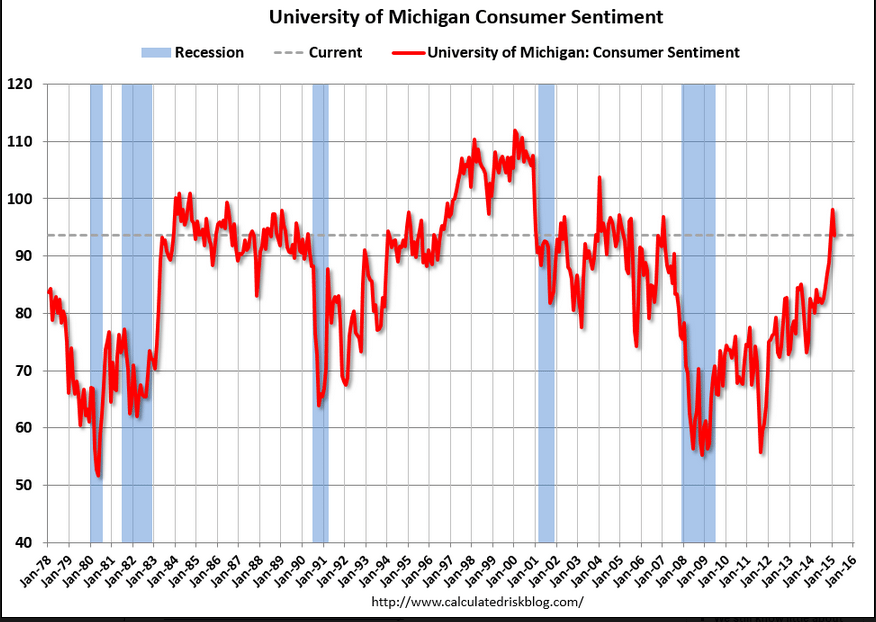
Consumer Sentiment
Highlights
Consumer sentiment remains very strong but it did move down after spiking in January, to 93.6 for the mid-month February reading vs January’s 98.1 which was the best reading in 11 years. The 93.6 reading is still very solid, matching December’s reading as the second best of the last 8 years.
The fall back for the index is divided about equally between the two components, current conditions at 103.1 vs 109.3 and expectations at 87.5 vs 91.0. The dip for current conditions points to possible slowing in consumer activity this month, while the dip in expectations points to a little less optimism in the outlooks for jobs and income.
Bloomberg Consumer Comfort Index
Highlights
According to Bloomberg, consumer confidence declined for a second straight week, interrupting a four-month surge as Americans’ perceptions of their finances and the economy waned.
Business Inventories
Highlights
A mismatch between inventories and sales is appearing in what could be a negative for production and employment. Business inventories rose only 0.1 percent in December but business sales fell a very sharp 0.9 percent for a 3rd straight decline. The inventory-to-sales ratio jumped 2 notches to 1.33 which is the heaviest reading since July 2009.
All 3 components show builds relative to sales especially retailers where inventories of apparel and building materials look heavy. Inventories of autos also look heavy — especially given this morning’s contraction in the auto component of the January retail sales report.