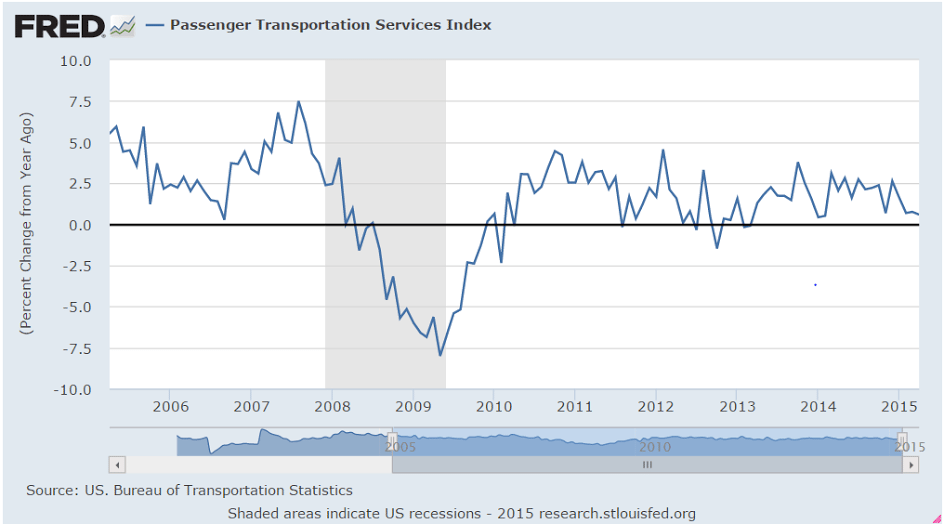
NY manufacturing, Industrial Production, Housing index, Bundesbank comment

Nothing good here:

Empire State Mfg Survey
er-6-15-1
Highlights
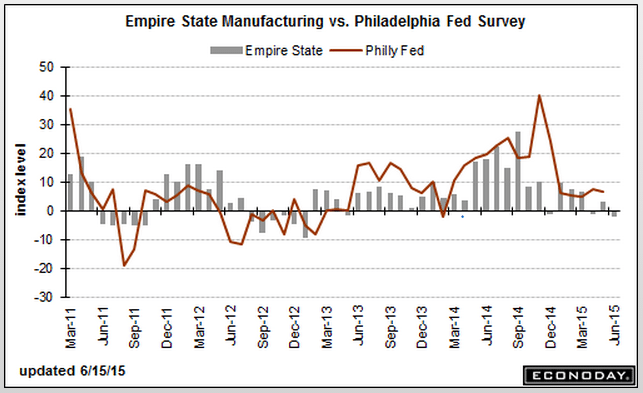
There’s no bounce at all in the Empire State manufacturing survey where the headline index sank to minus 1.98 in June, well below Econoday’s low-end forecast for 4.00 and the second negative reading in three months that pulls its second quarter average into the negative column at minus 0.03. This report was actually doing much better during the heavy weather and special factors of the first quarter when it averaged 8.21.

And new orders point to greater weakness ahead, at minus 2.12 in June for the third negative reading in four months. Shipments have been strong in this report, at 12.01 in June, but won’t stay strong very long given the weakness in orders. The six-month outlook reflects this concern, down nearly 4 points to 25.84 which is the lowest for this reading since February and the second lowest in 2-1/2 years.

Unfilled orders are always weak in this report, at minus 4.81 in today’s report which is actually the least negative reading since October last year. And employment does remain in the plus column at 8.65, up from 5.21 in May but well down from their recent peak in March at 18.56. Price readings show little change with output prices showing fractional upward pressure at 0.96 and input prices showing steady and mild pressure at 9.62 vs 9.38 in May which was the lowest reading in nearly 3 years.

The manufacturing sector is supposed to be building up steam, not losing steam. There are no special factors in the second quarter that can be blamed for the loss of momentum. Later this morning the industrial production report will offer definitive indications on national shipments during May. On Thursday, the Philly Fed, which has also been weak, will offer a second early look at conditions in June.
er-6-15-2

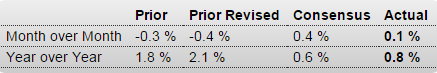
And another bit of bad news here:

Industrial Production
er-6-15-3
Highlights
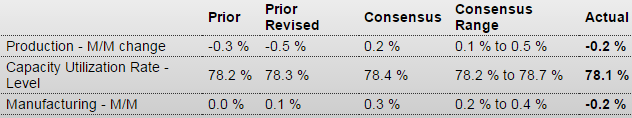
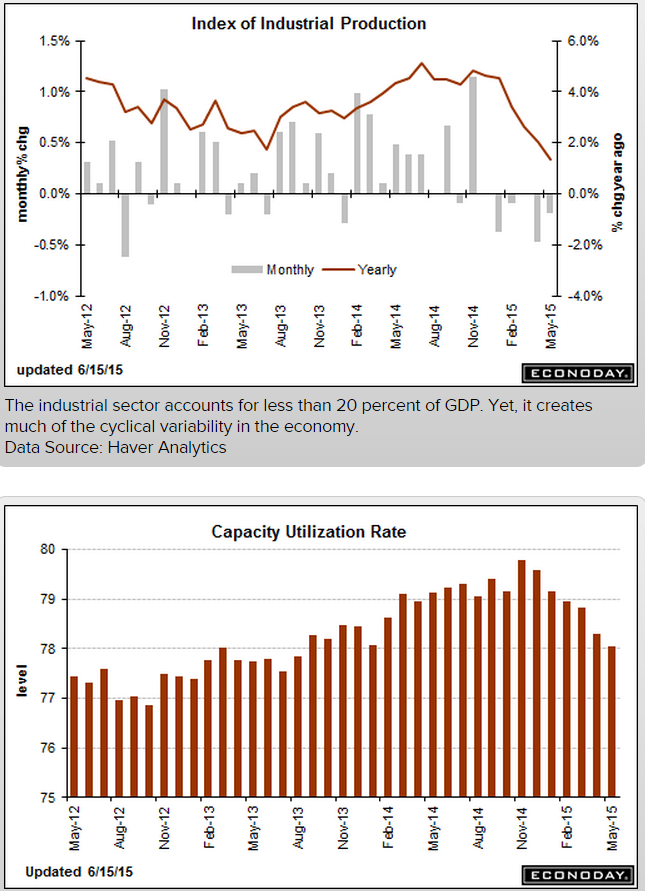
The hawks may have some good arguments at this week’s FOMC meeting but they won’t have anything convincing to say on the manufacturing sector which, instead of rebounding from a weak first quarter, appears to be slowing further. All the main numbers in today’s industrial production report are below low-end forecasts with the headline at minus 0.2 in May and April revised 2 tenths lower to minus 0.5. May is the fourth negative reading in the last six months with the other readings at no change. Capacity utilization fell 2 tenths to 78.1 percent which is the lowest rate since January 2014.

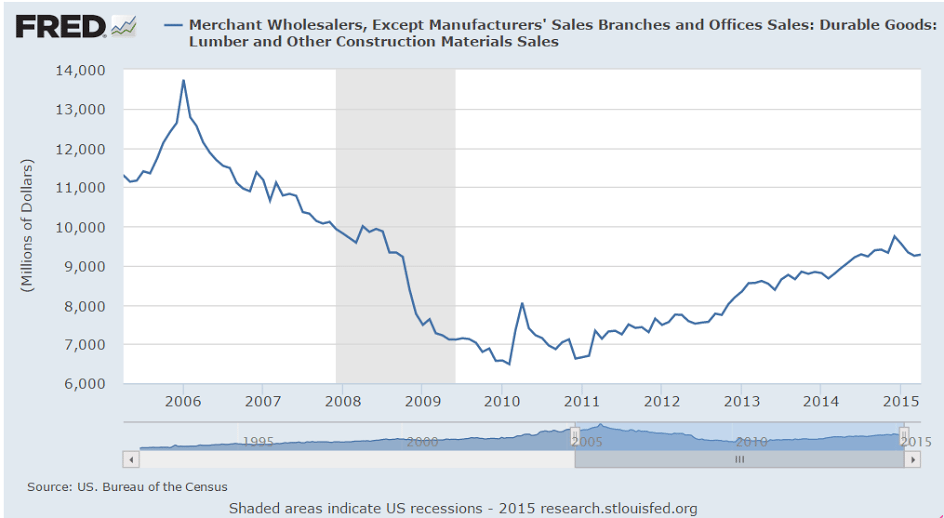
The manufacturing component fell 0.2 percent in May for the third negative reading in five months. Weakness in May was concentrated in consumer goods and construction supplies, the latter a disappointing indication for the housing sector. The mining component, at minus 0.3 percent, has really been hit hard by weakness in the energy sector but, in a plus, contraction here seems to be easing. The utilities component is positive but just barely at plus 0.2 percent.

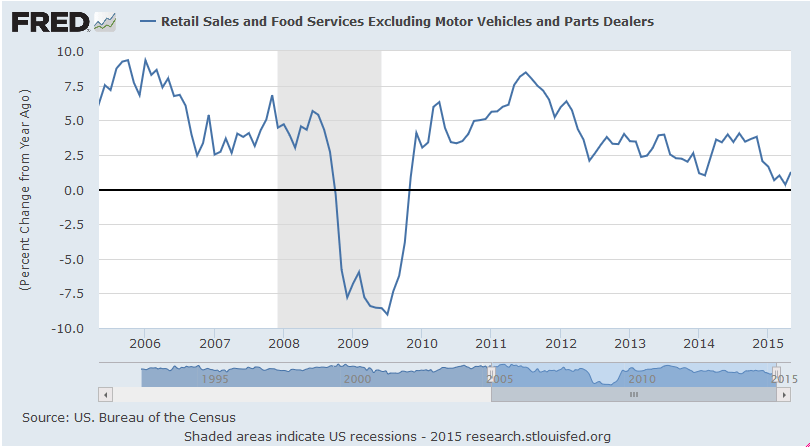
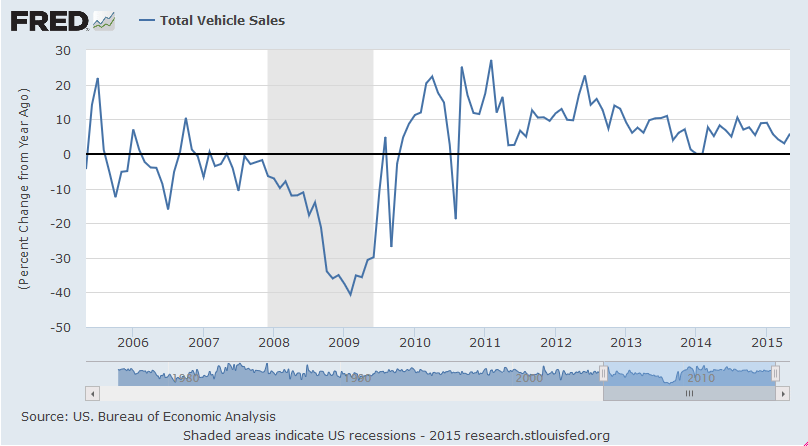
Turning back to manufacturing, vehicles are actually a very big positive with a third outsized gain in a row, at plus 1.7 percent in May vs 2.0 percent and 4.0 percent in the two prior months. This reflects very strong consumer demand for cars and trucks underscoring unit vehicle sales which, in previously released data, are the strongest in 10 years. Excluding vehicles, however, the decline in May manufacturing slips another tenth to minus 0.3 percent. Another area of strength is capital goods which is showing life in the durable goods report and which here, tracked in the business equipment subcomponent, shows a 0.2 percent gain for May.

Otherwise, however, this report is surprisingly weak and echoes this morning’s equally surprisingly weak Empire State report for June. Though there are no separate readings on exports in either of this morning’s reports, weakness here appears to be pulling down the manufacturing sector.
er-6-15-4
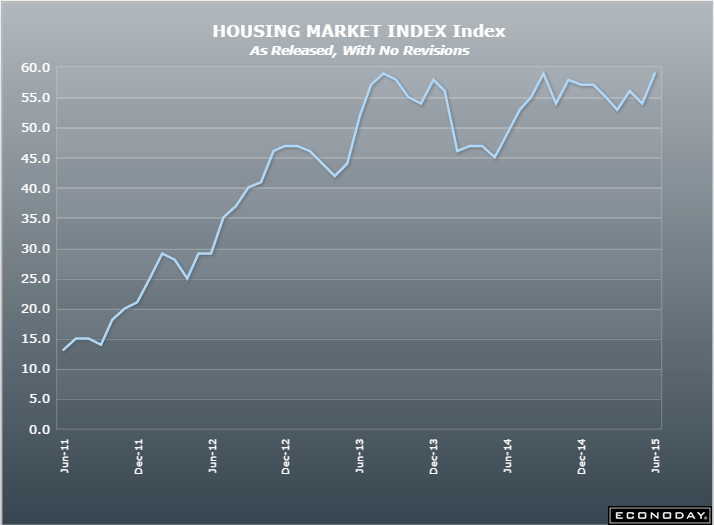
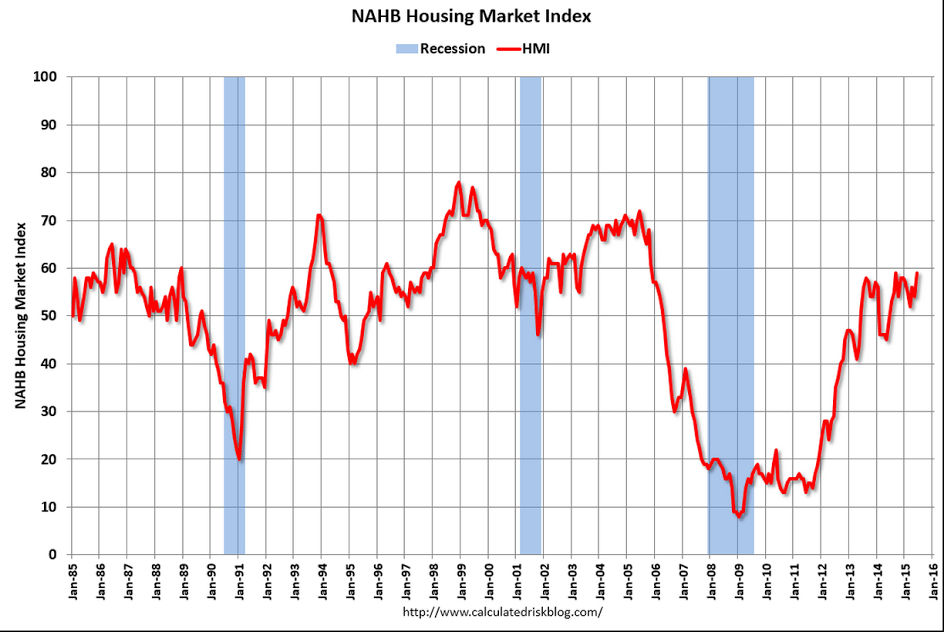
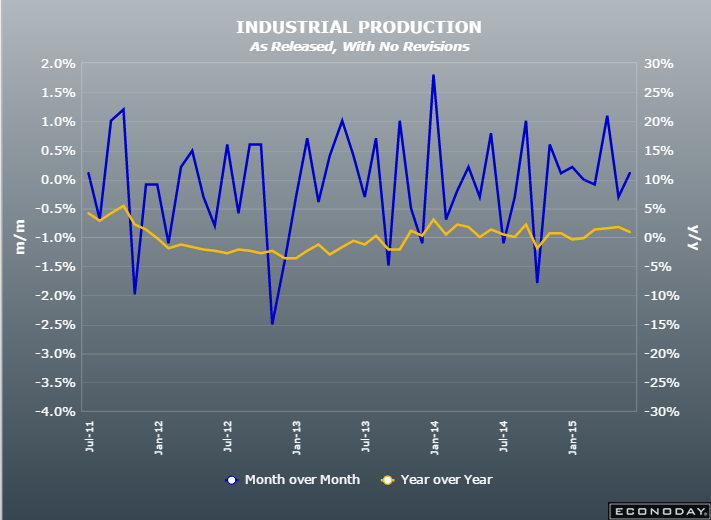
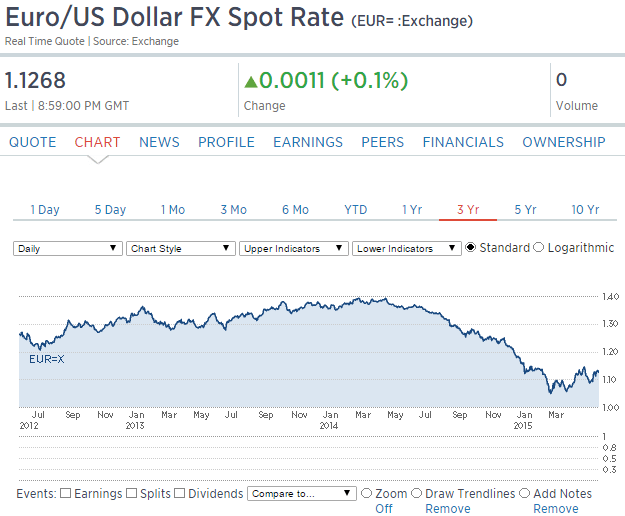
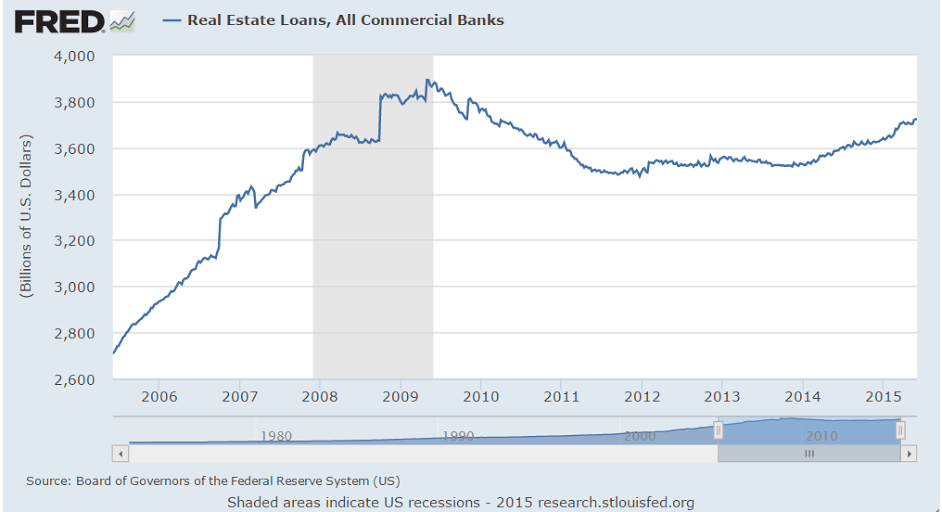
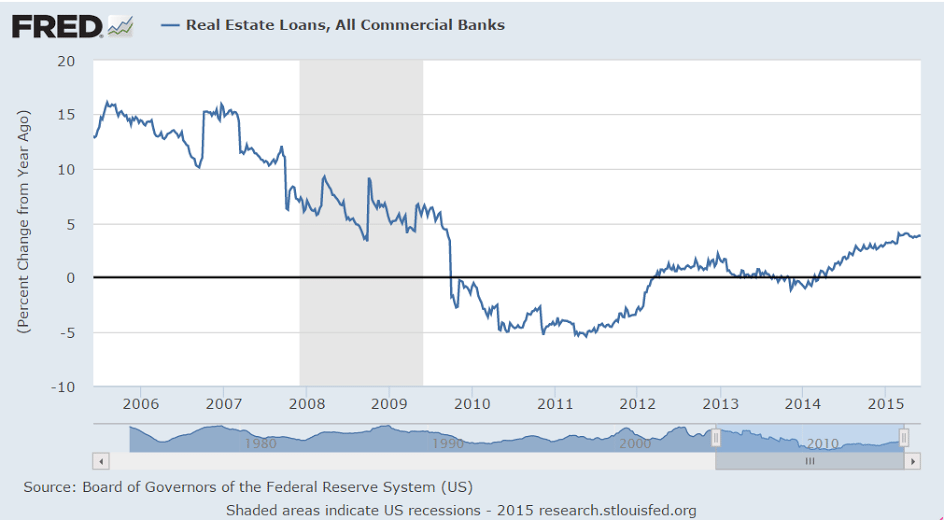
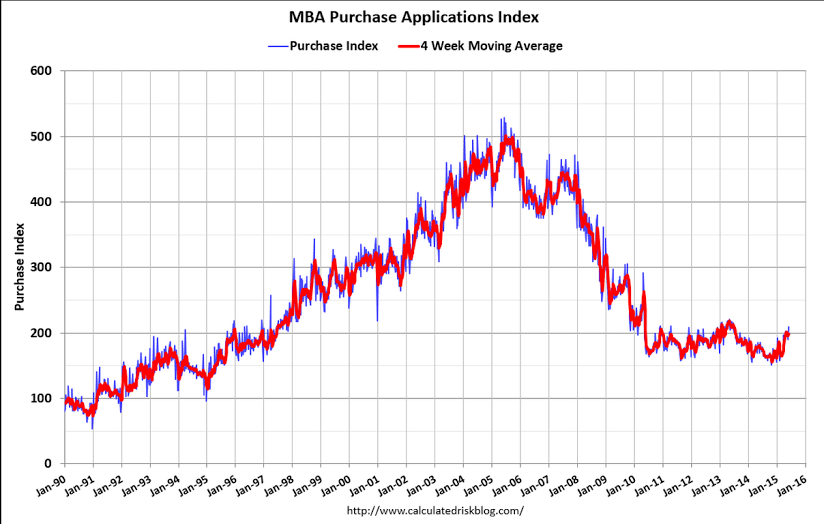
On a brighter note the remaining home builders are reporting that things are looking up some. But a few % pts gain in this sector which is now less than half of what it used to be isn’t going to drive overall growth:
er-6-15-5
er-6-15-6
And yes, this is the euro zone’s vulnerability and inevitable with an export surplus:

11:00:00 RTRS – GERMANY’S BUNDESBANK SAYS IF THE EURO APPRECIATES STRONGLY, DOWNSIDE RISKS FOR THE ECONOMY WOULD RESULT

Sanders endorsement, Greece, Passenger transportation services index

A bit of press for my endorsement of Bernie Sanders for President after a chat with Stephanie Kelton which included how they’ve been working together on his economic agenda.

Warren Mosler – An International Leader in Modern Monetary Theory Endorses Bernie Sanders

Varoufakis completely misses the point.

First, the only way public debt, for all practical purposes, need be ‘paid back’ is via refinance.

Second, with the implied guarantee of the ECB’s ‘do what it takes’ policy, rates are down and market forces not applicable for those members ‘in good standing’ and not at risk of losing that ECB support.

Third, Greece, and the entire euro zone, is in desperate need of larger deficits/more public debt, either through tax reductions or spending increases (that choice is political). So even if Greece ‘wins’ on all points currently being negotiated the economy still deteriorates, just at a slower pace.

Fourth, if Greece attempts to go to drachma or any kind of ‘parallel currency’, based on discussion I’ve heard and read, it will most likely be a case of out of the frying pan and into the fire. The expertise required to do it right is not evident at any level.

Varoufakis demands slash to Greek debt

June 15 — Greek finance minister Yanis Varoufakis said that his country desperately needed some of its debts written off if it is ever to pay anything back.

“Only [with debt cuts] can we guarantee the repayment of as much of our debt as possible and actually deliver,” Varoufakis told Bild on Monday.

He claimed that he would immediately agree to further financial aid from the country’s creditors – which he and Prime Minister Alexis Tsipras have until now resisted due to the harsh conditions attached to it – if some of Greece’s debts could be cancelled

Another index in decline:
passenger-trans-services

EU Industrial Production, Credit Check, Atlanta Fed

Even with increasing net exports, over all GDP isn’t benefiting all that much, as fiscal policy and structural reforms that assist exports do so by restricting incomes and domestic demand to achieve ‘competitiveness’. Additionally, negative rates and QE remove some interest income from the economy, which also restricts domestic demand to some degree. And, ironically, the subsequent current account surplus puts upward pressure on the euro until there are no net exports, obviating the efforts and sacrifices that went into achieving the competitiveness. Further note that a Greek default, for example, fundamentally removes net euro financial assets from the economy, further tightening the euro, as Greek debt is nothing more than bank deposits in the ECB system:

European Union : Industrial Production
er-6-12-6
Highlights
The goods producing sector began the second quarter on a surprisingly soft note. A 0.1 percent monthly rise in production (ex-construction) was comfortably short of expectations and followed a steeper revised 0.4 percent decline in March. As a result, annual workday adjusted output growth dropped from 2.1 percent to 0.8 percent, its slowest pace since January.

However, April’s minimal monthly rebound would have been rather more impressive but for a 1.6 percent slide in energy. Elsewhere there were gains in intermediates (0.3 percent), capital goods (0.7 percent) and consumer durables (1.0 percent). Non-durable consumer goods were down 0.8 percent but, apart from this category, all sectors reported increases versus a year ago.

Amongst the larger member states output rose a solid 0.8 percent on the month in Germany but there were falls in France (1.0 percent), Italy (0.3 percent) and Spain (0.1 percent). Elsewhere Finland, already technically in recession, only saw output stagnate following a cumulative 2.4 percent loss since the end of last year while Greece (also back in recession) posted a hefty 2.3 percent reversal.

April’s advance leaves Eurozone industrial production just 0.1 percent above its average level in the first quarter when it increased fully 0.9 percent versus October-December. This provides early warning of a probable smaller contribution from the sector to real GDP this quarter and so underscores the need for the ECB to see out its QE programme in full.
er-6-12-7

Portfolio selling from blind fear of QE and negative rates and Greece, etc. drove down the euro, but fundamentally inflation was falling and ‘competitiveness’ increasing so the trade surplus was pushed higher by the lower levels of the currency. Now it looks like the increasing trade flows are ‘winning’ and beginning drive the euro higher, with portfolios ‘sold out’ of euro, all of which should continue until the trade flows subside:
er-6-12-8
Back to the US:

I see no sign of whatsoever of accelerating credit growth:
er-6-12-9
This got some attention when the growth rate was increasing, but not anymore since it rolled over and remains well below prior cycles:
er-6-12-10
They make point of potential growth every time one of the little wiggles bends up, but just look at how low the growth rate actually is, especially compared to prior cycles:
er-6-12-11
er-6-12-12
Nothing happening with consumer lending:
er-6-12-13
This shows how competitive banking is as banks compete by narrowing their spreads over their cost of funds:
er-6-12-14
er-6-12-15
er-6-12-16
The Atlanta Fed forecast ticked up with the latest retail releases, but still remains well below mainstream forecasts and is also indicating what would be a very weak ‘bounce’ from the negative Q1 print, as the implied first half GDP growth rate would only be around .6%- very close to an ‘official’ recession. And as you’ve seen from the charts, those same releases indicated continued year over year deceleration of growth (including autos and retail sales) as well as elevated inventories, which doesn’t bode well for Q3 and Q4:
er-6-12-17

Consumer Sentiment, producer prices, summer jobs

Yes, it’s a bit of a rebound from last month, and being touted as proof of a strong recovery, but it also looks like the drift down may still be in progress, much like the consumer sales showed disturbingly declining rates of annual growth even though the recent release was an uptick:

Consumer Sentiment
er-6-12-1
Highlights
This week’s retail sales and consumer sentiment reports offer a one-two punch. Consumer sentiment is back on the climb, jumping nearly 4 points to 94.6 which is well above the Econoday consensus for 91.2. The gain is centered in the current conditions component, up 6.0 points to 106.8, which offers an early signal for June-to-May consumer strength. The expectations component shows a smaller but still healthy gain, up 2.6 points to 86.8. The gain here points to confidence in the jobs outlook.

Gas prices have been edging higher but are not affecting inflation expectations which ticked lower, down 1 tenth to 2.7 percent for both the 1-year and 5-year outlooks.
er-6-12-2

Headline Retail Sales “Improve” In May 2015. We Still See a Slowing Trend.

By Steven Hansen

Retail sales improved according to US Census headline data and were at expectations. We see a continued slowing of retail sales using the year-over-year unadjusted data. Consider that the headline data is not inflation adjusted and prices are currently deflating making the data better than it seems (but still not excellent and still decelerating).

‘Inflation’ remains well below Fed targets and no hard evidence its picking up:
er-6-12-3
er-6-12-4
er-6-12-5

Retail sales, business inventories, import/export chart

Sales up to higher gas prices is nothing to brag about:

Retail Sales
er-6-11-1
Highlights
The consumer showed a lot of life in May, driving up retail sales 1.2 percent with gains sweeping nearly all components. A leading component in the month was motor vehicle sales which jumped 2.0 percent, excluding which retail sales still rose a very strong 1.0 percent. Another component showing special strength was gasoline sales which got a boost from higher prices. Still, excluding both of these components, retail sales ex-auto ex-gas gained a very solid 0.7 percent. These results offset weakness in April, when total sales rose only 0.2 percent (upward revised from no change).

In contrast to weakness through most of the April report, there’s only one component showing contraction in May and that’s the usually solid health & personal care stores at minus 0.3 percent. Standouts on the plus side, apart from vehicles and gasoline, are building materials & garden equipment stores, up 2.1 percent, clothing & accessories stores, up 1.5 percent, and nonstore retailers, up 1.4 percent. Department stores, which sank a steep 2.9 percent in April, rebounded with a 0.8 percent gain.

The long awaited rebound from the soft first quarter is finally here. Today’s results will have forecasters upping their estimates for second-quarter GDP. These results will also be a key point of discussion, especially in arguments by the hawks, at next week’s FOMC meeting.

See the move up since the decline earlier in the year January? The analysts are looking at those last few months and calculating the growth rates of just that segment and saying that’s how fast the economy is growing, etc:
er-6-11-2
The % change year over year chart doesn’t look so good:
er-6-11-3
Same with vehicle sales. Yes, ‘new highs’ but the growth is slowing, which is what counts when calculating year over year growth of the economy:
er-6-11-4
er-6-11-5
All the talk about this showing where the money saved on gas was being spent has dried up:
er-6-11-6
Inventories remain elevated. Unsold inventory most often leads to a slowdown in output:

Business Inventories
er-6-11-7
Highlights
Inventories are rising in line with sales, pointing to well-balanced strength for second-quarter GDP. Business inventories rose 0.4 percent in April, just below a strong 0.6 percent in business sales and leaving the stock-to-sales ratio unchanged at 1.36.

Of the report’s three components, retail shows a slight imbalance with inventories jumping 0.8 percent against only a 0.1 percent rise in sales that lifts the sector’s stock-to-sales ratio to 1.46 from 1.45. But this is likely to reverse in the May inventory report given the enormous strength in this morning’s retail sales report for May.

Looking at the other two components, inventories at wholesalers are a little leaner than they had been, at a stock-to-sales ratio of 1.29 vs 1.30, while manufacturers are a little less lean, at 1.35 vs 1.34.

er-6-11-8
er-6-11-9

mtg purchase apps, China comment

Mortgage purchase apps were up 10% for the week, leaving them about 15% higher than last year, which is where they’ve been for a while. However, cash sales are down sharply, so it seems that buyers have shifted from all cash to borrowing, leaving the total purchases about the same:

Weekly mortgage applications jump as rates surge

By Diana Olick

June 10 (CNBC) — Interest rates’ sharp jump to their highest level this year caused a sudden surge in mortgage applications. While that may seem counter-intuitive, there’s a reason: Fear that rates will move even higher.

Total mortgage application volume jumped 8.4 percent on a seasonally adjusted basis for the week ending June 5th from the previous week, according to the Mortgage Bankers Association (MBA). The previous week included an adjustment for the Memorial Day holiday.

“Mortgage application volume rebounded strongly…indicating that the holiday had a larger impact on business activity than originally assumed,” said Mike Fratantoni, MBA’s Chief Economist.

Refinance volume increased 7 percent week-to-week, and applications to purchase a home jumped 10 percent, both seasonally adjusted. Purchase volume is now 15 percent higher than the same week one year ago, but refinance volume is off nearly 5 percent. The weekly move higher in refinances was likely due to the holiday skewing the trend. Refinances are still lower than they were two weeks ago. This all comes as rates continue to climb.

The average contract interest rate for 30-year fixed-rate mortgages with conforming loan balances ($417,000 or less) increased to 4.17 percent, its highest level since November 2014, from 4.02 percent, with points increasing to 0.38 from 0.33 (including the origination fee) for 80 percent loan-to-value ratio loans, according to the MBA

While higher rates make home buying more expensive, sharp moves higher often have the immediate effect of getting potential buyers off the fence, before chilling the overall market in the longer term. That is especially true now, as the Federal Reserve is widely expected to increase interest rates in addition to what is happening in the U.S. bond market already.
er-6-10-1

China:

Confirms that their western educated economists’ believe ‘monetary policy’/rate cuts etc. work to increase output and employment, even though I think they are entirely wrong and backwards:

China’s economy to pick up in H2: Central bank economists

June 10 (CNBC) — Economists at China’s central bank have sharply lowered their 2015 inflation forecast even as they predicted that stabilising Chinese home prices and firmer foreign demand will drive a pick-up in the world’s second-biggest economy in the next six months.

In a report posted on the central bank’s website on Tuesday, economists at the People’s Bank of China (PBOC) said they had cut their 2015 inflation forecast for China to 1.4 percent, from an initial 2.2 percent.

The report, which said the estimates represented the view of the analysts and not that of the PBOC, contained other downward revisions to forecasts that underscored headwinds being faced by the slowing Chinese economy.

Yet, the economists were cautiously optimistic on the outlook.

The property market is “starting to stabilise” and the world economy should show further signs of a recovery in coming months, said the economists who were led by Ma Jun, the chief economist at the central bank.

Looser monetary policy conditions as a result of China cutting interest rates thrice since November were also expected to help shore up growth in coming months, the economists said.

“We estimate that our country’s gross domestic product growth in the second-half of the year will be higher than in the first-half,” they said, noting that it takes six to nine months for China’s economy to feel the effects of monetary policy easing.

The report showed the economists had shaved their forecast for China’s economic growth to 7.0 percent for 2015, from 7.1 percent previously.

The forecast for producer prices was also sharply revised to indicate deepening deflationary pressure. The producer price index is now expected to fall 4.2 percent for 2015, from an estimated decline of 0.4 percent previously.

Redbook retail sales, small business index, QE comment, wholesale trade, jolts

Getting worse instead better in Q2:
er-6-9-1
It’s up which is good, but not even back to q1 January high and below historic ‘good economy’ levels:

NFIB Small Business Optimism Index
er-6-9-2
Highlights
The small business optimism index came in well above expectations, at 98.3 for a very solid 1.4 point gain from April’s 96.9 and compared with the Econoday consensus for 97.2. The gain is centered right where small business owners need it the most, in earnings trends. The gain here in turn is lifting the small business outlook with more saying this is now a good time to expand. The outlook on the general economy is also up as are job readings. This report hints at the big second-quarter rebound that many have been expecting.
er-6-9-3
er-6-9-4

Calculated Risk:

From the National Federation of Independent Business (NFIB):Small business optimism level is finally back to a normal level

The Index of Small Business Optimism increased 1.4 points to 98.3 … May is the best reading since the 100.4 December reading but nothing to write home about. The 42 year average is 98.0 … Eight of the 10 Index components posted improvements.

er-6-9-5
er-6-9-6

QE comment:

This gets to the bottom it- if the total number of securities outstanding remains unchanged, QE has done nothing apart from removing about $100b of interest income from the economy each year and maybe some repricing of financial assets. That is, at the macro level portfolios can’t be increasing risky assets if the total isn’t increasing:

Antonin Jullier, global head of equity trading strategy at Citi, told CNBC Tuesday that the bond-buying policies implemented by central banks including the Federal Reserve and European Central Bank had had a detrimental effect.

“The lack of liquidity is coming from QE, it’s one of the consequences…it’s sucking it out,” he said.

The aggressive stimulus was “one-sided,” according to Jullier, who said it was increasing valuations of securities, but not producing more stock flotations or capital increases.

“The net inventory of securities has actually been flat for years now. So there are no new securities available,” he added, calling it a period of “de-equitization.”

Inventories up more than expected which adds to Q2 GDP, but it’s still an inventory build and the inventory/sales ratio is still too high historically, which doesn’t bode well for production. The sales growth is a positive but a small rebound from prior declines, which is good for Q2 vs /Q1, but it’s an April read with 2 months to go.

Wholesale Trade
er-6-9-7
Highlights
Inventories relative to sales lightened up in the wholesale sector during April with inventories up 0.4 percent but far below a giant 1.6 percent surge in sales. The stock-to-sales ratio edged down to 1.29 from 1.30. Autos, where sales have been strong, show a sizable decline in the stock-to-sales ratio as do farm products, furniture, computer equipment, and electrical goods. All these categories, like autos, show strong sales gains in the month.

Early indications on second-quarter inventories have been favorable with the risk of overhang, evident in the first quarter, now easing. Watch Thursday for the business inventories report which will round out related data for April.

er-6-9-8
er-6-9-9
And this doesn’t say much for construction prospects:
er-6-9-10
Another mixed bag with openings higher but actual hires pretty much flat as were quits:

Job Openings and Labor Turnover Summary

The number of job openings rose to 5.4 million on the last business day of April, the highest since the series began in December 2000, the U.S. Bureau of Labor Statistics reported today. The number of hires was little changed at 5.0 million in April and the number of separations was little changed at 4.9 million. …

Quits are generally voluntary separations initiated by the employee. Therefore, the quits rate can serve as a measure of workers’ willingness or ability to leave jobs. … There were 2.7 million quits in April, little changed from March.

Hires may have even peaked:

JOLTS
er-6-9-11
Highlights
The hawks have something to talk about with the April JOLTS report where job openings surged to 5.376 million, far above the Econoday consensus for 5.038 million and the high estimate at 5.050 million. This is the highest reading in the history of the series going back to 2000. Year-on-year, openings are up an eye-popping 22 percent!

And the report includes a big upward revision for March, to 5.019 million vs an initial 4.994 million. April’s job openings rate rose to 3.7 percent from 3.5 percent.

This report will boost talk among the hawks that slack in the labor market is evaporating and that employers will have to raise wages to fill positions. Other readings include a tick lower for the quits rate, to 1.9 percent, and a tick lower for the separations rate, to 3.5 percent from 3.6 percent.

er-6-9-12
er-6-9-13
And you can see how much of a lagging indicator this stuff can be:
er-6-9-14

Labor market index, Container index

Labor Market Conditions Index
er-6.8-1
Highlights
Labor market conditions are improving with the index rising to plus 1.3 in May vs an upward revised minus 0.5 percent in April. The gain underscores Friday’s very strong employment report as well as the long run of very favorable jobless claims reports. Still, 1.3 isn’t that strong of a reading and doesn’t point to any urgency for a Federal Reserve rate hike. This index measures a broad range of labor indicators.

From Asia to America and Europe:
er-6.8-2

Federal Deficit below last year

The budget deficit is now looking too small to sustain growth, as evidenced by the incoming data over the last 6 months. The problem is, as always, unspent income- aka demand leakages- must be offset by agents spending more than their incomes or the output goes unsold. And collapsing GDP growth and rising inventory ratios are telling me that’s it’s been happening ever since the price of oil collapsed, ending the shale related capex, with nothing yet stepping up to fill that spending gap.

At the same time, the Federal govt is going the other way as, reducing the amount that it’s spending in excess of taxation. Additionally, with the current tax structure, if there is any pick up in growth from private sector credit expansion it will cause the federal deficit to further decline, which will require that much more private sector deficit spending to support growth. That’s why the tax structure and transfer payment structure are called ‘automatic fiscal stabilizers’. And, of course, if the economy does stall, the Fed will get the blame for ending QE and more recently allowing longer term rates to rise…

CBO: Fiscal 2015 Federal Deficit through May about 10% below Last Year

Consumer credit

Revolving credit rising when consumer spending is not is a sign of stress:

Consumer Credit
cc-6-5-1
Highlights
Consumer borrowing is showing very solid life, up $20.5 billion in April following an upward revised gain of $21.3 billion in March. The key for this report is a second big gain in revolving credit which is the component where credit cards are tracked. This component rose $8.6 billion following March’s gain of $4.9 billion. These are unusually strong gains for this reading and point squarely at rising consumer confidence. Nonrevolving credit rose $11.9 billion in the month reflecting vehicle financing and another rise in student loans.

Nothing at all exciting happening here:
cc-6-5-2
If anything this goes up in front of recessions. It went up into 2014 but rescued by the income from the shale boom that ended in Q4:
cc-6-5-3
This is mainly student loans and you can see the growth rate is still declining:

cc-6-5-4

cc-6-5-5