PMI services, Oil capex

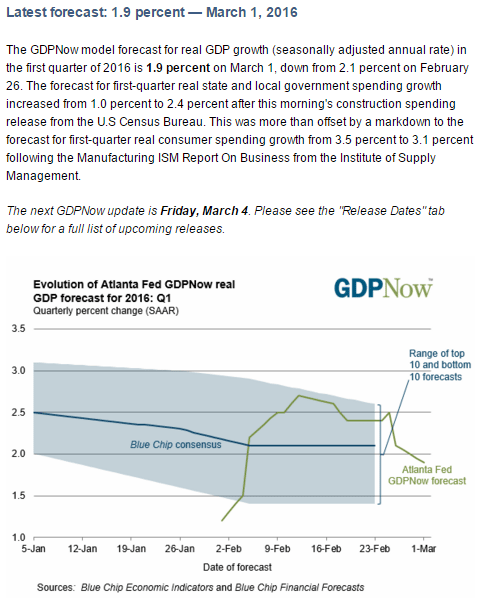
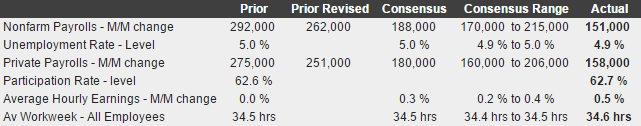
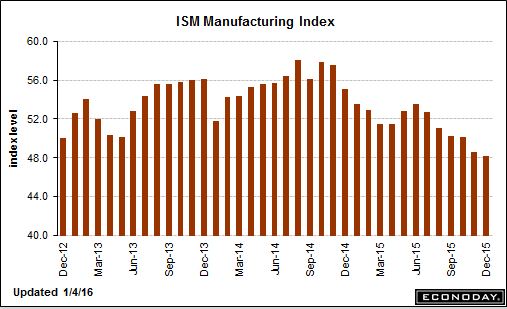
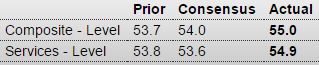
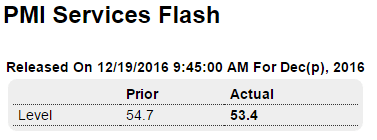
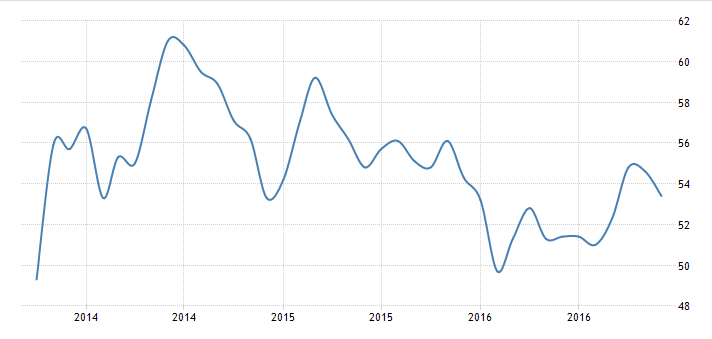
Less than the expected 55.2 as weakness in the services sector continues, and as post election hopes fade:

121901

Highlights

Growth in new orders, though still near a 12-month high, has slowed so far this month, pulling down the flash services PMI for December by more than 1 point to 53.4. But, given the comparison with November’s unusual strength in new orders, the slowing is deceptive. Other readings in the report are clearly favorable including a gain in backlogs that has triggered a gain in hiring. Optimism is still weaker than average but is up from the record lows hit in June, boosted by orders and also by expectations for greater economic strength in the year ahead. Price data are also coming alive, with input costs up and selling prices showing rare traction. Despite the strength, today’s report will likely lower expectations for December’s ISM non-manufacturing report which was also unusually strong in November (the ISM will be posted in the first week of January).

121902
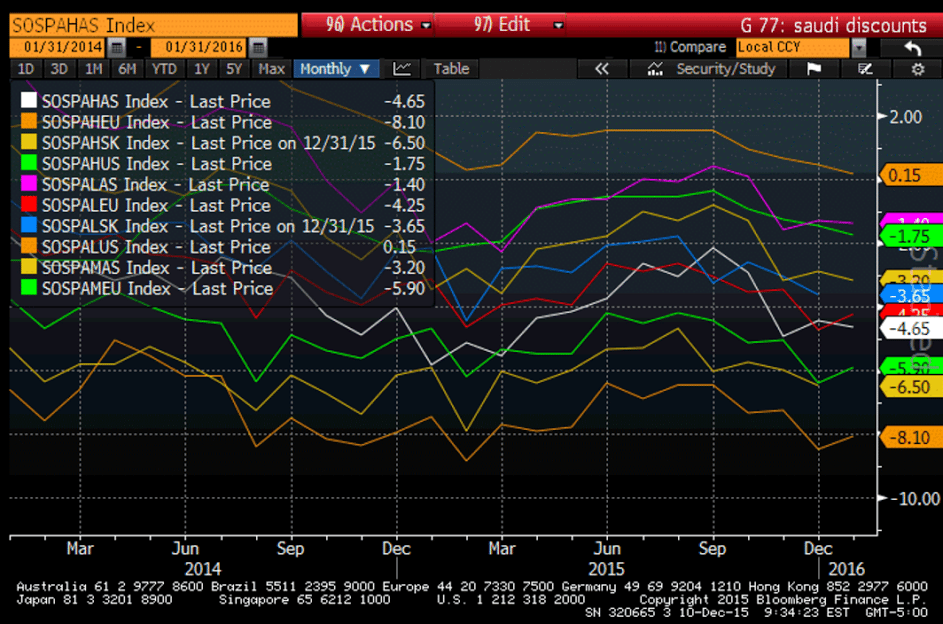
Coming back some from a drop of maybe $250 billion, so this increase will just be a drop in the bucket at this point:

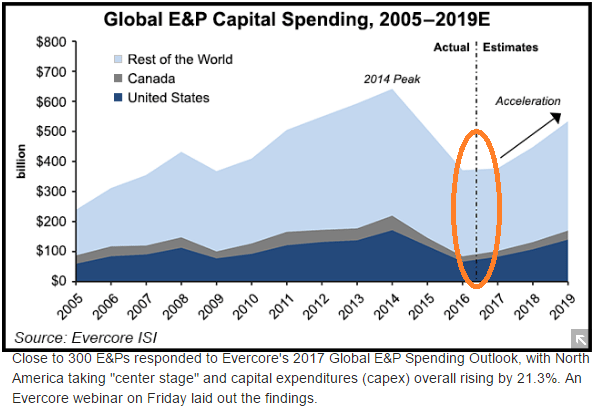
North American E&Ps Forecast to Boost Capex For First Time Since 2014, With U.S. Rising 24.5%

By Carolyn Davis

Dec 19 (NaturalGasIntel) — North America will spearhead a recovery in global upstream investment in 2017, with U.S. spending — weighted on the onshore — forecast to jump by 24.5%, while Canada outlays will be 9.5% higher, according to an annual survey by Evercore ISI.

Senior Managing Director James C. West, who has overseen spending surveys of global exploration and production (E&P) operators for 17 years, told NGI’s Shale Dailythat producers “are definitely more optimistic than in the last two years.”

If oil and natural gas prices continue to climb, spending in the coming year could go even higher, he said.

Close to 300 E&Ps responded to Evercore’s 2017 Global E&P Spending Outlook, with North America taking “center stage” and capital expenditures (capex) overall rising by 21.3%. An Evercore webinar on Friday laid out the findings.

Early Signs of Bigger Budgets

U.S. spending is pegged to rise from around $66.51 billion to $82.77 billion, while Canadian E&Ps are expected to raise spending from around $17.54 billion to $19.21 billion. However, those are “conservative” estimates, West said, as the survey was completed before the Organization of the Petroleum Exporting Countries in late November formally agreed to reduce oil output beginning Jan. 1.

121904

GDP, Corporate profits, Oil capex, Truck tonnage, Vehicle sales preview

Pretty much as expected, inflation a bit lower.

Inventories revised up so Q2 that much more likely to see an inventory reduction along with associated cuts in output:

GDP
er-5-30-1
Highlights
First-quarter GDP is now revised higher but only slightly, to an annualized growth rate of plus 0.8 percent for a 3 tenths gain from the initial estimate. Upward revisions to residential investment and exports are behind the small gain along with an unwanted upward revision to inventories. Nonresidential investment remains very weak with government purchases holding only modestly positive. Personal consumption was soft, unrevised at a plus 1.9 percent rate. Final demand is revised higher but not by very much, only 1 tenth to a very soft plus 1.2 percent. Inflation data are weak with the GDP price index revised 1 tenth lower to an annualized plus 0.6 percent. Residential investment, boosted by home improvements, is the standout in this report which otherwise shows a very soft opening to 2016.

Next month I expect the year over year growth rate to decline substantially and continue to decline, as the weather related easy comparison with last year is ‘replaced’ by a much tougher comparison:
er-5-30-2
er-5-30-3
Still lots of time for these forecast to come down. They’ve been held up by April releases, including inventory building, housing and cars that have already shown signs of the reversals I expect in May:
er-5-30-4

May 27, 2016: Highlights

The FRBNY Staff Nowcast for GDP growth in 2016:Q2 has increased for the third week in a row and stands now at 2.2%.

Positive news came from new single family houses sold and manufacturers’ new orders of durable goods.

This week’s second estimate of GDP growth for 2016:Q1 from the Commerce Department was 0.8%. In the advance estimate released last month, GDP growth was 0.5%. The last FRBNY Staff Nowcast for that quarter, computed before the release of the advance estimate, was 0.7%.

Corporate profits have gone negative, as happens when deficit spending (private and public) is too low to offset desires to not spend income (savings). The immediate culprit was the drop in oil related capex spending that is spreading to the rest of the economy:

Corporate Profits
er-5-30-5
er-5-30-6

From the Bank of Canada- shows how just US oil capex spending and production has and continues to decline:
er-5-30-7
Interesting blip up and reversal pattern here too:
er-5-30-8
er-5-30-9
A reversal from April’s modest uptick, and down from last summer’s highs.

I see the year over year change in the process of going negative here as well:

Vehicle Sales Forecasts: Sales to be Over 17 Million SAAR in May

by Bill McBride on 5/26/2016 01:40:00 PM

The automakers will report May vehicle sales on Wednesday, June 1st.

Note: There were 24 selling days in May, down from 26 in May 2015.

From WardsAuto: May Forecast Calls for Improved Sales, Days’ Supply

WardsAuto forecast calls for U.S. automakers to deliver 1.52 million light vehicles in May.

The forecast daily sales rate of 63,443 units over 24 days represents a 1.3% improvement from like-2015 (26 days), while total volume for the month would fall 6.5% from year-ago. The 14.4% DSR increase from April (27 days) is ahead of the 7-year average 8% growth.

The report puts the seasonally adjusted annual rate of sales for the month at 17.3 million units, slightly above the 17.1 million SAAR from the first four months of the year, but below the 17.6 million SAAR reached in May 2015.

Employment, Trade

Education employment was mysteriously down big last month and up big this month, so best to average the two months, which would mean about 205,000 new jobs each month, which is about where it’s been.

However, in any case hours worded and average pay were both down, which means personal income and probably output is that much less, which is not good. Additionally, the downward revision in earnings for last month and the negative print this month tell me ‘the market’ is telling us there’s still substantial ‘slack’ in the ‘labor market’:

Employment Situation
er-3-4-1
Highlights
The labor market is adding jobs at a very strong rate. Nonfarm payrolls rose 242,000 in February vs the Econoday consensus for 190,000 and a high estimate of only 217,000. Adding to the punch are upward revisions to the two prior months totaling 30,000.

A negative in the report is a 0.1 percent decline in average hourly earnings that follows, however, January’s outsized 0.5 percent gain. Year-on-year, average hourly earnings are down 3 tenths to 2.2 percent. Another negative is a dip in the workweek to 34.4 hours which also, however, follows strength in the prior month when it rose to 34.6 hours.

The unemployment rate remains low at 4.9 percent while the labor participation rate continues to rebound, up 2 tenths in the month to 62.9 percent and boosted by new entrants and re-entrants into the labor market. The U-6 unemployment rate, which is cited frequently by Janet Yellen, is down a full 2 tenths to 9.7 percent.

Payroll strength by industries includes a second straight strong month for retail, up 55,000, and another strong month for trade & transportation, up 53,000. Professional & business services rose 23,000 but temporary help services fell for a second straight month, down 10,000 following a 22,000 decline in January. Government added 12,000 to payrolls while construction, where spending is solid, rose 19,000. Mining and manufacturing contracted, down 19,000 and 16,000 respectively.

The earnings numbers are setbacks but do follow prior strength. Payroll gains are unquestionably impressive and today’s report will very likely revive at least the chance for a rate hike at this month’s FOMC.

This is why using a two month average makes sense this month:
er-3-4-2
The chart shows the rate of growth continues the deceleration that began just over a year ago when oil capex collapsed:
er-3-4-3
Still some serious ‘slack’ here:
er-3-4-4
Worse than expected and so not good for GDP forecasts, and with vehicle sales down from last year’s highs rising auto imports mean even weaker domestic car sales:

International Trade
er-3-4-5
Highlights
January was a weak month for cross-border trade with exports down a steep 2.1 percent and imports down 1.3 percent, making for a wider-than-expected trade imbalance of $45.7 billion. Exports of capital goods were especially weak as were imports of capital goods, both pointing to weakness in global business investment. Exports of industrial supplies were also down as were exports of consumer goods and also food products. Imports of industrial supplies were also down as were imports of consumer goods. Imports of autos, however, continue to rise to underscore the ongoing strength in vehicle sales.

The goods gap widened to $63.7 billion from $62.6 billion and when excluding petroleum where the gap narrowed, the goods gap widened to $57.8 billion from $55.5 billion. The nation continues to run a strong surplus on services, at $18.0 billion for a small gain in the month.

The gap with China widened in the month to $28.9 billion for a $1 billion increase while the gap with Europe narrowed sharply, to $8.8 billion from $13.7 billion. The gap with Japan narrowed to $4.9 billion from $6.6 billion while the gap with Canada widened to $2.4 billion from $2.2 billion.

Today’s report will lower early estimates for first-quarter GDP and no less importantly is the latest indication that global traffic is stalling, which is not a plus for global policy efforts to raise inflation.

In past cycles these declines in trade were indicative of recessions:
er-3-4-6
Trade also went bad as oil capex collapsed:
er-3-4-7

Oil price, Radio interview, Fed Atlanta, Canada

Some commentary on the latest Saudi price changes:

Saudi raises crude price to Europe, Asia, cuts it for US

Saudi Arabia, the world’s largest crude exporter, Wednesday raised the April prices of its oil to Asia and Europe but cut it slightly for shipments to the United States.

My quick WRKO radio interview

Down some more, as previously discussed:
er-3-3-10
He’s going the right way, but it’s relatively small and he’s unfortunately still out of paradigm which puts it all at risk of ‘losing the debate’ with critics:

Trudeau’s Message to World: Let Government Spending Do the Work

By Josh Wingrove

March 3 (Bloomberg) — Canadian Prime Minister Justin Trudeau is urging global leaders to rely more on government spending and less on monetary policy to spur growth as he prepares a budget that will push his country into deficit.

In a wide-ranging interview Wednesday in Vancouver, Trudeau highlighted the importance of infrastructure spending and measures to bolster incomes of middle classes he says are critical to driving growth. He also defended his plan to go willingly into the red.

“My message to other government leaders is don’t fall into the trap that thinking that balancing the books” is an end in itself, he said. “It’s a means to an end.”

Trudeau’s arrival on the global scene and his endorsement of deficits marks a sharp about face from his predecessor, Stephen Harper. Along with German Chancellor Angela Merkel and U.K. Prime Minister David Cameron, Harper championed the budget austerity alliance within the Group of Seven that often clashed with the U.S. on fiscal policy.

President Barack Obama will hear a new message next week when he hosts a state dinner for Trudeau at the White House. The Canadian leader’s debut also coincides with an increasing sense in global circles that monetary policy is reaching its limit, fueled in part by Japan’s surprise move to adopt negative interest rates that caused turmoil in currency markets.

“Making sure monetary policy and fiscal policy are aligned and complementary is obviously a benefit to any economy. But at the same time I don’t want to be overly preachy,” Trudeau said. Other countries should consider balanced budgets when feasible “but don’t make it the be-all and end-all because you may be missing out on opportunities to grow your economy — to help citizens prosper — that too much rigidity would actually interfere with.”

G-20 Consensus

At a Group of 20 meeting in Shanghai last week attended by Trudeau’s finance minister, Bill Morneau, officials from the world’s top economies committed their governments to doing more to boost growth amid mounting concerns over the potency of monetary policy.

Trudeau, 44, hinted he is considering expanding on pledges that have his country on pace for a deficit of nearly C$30 billion ($22.3 billion) in the fiscal year that begins April 1. Having promised C$10.5 billion in new spending during the campaign, Morneau delivered a fiscal update last month showing the government is starting from a deficit of C$18.4 billion as Canada grapples with the oil-price shock.

“It’s to me even more of a reason why we need to be investing intelligently in infrastructure, in money in the pockets of the middle class, to grow the economy,” Trudeau said of the fiscal situation he inherited after his majority win in the Oct. 19 election.

Debut Budget

He offered no detail on what new spending may be included in the budget, due March 22, but ruled out big-ticket surprises. “I don’t think we need massive stimulus,” he said. “There’s a limit on how much you can flow infrastructure dollars in a short time frame from a standing start.”

A C$30 billion deficit would be 1.5 percent of gross domestic product. That’s a swing of 1.4 percentage points, from an expected deficit of 0.1 percent of GDP in the current year. Since the end of World War II, there have been only four one-year expansionary fiscal swings of more than 1.4 percentage points of GDP.

Even with C$30 billion in red ink, Canada’s debt-to-GDP ratio would remain among the lowest in the G-7. “That leaves us with more flexibility,” Trudeau said. “If we were sitting at 90 percent debt to GDP, we probably wouldn’t be contemplating the kinds of things we know we’re able to do. If interest rates were radically different — much higher, to take money to invest in our economy — we’d be looking at different kinds of investments.”

Retail Sales, Import and Export prices, Business inventories, Consumer sentiment, Japan

Retail Sales
er-2-12-1
Highlights
Vehicles are back on top, helping to lift retail sales to a 0.2 percent gain in January. Excluding vehicles and pulled down by falling gas prices, sales inched only 0.1 percent higher. But retail sales excluding gasoline stations — which is a central reading given the price fall — are up 0.4 percent for a very respectable year-on-year gain of 4.5 percent. The reading excluding both autos and gasoline is also up 0.4 percent in the month for a year-on-year rate of plus 3.8 percent.

General merchandise sales, which have been soft reflecting price contraction for imports, rose a sharp 0.8 percent in January. Building materials rose 0.6 percent as did vehicles where the year-on-year rate is at plus 6.9 percent. Non-store retailers, reflecting building strength for e-commerce, are once again a standout, up 1.6 percent for a year-on-year 8.7 percent gain.

But there are soft spots in January including restaurants, down 0.5 percent but following a very strong run in prior months, and also furniture, also down 0.5 percent. Sporting goods, a discretionary but still small component, were also weak though the year-on-year rate is leading all the data at 9.1 percent.

A positive are upward revisions to December, now at plus 0.2 percent overall with ex-auto ex-gas now at plus 0.1 percent. Though many readings are modest, this report — especially the ex-gasoline reading — points to a healthy U.S. consumer and should lift confidence in first-quarter growth.

Doesn’t look all that strong to me. And there’s been an conspicuous flattening since July:
er-2-12-2
Just an fyi on light weight truck sales- growth has been falling off:
er-2-12-3
DOE gasoline output implied demand, year over year, 8 week moving average.

Growth rate has gone negative:
er-2-12-4
Deflationary bias continues:

Import and Export Prices
er-2-12-5
Highlights
Import price pressures are negative and severe but are increasingly centered in oil-based goods. Import prices fell 1.1 percent in January but fell only 0.2 percent when excluding petroleum imports. Year-on-year, total import prices are down 6.2 percent, which is steep but still an improvement from prior months. When excluding petroleum, import prices are down a year-on-year 3.1 percent (perhaps modest by comparison) which is also an improvement. But petroleum deflation is severe, with import prices down 13.4 percent in January for a year-on-year minus 35.3 percent.

Export prices fell 0.8 percent in January and reflect, in bad news for the farming sector, a 1.1 percent decline in prices of agricultural exports. Year-on-year, export prices are down 5.7 percent with agricultural products down 12.7 percent.

Price contraction for finished goods is easing though only incrementally. Import prices for both vehicles and consumer goods inched higher in the month with contraction in year-on-year rates narrowing, to only minus 0.3 percent for consumer goods. The export side also shows price improvement.

By countries, import prices with Canada, reflecting fuel prices, continue to fall severely, down 2.8 percent in the month for a year-on-year minus 12.6 percent. Latin America is next, down 1.2 percent and 7.8 percent on the year. Other regions are much narrower with China at minus 0.1 percent in the month and minus 1.6 percent on the year.

This report does fit in with FOMC expectations for an easing downward pull from import prices, at least excluding oil with prices for the latter, sooner or later as policy makers argue, certain to firm. An immediate plus is ongoing strength in the dollar which is pointing to easing import-price contraction for the February report.

er-2-12-6
Inventories still too high and climbing as sales continue to fall short of expectations:

Business Inventories
er-2-12-7

er-2-12-8
More softening of buying plans:

Consumer Sentiment
er-2-12-9

er-2-12-10

Japan Finance Minister says will take necessary steps to deal with FX volatility

Inventories, Payrolls, Trade

This is getting out of control.

Sales are slowing faster than inventories are being sold.
er-2-5-2
er-2-5-3
er-2-5-4
A weak print and year over year growth continues to decelerate as per the chart:

Employment Situation
er-2-5-5
Highlights
Headline weakness masks an otherwise solid employment report for January. Nonfarm payrolls rose 151,000 vs expectations for 188,000. December was revised 30,000 lower to 262,000 but November was revised 28,000 higher to 280,000. Now the signs of strength as the unemployment rate fell 1 tenth to 4.9 percent while the participation rate rose 1 tenth to 62.7 percent. In another sign of strength, the average workweek rose to 34.6 hours to end a long run at 34.5 hours. Average hourly earnings rose a very sharp 0.5 percent though the monthly gain didn’t make for any change in the year-on-year rate which holds steady at a still moderate 2.5 percent.

Manufacturing stands out in the industry data pointing to a strong January for the sector. Manufacturing hours rose in the month while payrolls jumped 29,000 for the best showing since November 2014. Retail trade, up 58,000, also posted its best gain since November 2014. Transportation & warehousing, in a sign of strength for the supply chain, rose 45,000 for the strongest showing since December 2012. On the negative side are temporary help services, down 25,000 but following strong gains in prior months. Government payrolls fell 7,000 as did mining where employment, hit by the drop in oil and commodity prices, was in contraction throughout 2015.

The labor market may be backing off slightly so far this year but it continues to approach full employment, a factor underscored by the month’s jump in hourly earnings and which offers support for further Federal Reserve rate hikes. Note that the big snow storm that hit the East Coast during the month came after the sample week and was not a factor in the data.

er-2-5-6
Yes, there was a monthly gain in the household survey, but on a year over year basis it decelerated from last month and the downtrend remains intact:
er-2-5-7
Wage growth remains well below prior lows and is only back to where it peaked in 2014:
er-2-5-8
The trade gap continues to widen even as the price of oil remains low, as exports weaken:

International Trade
er-2-5-9
Highlights
The nation’s trade deficit widened in December to $43.4 billion from a revised $42.2 billion in November. Exports have been extremely weak and weakened further, down 0.3 percent to $181.5 billion in the month. Exports of civilian aircraft fell sharply with exports of industrial supplies and foods/feeds/beverages also down. Imports rose 0.3 percent to $224.9 billion led by autos and industrial supplies and offsetting a decline for non-auto consumer goods.

Country balances show a $3.4 billion narrowing with China to a $27.9 billion monthly gap and little change with the E.U. at $13.7 billion. The gap with Japan widened by $0.9 billion to $6.6 billion while the gap with Mexico narrowed by $0.7 billion to $4.6 billion. The gap with Canada widened sharply by $1.7 billion to $2.2 billion.

The decline in exports is the latest hard evidence of global effects made more severe for U.S. exporters by the strength of the dollar, but the rise in imports, despite the decline in consumer goods, offers a positive indication on domestic demand, strength underscored this morning by the January employment report.

er-2-5-10

PMI Manufacturing, ISM Manufacturing, Construction Spending, Canada PMI, China Manufacturing PMI

Bad:

PMI Manufacturing Index
er-1-4-1
Highlights
The manufacturing PMI has been consistently running warmer than other manufacturing surveys which helps put into context the disappointment of December’s slowing to 51.2, down from 52.8 in November. The final reading for December is 1 tenth lower than the mid-month flash. Near stagnation in new orders is a key negative in the report, one that points to further slowing for the headline index in coming readings. Orders are still growing but at their slowest pace of the recovery, since September 2009. Backlog orders are contracting sharply, the most since September 2009 as well. The report points to widespread weakness across orders including for export orders where manufacturers continue to site strength in the dollar as a negative.

Very bad, employment down, but export orders did manage a bounce:

ISM Mfg Index
er-1-4-2
Highlights
ISM manufacturing sample is reporting the weakest conditions since July 2009. At 48.2, December is much lower than Econoday’s 49.2 consensus and is only the third sub-50 reading of the recovery. But the story is much the same as it was in November which came in at 48.6 with both months showing slight contraction underway for both new orders and production. Employment in the sample, however, is noticeably weaker than November, at 48.1 for a more than 2 point decline and the second sub-50 reading in the last three months. A sizable 4.5 point rise for new export orders to 51.0 is a positive in the report. Inventories are steady and low but the sample still say inventories are a little bit high which betrays caution in their outlook. Prices for raw materials continue to contract, a reminder that low oil and commodity prices are making it difficult for the Fed to reach its 2 percent inflation target. This report points to ever softer conditions for a sector that, held down by energy and weak foreign demand, showed very little life during 2015.
er-1-4-3

And more bad. Note the ‘processing error’ which resulted in reductions to prior months. As suspected, things have been worse than reported ever since the collapse in oil capex a little over a year ago. And as the chart shows, the blip up as the NY tax credit expired in June continues to reverse:

Construction Spending
er-1-4-4
Highlights
Construction spending had been a highlight of the U.S. economy but less so with November’s report where the headline fell 0.4 percent, far below the Econoday consensus for plus 0.7 percent. The year-on-year gain for spending, at 10.5 percent, is the lowest since April last year. Today’s report also includes sharp downward revisions to prior months, the result of a processing error going back to January last year. October’s initial 1.0 percent monthly gain is now cut 7 tenths to 0.3 percent while September is now at plus 0.2 percent vs an initial plus 0.6 percent.

The processing error, unfortunately for the housing outlook, is centered in the residential component where prior strength has been cut back. Still, residential spending rose 0.3 percent for a second month in a row that follows September’s very solid 1.2 percent gain. Spending on new single-family homes has been rising strongly with the year-on-year rate at a very solid plus 9.3 percent. Spending on multi-family homes did fall in November but has been in fact booming in prior months, up 24.5 percent year-on-year.

Spending on nonresidential construction has also been solid, down in November but with the year-on-year rate at plus 13.6 percent. Public spending has been led by the educational component, up 15.2 percent year-on-year, with highway spending behind at plus 5.6 percent.
er-1-4-5

Canada Manufacturing PMI at Record Low

Jan 4 — The RBC Canadian Manufacturing PMI dropped to 47.5 in December of 2015 from 48.6 in the previous month. It is the fifth contraction and the lowest reading on record due to weak output, new orders and employment.

China Caixin Factory Activity Contracts for 10th Month

Jan 4 — The Caixin Manufacturing PMI in China dropped to 48.2 in December of 2015 from 48.6 in November and below market expectations. While the reading was the lowest in 3 months, factory activity has been in a contraction since March. Production declined for the seventh time in the past eight months, driven in part by a further fall in total new work. Client demand was weak both at home and abroad, with new export business falling for the first time in three months. Manufacturers continued to trim their staff numbers and reduce their purchasing activity in line with lower production requirements. Meanwhile, deflationary pressures persisted, as highlighted by further marked declines in both input costs and selling prices.

Saudi oil pricing, import and export prices, Japan Manufactures’ sentiment

Not a lot of change for January, most ‘discounts’ still at or near the wides, so price action likely to be more of same:
er-12-10-1
Something the Fed takes into consideration:

Import and Export Prices
er-12-10-12
Highlights
Cross-border price pressures remain negative with import prices down 0.4 percent in November and export prices down 0.6 percent. Petroleum fell 2.5 percent in the month but is not an isolated factor pulling prices down as non-petroleum import prices fell 0.3 percent in the month. Agricultural exports are the wildcard on the export side and they fell a sizable 1.1 percent but here too, the deflationary pull is widespread with non-agricultural export prices down 0.6 percent.

Year-on-year contraction is perhaps less severe than prior months but not by much. Import prices are down a year-on-year 9.4 percent with non-petroleum import prices at minus 3.4 percent. Import prices from Canada are down the heaviest, at minus 18.0 percent on the year, with Latin America next at minus 12.7 percent. Showing the least price weakness are imports from China at minus 1.5 percent. Export prices are down 6.3 percent on the year with non-agricultural prices down 5.7 percent.

Of special concern are continuing incremental decreases for prices of finished goods, both imports and exports. Federal Reserve policy makers have been waiting for an easing drag from low import prices, not to mention oil prices as well, with neither yet to appear. Contraction in import prices not only reflects low commodity prices but also the strength of the dollar which has been giving U.S. buyers more for their dollars.

Japan big manufacturers’ mood worsens in Q4

Dec 10 (Reuters) — Big Japanese manufacturers’ sentiment worsened in October-December, a government survey showed. The business survey index (BSI) of sentiment at large manufacturers stood at plus 3.8 in October-December, compared with plus 11.0 in July-September, according to the joint survey by the Ministry of Finance and the Economic and Social Research Institute, an arm of the Cabinet Office, released on Thursday. The BSI measures the percentage of firms that expect the business environment to improve from the previous quarter minus the percentage that expect it to worsen.

France PMI, Germany PMI, EU PMI, EU Retail Sales, UK service PMI, US Trade, ISM Non Manufacturing, Saudi Pricing

France : PMI Composite
er-9-4-1
Highlights
French private sector activity in August expanded at a significantly slower pace than indicated in the flash report according to the final PMI data for the month. At just 50.2, a 7-month low, the key composite output index was revised down an unusually large 1.1 points versus its preliminary reading to stand 1.3 points below its final July mark and close enough to 50 to signal a period of virtual stagnation in economic activity.

The flash service sector PMI was reduced by 1.2 points to 50.6, also a 7-month trough. As previously indicated, what growth there was reflected stronger new orders and rising backlogs although the growth rate of both hit multi-month lows. Certainly firms were not confident enough to add to headcount although, rather surprisingly, business expectations still climbed to their highest level since March 2012.

Meantime, another increase in input costs saw margins squeezed still further as service provider charges continued to fall.

The final PMI figures suggest that the French economy was really struggling last month. Total output was only flat in the April-June period and the survey data so far suggest little better this quarter.

Germany : PMI Composite
er-9-4-2
Highlights
August’s flash composite output index was revised up a full point to 55.0 in the final data for the month. The new level was 1.3 points above July’s final reading, a 5-month high and strong enough to indicate a solid performance by the economy in mid-quarter.

The adjustment to the composite output gauge came courtesy of the service sector for which the preliminary PMI was revised some 1.3 points firmer to 54.9, also its best reading in five months. New orders rose strongly, backlogs were up and employment posted its largest gain since February. Against this backdrop, business expectations for the year ahead climbed to a 4-month peak.

What little progress they continue to make will evaporate with a strong euro, which I see as inevitable given their trade surplus:

European Union : PMI Composite
er-9-4-3
Highlights
The final composite output index for August weighed in at 54.3, a couple of ticks stronger than its flash estimate and 0.4 points above its final July mark.

The flash services PMI was nudged just 0.1 points higher but, at 54.4, now matches June’s 4-year high. Increased output was supported by rising new orders and a sizeable increase in backlogs which, in turn, helped to ensure that employment growth remained respectably buoyant. Firms also became more optimistic about the economic outlook and business expectations for the year ahead climbed higher following July’s 7-month low. Meantime, inflation developments were mixed. Hence, although higher wages and salaries prompted another rise in input costs, margins were squeezed further as service provider charges declined for a remarkable forty-fifth consecutive month.

Regionally, the best performer in terms of the composite output measure was Ireland (59.7) ahead of Spain (58.8) and Italy (55.0 and a 53-month high). Germany (55.0) also had a good month but France (50.2 and a 7-month low) all but stagnated and remains a real problem for Eurozone economic growth.

The final PMI figures suggest that the Eurozone economy is on course for something close to a 0.4 percent quarterly growth rate in the current period, a slight improvement on the second quarter’s 0.3 percent rate. While this would be good news, faster rates of expansion will likely be needed if inflation is to meet the ECB’s near-2 percent target over the central bank’s 2-year policy horizon.

European Union : Retail Sales
er-9-4-4
Highlights
Retail sales were slightly weaker than expected in August but with July’s decline more than halved, annual growth of purchases still comfortably exceeded the market consensus. Volumes were 0.4 percent firmer on the month after a 0.2 percent drop in June for a workday adjusted yearly rise of 2.7 percent, up from 1.7 percent last time.

July’s monthly rebound was led by a 0.8 percent jump in purchases of auto fuel and without this, non-food sales were just 0.1 percent higher having only stagnated in June. Food recorded a 0.2 percent advance. As a result, overall sales in July were 0.3 percent above their average level in the second quarter when they also increased 0.3 percent.

Regionally the advance was dominated by a 1.4 percent monthly jump in Germany. Spain (0.6 percent) also made a positive contribution but France (minus 0.2 percent) saw its first decline since March. Elsewhere, there were solid gains in Estonia (2.5 percent), Malta and Portugal (both 1.1 percent) but Slovakia (minus 0.2 percent) struggled.

Growth of retail sales has slowed in recent months, in keeping with signs that consumer confidence may have peaked, at least for now. According to the latest EU Commission survey, household morale improved slightly in August but still registered its second weakest reading since January. Consumption may continue to rise over coming months but the signs are that its contribution to real GDP growth will be only limited.
er-9-4-5

I’ve been suggesting exports would slow more than what’s been reported so far, though year over year numbers are in decline. It may show up in revisions down the road:
er-9-4-6

er-9-4-7

International Trade
er-9-4-9

Highlights
The nation’s trade gap narrowed to a nearly as expected $41.9 billion in July following an upward revised gap of $45.2 billion in June (initially $43.8 billion). The improvement reflects a monthly rise of 0.4 percent in exports, which were led by autos, and a 1.1 percent contraction in imports that reflected a decline in pharmaceutical preparations and cell phones which helped offset a monthly rise in imports of oil where prices were higher in July.

Aside from autos, exports of industrial supplies, specifically nonmonetary gold, were strong in July while exports of capital goods also expanded. This helped offset a monthly decline in exports of civilian aircraft and consumer goods. Turning again to imports, other details include a rise in capital goods in what is the latest sign of life for business investment.

By nation, the gap with China widened slightly, to an unadjusted $31.6 billion in the month, while the gap with the EU widened more substantially to $15.2 billion, again unadjusted which makes month-to-month conclusions difficult. Gaps with Mexico and Canada both narrowed.

This report is another positive start to the quarter and will lift early third-quarter GDP estimates. But these will be cautious estimates as recent market turbulence pushes back conclusions and will make August’s trade data especially revealing.

Lower but still indicating ok expansion:
er-9-4-1

Saudi price setting adjustment:

Aramco Cuts All October Crude Pricing to U.S., Northwest Europe

By Anthony DiPaola

Sept 3 (Bloomberg) — Saudi Arabia, the world’s largest crude exporter, cut pricing for all October oil sales to the U.S. and Northwest Europe and reduced the premium on its main Light grade to Asia by 30 cents a barrel.

State-owned Saudi Arabian Oil Co. cut its official selling price for October sales to Asia of Arab Light crude to 10 cents a barrel more than the regional benchmark, the company said in an e-mailed statement. The discount for Medium grade crude for buyers in Asia widened 50 cents to $1.30 a barrel less than the benchmark.

Brent, a global oil benchmark, fell almost 50 percent last year as Saudi Arabia and other OPEC members chose to protect market share over cutting output to boost prices. Brent fell from over $100 a barrel in July 2014 to less than half that six months later. It traded at about $50 on Thursday.

The Organization of Petroleum Exporting Countries led by Saudi Arabia decided on June 5 to keep its production target unchanged to force higher-cost producers such as U.S. shale companies to cut back. The producer group has exceeded its target of 30 million barrels a day since May 2014.

Saudi Arabia reduced production in August to 10.5 million barrels a day, the first decline this year, according to data compiled by Bloomberg.

Producer Prices, Industrial Production, Rail Traffic, Container Exports


This is not a reason to hike rates, but the Fed has other reasons beginning with their mistaken belief that the current policy is ‘highly accommodative’ and potentially inflationary, etc. etc. etc. when the opposite is the actual case:

er-8-15-1

Up a bit more than expected, but all due to auto production, and yesterday’s wholesale trade report told us it all went to building (unsold) inventory, with sales of domestic cars relatively flat, so look for a reversal over the next few months. And note the reference to weak exports:

Industrial Production
er-8-15-2

Highlights
A 10.6 percent surge in motor vehicle production gave a very significant lift to industrial production which rose 0.6 percent in July. The manufacturing component, which has been flat all year, jumped 0.8 percent. Excluding vehicles, however, manufacturing rose only 0.1 percent. The lack of strength here is the result of business equipment which edged only 0.1 percent higher after declining 0.2 percent in June.

The rise in production drove capacity utilization up 3 tenths to 78.0 percent which is where it was back in April. Capacity utilization for manufacturing rose 5 tenths to 76.2 percent.

The two non-manufacturing components are mixed. Production at utilities, due to July’s cool weather, fell 1.0 percent with capacity utilization down 8 tenths to 79.1 percent, while mining production rose 0.2 percent with capacity utilization down 1 tenth to 84.4 percent.

Weak foreign demand and weakness in the energy sector may be hurting much of the industrial sector but these factors are not at play in the domestic auto industry. The readings in today’s report are mixed but the headline gain, driven by the convincing strength for autos, is an eye catcher and will certainly be ammunition for the hawks at next month’s FOMC meeting.

er-8-15-3


Weaker than expected and continuing to fade some (in line with stocks…), and note that it peaked with the fall in oil prices:

er-8-15-4

Rail Week Ending 08 August 2015: Continued Decline of One Year Rolling Average

By Steven Hansen
August 13 (Econintersect)

Econintersect: Week 31 of 2015 shows same week total rail traffic (from same week one year ago) contracted according to the Association of American Railroads (AAR) traffic data. Intermodal traffic expanded year-over-year, which accounts for approximately half of movements. and weekly railcar counts continued in contraction.

U.S. Containerized Exports Fall Off the Chart

By Wolf Richter
August 13 (Wolf Street)

“Many of our major trading partners are experiencing stalled or slowing economies, and the strength of the US Dollar versus other currencies is making US goods more expensive in the export market.” That’s how the Cass/INTTRA Ocean Freight Index report explained the phenomenon.

What happened is this: The volume of US exports shipped by container carrier in July plunged 5.8% from an already dismal level in June, and by 29% from July a year ago. The index is barely above fiasco-month March, which had been the lowest in the history of the index going back to the Financial Crisis.

The index tracks export activity in terms of the numbers of containers shipped from the US. It doesn’t include commodities such as petroleum products that are shipped by specialized carriers. It doesn’t include exports shipped by rail, truck, or pipeline to Mexico and Canada. And it doesn’t include air freight, a tiny percentage of total freight. But it’s a measure of export activity of manufactured and agricultural products shipped by container carrier.

Overall exports have been weak. But the surge in exports of petroleum products and some agricultural products have obscured the collapse in exports of manufactured goods

er-8-15-5