ICSC Survey


[Skip to the end]

Karim writes:

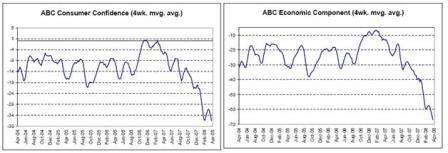
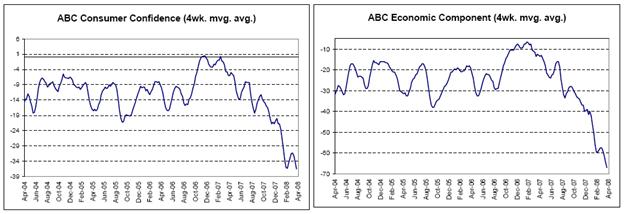
The ICSC weekly chain store sales index was unchanged for the week ending May 24 compared with the prior week and rose by 1.5% from the same week of the prior year–steady with the prior week. The ABC News/Washington Post Consumer Comfort Survey for the period ending May 25 continued to show a record low buying climate evaluation by consumers (for two consecutive weeks) with 81% of respondents calling it a bad time to spend money.

ICSC Research’s statistical analysis (combined with the consumer survey result) suggests that the record high gasoline prices at the pump are dragging down chain-store sales demand by nearly 1 percentage point currently, while the lift so far from higher income, because of the federal tax rebate, is only offsetting that spending drag by about a quarter of percentage point. As such, the net effect (approximately -0.75 pp.) continues to be negative on store spending. April chain store sales on a year-over-year comparable-store basis rose by 3.5%, based on ICSC’s tally of retail chains. However, the April 2008 increase was exaggerated by the shift in the date of Easter compared with April 2007. Over the prior two months, the average monthly year-over-year pace was 1.5%.

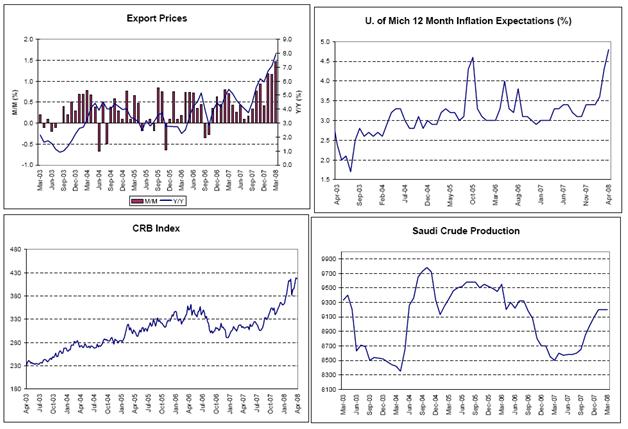
Yes, the key is whether the oil producers ‘spend’ the funds here or ‘save’ them and build reserves as they did in the 1970’s.

So far the booming US exports and annecdotal evidence of massive infrastructure expenditures in the middle east indicate they have been spending their higher revenues and sustaining US GDP at muddling through levels.

This means employment and growth muddle through but real terms of trade and our standard of living declines

As of May 23, 43% of the $107 bn. personal federal tax rebate already has been distributed to taxpayers, which should begin to turn the consumer spending tide a bit. In a special consumer tracking survey taken between May 22 and 25, 12% of households reported spending most of the rebate already. Based on the latest tax rebate flow that would imply approximately $5 to $10 bn. of the rebate was spent already by the 51.7 million taxpayers receiving a rebate check so far.

According to an ICSC Research tax rebate survey, released on May 19, ultimately 22% of households expect to spend the rebate, which will potentially mean nearly $25 bn of spending power over the next several months. For the fiscal month of May, ICSC Research expects monthly sales will grow by between 1% and 2% on a year-over-year same-store basis.

My best guess is more will be spent with a relatively short lag of maybe 30 days after receiving the checks. This includes using the checks to make down payments on deferred purchases, such as small appliances and home improvements, which has a multiplier effect.


[top]

Data Review

thanks, a few quips below:

Karim writes:

  • Conference Board survey falls from 62.8 to 57.2 (lowest since 1992)
  • Both present situation and expectations decline

Labor conditions, plans to buy home and plans to buy auto all fall to new cycle lows

Tough living in an export economy.

  • 1yr inflation expectations jump from 6.8 to 7.7

Inflation rips as non-residents outbid us for your output, as all our funds are spent on food and fuel.

  • Case Shiller Home price index accelerates rate of decline, down 6.7% q/q and 14.1% y/y

Narrow index of 20 metro regions, with 4 or 5 biggest spec boom/bust regions doing most of the damage.

  • New home sales rise 3.3% in April; mths inventories fall from 11.1 to 10.6

Coming back from unsustainably low levels give the US population and income growth.

Actual homes in inventory fell to the lowest levels since July.

  • Jan-March sales data revised lower by cumulative 5.5%

Tough first quarter with record low consumer sediment :) behind us.

2008-05-24 Valance Weekly Chart Review

2008-05-24 Real GDP

Hard to see any recession here, and the consensus is for Q1 to be revised up to 0.9%, bringing year over year up to 2.8%.

I also think the estimates of the effects of the fiscal package are on the low side.

2008-05-24 Personal Spending, Personal Income

Income and spending continue to chug along, ahead of core but not headline ‘inflation’.

2008-05-24 Total Delinquency Rate, Residential Delinquency Rate, All Consumer Loan Delinquency Rate, Credit Card Delinquency Rate

Still moving higher.

2008-05-24 Fiscal Balance, Government Public Debt, Government Spending, Government Revenue

Fiscal rebates now kicking, with other government spending on the rise as well – should be a decent Q2 and better Q3.

And revenues seems to be holding up also indicating no recession yet.

2008-05-24 Export Prices, U. of Michigan 12 Month Inflation Expectations, CRB Index, Saudi Crude Production

2008-05-24 Philly Fed Prices Paid, Philly Prices Received

While headline CPI took a slight breather due to seasonal factors, the drivers of the current bout of inflation continue without let up, as crude oil touches $135 and the USD fall resumes.

Saudi crude output remains above 9 million bpd, indicating world demand is holding at the higher prices.

Booming exports and export prices work in tandem.

Inflation expectations have alarmed the FOMC with recent speeches indicating there will probably be no more rate cuts if inflation continues to escalate .

2008-05-24 U. of Michigan Confidence

Reuters: ICSC chain store sales

TABLE-US chain store sales fell 0.2 pct last week-ICSC

Tue May 6, 2008 7:45am EDT


NEW YORK, May 6 (Reuters) – The International Council ofShopping Centers and UBS Securities on Tuesday released the following seasonally adjusted weekly data on U.S. chain store retail sales.

WEEK ENDING INDEX 1977=100 YEAR/YEAR CHANGE (%) WEEKLY CHANGE (%)
May 3 495.4 2.3 -0.2
April 26 496.3 1.9 0.9
April 19 491.8 1.4 -0.7
April 12 495.3 1.8 0.9

The ICSC-UBS weekly U.S. retail chain store sales index is ajoint publication between ICSC and UBS Securities LLC. It measures nominal same-store sales, excluding restaurant and vehicle demand, and represents about 75 retail chain stores.

Muddling through like most export economies.

Year over year looks okay.

Bloomberg: US First Quarter Advance GDP: Statistical Summary


[Skip to the end]

U.S. First Quarter Advance GDP: Statistical Summary (Table)

by Kristy Scheuble

(Bloomberg) Following is a summary of Gross Domestic Product from the Commerce Department.


  1Q 4Q 3Q 2Q 1Q 4Q 3Q
  2008 2007 2007 2007 2007 2006 2006

Annualized Quarterly Change

Real GDP 0.6% 0.6% 4.9% 3.8% 0.6% 2.1% 1.1%
YOY percent 2.5% 2.5% 2.8% 1.9% 1.5% 2.6% 2.4%

Year over year looks fine.

Personal consumption 1.0% 2.3% 2.8% 1.4% 3.7% 3.9% 2.8%

Down, but holding positive as income continues to grow.

Durable goods -6.1% 2.0% 4.5% 1.7% 8.8% 3.9% 5.6%
Nondurable goods -1.3% 1.2% 2.2% -0.5% 3.0% 4.3% 3.2%
Services 3.4% 2.8% 2.8% 2.3% 3.1% 3.7% 2.0%

Services picking up the slack from goods.

Gross private investment -4.7% -14.6% 5.0% 4.6% -8.2% -14.1% -4.1%
Fixed investment -9.7% -4.0% -0.7% 3.2% -4.4% -7.1% -4.7%
Nonresidential -2.5% 6.0% 9.3% 11.0% 2.1% -1.4% 5.1%
Structures -6.2% 12.4% 16.4% 26.2% 6.4% 7.4% 10.8%
Equipment & software -0.7% 3.1% 6.2% 4.7% 0.3% -4.9% 2.9%
Residential -26.7% -25.2% -20.5% -11.8% -16.3% -17.2% -20.4%

Housing still subtracting quite a bit, has to taper off as it bottoms albeit at very low levels.

  1Q 4Q 3Q 2Q 1Q 4Q 3Q
  2008 2007 2007 2007 2007 2006 2006
Exports 5.5% 6.5% 19.1% 7.5% 1.1% 14.3% 5.7%
Goods 5.2% 3.9% 26.2% 6.6% 0.9% 9.6% 7.4%
Services 6.1% 13.2% 4.0% 9.6% 1.6% 26.0% 2.0%

March trade report could revise exports much higher…

Imports 2.5% -1.4% 4.4% -2.7% 3.9% 1.6% 5.4%
Goods 2.4% -2.6% 4.8% -2.9% 4.2% -0.6% 6.2%
Services 3.5% 5.5% 1.7% -1.7% 2.3% 14.2% 1.3%

and imports lower.

Government consumption 2.0% 2.0% 3.8% 4.1% -0.5% 3.5% 0.8%
Federal 4.6% 0.5% 7.1% 6.0% -6.3% 7.3% 0.9%
National defense 6.0% -0.5% 10.1% 8.5% -10.8% 16.9% -1.5%
Nondefense 1.8% 2.8% 1.1% 0.9% 3.8% -10.0% 6.0%

Federal government spending deferred from 2007 kicking in, especially defense..

State and local 0.5% 2.8% 1.9% 3.0% 3.0% 1.3% 0.7%

As state and local growth slows.

Other Measures

Change in inventories $B $1.8 -$18.3 $30.6 $5.8 $0.1 $17.4 $53.9
Net exports $B -$496 -$503 -$533 -$574 -$612 -$597 -$634
Real final sales -0.2% 2.4% 4.0% 3.6% 1.3% 3.5% 1.0%
Gross domestic purchases 0.4% -0.4% 3.3% 2.4% 1.1% 0.8% 1.3%
Final sales to dom purch -0.4% 1.3% 2.5% 2.1% 1.7% 2.1% 1.2%

Contribution to Change in GDP

Real GDP 0.6% 0.6% 4.9% 3.8% 0.6% 2.1% 1.1%

If revised up with March trade numbers, Q4 would have been the bottom.

Personal consumption 0.68% 1.58% 2.01% 1.00% 2.56% 2.68% 1.88%
Durables -0.48% 0.15% 0.35% 0.14% 0.67% 0.30% 0.43%
Motor Vehicle -0.37% 0.09% -0.17% -0.10% 0.35% 0.00% 0.16%
Nondurables -0.27% 0.25% 0.46% -0.10% 0.61% 0.86% 0.64%
Services 1.43% 1.18% 1.20% 0.96% 1.28% 1.52% 0.81%
Housing 0.23% 0.34% 0.27% 0.29% 0.26% 0.20% 0.18%

Again, services picking up the slack.

Gross pvt dom invest -0.70% -2.40% 0.77% 0.71% -1.36% -2.50% -0.70%
Fixed investment -1.50% -0.62% -0.11% 0.49% -0.70% -1.19% -0.80%
Nonresidential -0.28% 0.63% 0.96% 1.12% 0.22% -0.15% 0.53%
Structures -0.23% 0.41% 0.52% 0.78% 0.20% 0.23% 0.31%
Equipment & software -0.05% 0.22% 0.44% 0.34% 0.02% -0.38% 0.21%
Info processing 0.23% 0.51% 0.24% 0.36% 0.56% -0.06% 0.24%
Computers 0.12% 0.20% 0.08% 0.08% 0.25% 0.03% 0.09%
Software 0.13% 0.18% 0.07% 0.16% 0.14% 0.04% 0.05%
Residential -1.23% -1.25% -1.08% -0.62% -0.93% -1.04% -1.33%

Soft quarter for investment at least partially due to the widespread recession psychology.

  1Q 4Q 3Q 2Q 1Q 4Q 3Q
  2008 2007 2007 2007 2007 2006 2006
Change in inventories 0.81% -1.79% 0.89% 0.22% -0.65% -1.31% 0.10%
Nonfarm 0.93% -1.69% 0.87% 0.27% -0.69% -1.56% 0.01%
Net exports 0.22% 1.02% 1.38% 1.32% -0.51% 1.25% -0.25%
Exports 0.67% 0.77% 2.10% 0.85% 0.13% 1.51% 0.62%
Goods 0.45% 0.33% 1.96% 0.53% 0.07% 0.73% 0.56%
Services 0.22% 0.45% 0.14% 0.33% 0.05% 0.78% 0.07%
Imports -0.44% 0.24% -0.72% 0.47% -0.63% -0.26% -0.88%
Goods -0.35% 0.39% -0.67% 0.42% -0.57% 0.09% -0.84%
Services -0.09% -0.15% -0.05% 0.05% -0.06% -0.35% -0.03%
Govt. consumption 0.39% 0.38% 0.74% 0.79% -0.09% 0.66% 0.14%
Federal 0.32% 0.04% 0.50% 0.41% -0.46% 0.50% 0.06%
National defense 0.28% -0.03% 0.47% 0.39% -0.54% 0.74% -0.07%
Nondefense 0.04% 0.06% 0.03% 0.02% 0.08% -0.24% 0.14%
State and local 0.07% 0.34% 0.24% 0.37% 0.36% 0.16% 0.08%

Implicit Price Deflators

GDP 2.6% 2.4% 1.0% 2.6% 4.2% 1.7% 2.4%

And higher numbers are in the pipeline as per the PPI and CPI reports.

Gross domestic purchases 3.5% 3.7% 1.7% 3.8% 3.8% 0.1% 2.5%

Not bad.

  1Q 4Q 3Q 2Q 1Q 4Q 3Q
  2008 2007 2007 2007 2007 2006 2006

Price Indexes

GDP 2.6% 2.4% 1.0% 2.6% 4.2% 1.7% 2.4%
YOY percent 2.2% 2.6% 2.4% 2.7% 2.9% 2.7% 3.2%
Personal consumption 3.5% 3.9% 1.8% 4.3% 3.5% -0.9% 2.6%
YOY percent 3.4% 3.4% 2.1% 2.3% 2.3% 1.9% 2.9%

Moving up.

ex food and energy 2.2% 2.5% 2.0% 1.4% 2.4% 1.9% 2.3%
Real final sales 2.7% 2.4% 1.0% 2.7% 4.2% 1.7% 2.3%

Moving up.

Gross domestic purchases 3.5% 3.7% 1.8% 3.8% 3.8% 0.1% 2.5%

Unannualized Quarterly Change

Current GDP 0.8% 0.7% 1.5% 1.6% 1.2% 0.9% 0.9%
Real GDP 0.1% 0.1% 1.2% 0.9% 0.2% 0.5% 0.3%

Seen a lot worse..

Weakness but no recession and even some improvement on the horizon as government and exports pick up the slack from housing and the financial sector.

Employment softer but still reasonably firm by mainstream standards with unemployment at 5%.

Prices continue firm as Saudis continue to hike crude prices, even as other commodities settle down some.

Hence, I see a narrowing output gap and higher prices on the horizon, and Fed rate hikes at least as aggressive as currently priced by the FF futures market.


[top]

2008-05-03 Weekend update (in brief)


[Skip to the end]

2008-05-03 Real GDP

No recession here, and Q1 likely to be revised higher when March trade numbers come out.

Q3 could be 2% depending on the multiplier from the fiscal package, and by Q3 other government spending will be kicking in for the elections and housing is unlikely to be subtracting from GDP. It could even be adding by then.

As suspected, the current weak housing market has been offset by strong exports.

Financial sector losses have nothing to do with GDP unless they somehow reduce aggregate demand.

The prime suspect was the credit channel, but so far the evidence shows only limited damage due to tighter credit conditions, and not the downward spiral feared by the Fed and many other private economists.

2008-05-03 Capacity Utilization, ISM Manufacturing

On the soft side, but no recession.

2008-05-03 Personal Spending, Personal Income

The consumer is muddling through as best as can be expected in an export economy.

2008-05-03 New Home Sales Median Prices, New Home Suppy (Actual Units)

Median prices are soft and may or may not have bottomed, as actual inventories have worked their way down to relatively normal levels for a relatively normal sales pace (which we don’t have yet).

2008-05-03 NAHB Housing Index, NAHB Present Sales Index, NAHB Future Sales Index, Conference Board Home Buying Intentions

The bulk of the adjustment may have been bottoming around October/November.

2008-05-03 Housing Starts, Building Permits

Low starts have reduced supply as builders and buyers remain cautious.

2008-05-03 Government Spending, Government Revenue

Government spending is roaring back and added nicely to Q1 GDP (March print above has timing issues and wasn’t functionally as low as indicated).

Revenue also holding up, indicating no recession yet.

2008-05-03 Export Prices, U. of Michigan 12 Month Inflation Expectations

Every price chart is looking higher, and expectations have elevated, and the Fed keeps cutting rates. Who would’ve thought?

Fisher and Plosser make the mainstream case and are outvoted.

2008-05-03 Employment Cost Index

Wages remain ‘well contained’.

(If you don’t count import prices from China..)

2008-05-03 Import Prices ex. Petro

Globalization is now inflationary.

2008-05-03 U. of Michigan Confidence

All the confidence surveys look about this weak, and at recession type levels, and about 90% of voters think we are in a recession.

American’s aren’t used to an export economy with declining real terms of trade – a mercantilist concept publicly supported by Bernanke and Paulson.

And they don’t seem to like it.


[top]

Current Proposals


Proposals that Happen to Be
within the Mainstream Paradigm

For the Fed:

  1. In general, don’t use the liability (deposit) side of banking as a source of market discipline.
  2. Specifically, eliminate most of the interbank markets by lending directly to US FDIC insured banks vs any/all ‘bank legal’ collateral in any size at the Fed’s target interest rate.
    1. This would reduce domestic FF/LIBOR type spreads to minimal levels, remove bank funding risks, and eliminate the need for the Fed’s TAF and the lending facility.
    2. Banks are already permitted to own only what is permissible by the OCC and other banking law, and fund it with FDIC (government) insured deposits. Therefore, unsecured Fed lending to FDIC insured banks does not add any ‘taxpayer risk’ that the government already accepts and directly manages.

For the Tsy:

  1. Encourage foreign CB’s to re-engage in ‘currency manipulation’ via buying USD to help their exporters.
  2. Encourage monetary authorities to accumulate their reserves in USD financial assets.
  3. Open a securities lending facility that offers all Treasury securities through repurchase agreements to the primary dealers in unlimited quantities at Fed Funds less 0.25%.

For Congress:

  1. Outlaw biofuels – way too dangerous to human life and may already be in the process of killing more humans than WWII.
  2. Manage the output gap with tax cuts or net spending increases.
  3. Stop worrying about US solvency (including solvency of social security).
  4. Use fiscal policy as a tool to meet real economic goals.
  5. Reduce energy consumption by lowering the national speed limit to 30 mph for private motor vehicle transportation over three years:
    1. Reduces driving.
    2. Decreases energy consumption per mile.
    3. Redirects where people live due to the implied price of travel time.
  6. Eliminate tax advantages for savings plans including pensions and individual retirement accounts:
    1. Savings does not function to fund investment.
    2. There are other viable options to having individual savers and money managers directing real investment.
    3. Outlaw passive commodity strategies for existing pension and retirement funds.
  7. Eliminate income taxes and use a national real estate tax to anchor the currency
    1. I estimate compliance costs at up to 15% of GDP.
    2. Compliance issues reward, encourage, and promote a culture of cheating that extends to all law.
    3. The infrastructure is already in place at the local level for a national real estate tax:
      1. Compliance and legal costs are minimal.
      2. The tax rates can be progressive based on values, efficiency, and other standards that advance public purpose.
    4. Use luxury taxes to moderate consumption that is outside of public purpose:
      1. These taxes function to reduce consumption.
      2. The success of these taxes is judged by how little they collect and thereby serve to reduce the targeted consumption.
  8. Eliminate sales taxes and other remaining transactions taxes as these function as internal tariffs:
    1. Transactions taxes work against internal comparative advantage.
    2. Transactions taxes work against specialization of labor.
  9. Legalize all recreational drugs:
    1. Takes the money out of illegal trafficking.
    2. Eliminates drug-related violence.
    3. Moves the social issue from the police to the churches.
  10. Do not allow healthcare costs to continue as a marginal cost of production (business should not fund healthcare, government should):
    1. Distorts pricing and optimal resource utilization.
    2. Workers do not tend to be less healthy than unemployed people.

Proposals that May Be
a Bit Outside of the Mainstream Paradigm

Offer a national service job to anyone willing and able to work which lets the market determine the budget deficit:

  1. An employed bufferstock is a more effective price anchor than today’s bufferstock of unemployed.
  2. Adds to useful output.
  3. Reduces real costs of negative social issues.
  4. Acts as a countercyclical fiscal ‘stabilizer’.

Drop the Fed Funds rate to zero and leave it there permanently:

  1. Inflation is not a function of the nominal rate set by the Fed.
  2. Output and employment is not a function of interest rates.
  3. Nominal interest rates support the rentier class and thereby reduce real output at the expense of those working.

2008-04-25 Valance Chart Review

Twin themes remain:

  • Weakening demand continues from Q2 2006
  • Price indexes continue higher as Saudis continue to hike prices and let quantity adjust
  • Markets are pricing in the end of Fed Funds cuts due to diminished systemic deflationary risk and escalating inflation readings.

    2008-04-25 Capacity Utilization, ISM Manufacturing

    Down, but not out.

    2008-04-25 ISM Non-Manufacturing, Empire Manufacturing Index

    Most surveys are still trending down but not in collapse.

    2008-04-25 Philly Fed Index Deliveries, Chicago PMI Deliveries, ISM Non-Manufacturing Deliveries, ISM Manufacturing Deliveries

    Actual deliveries still on the low side but exceeding expectations.

    2008-04-25 Retail Sales, Retail Sales ex. Autos, Total Vehicle Sales, Redbook Retail Sales

    Weak but could be worse. Looking more and more like an export economy.

    2008-04-25 Non-farm Payrolls, Average Hourly Earnings

    A weak first quarter for payrolls but above previous recession levels.

    2008-04-25 Total Hours Worked, Labor Participation Rate, Duration of Unemployment, Household Job Growth

    Weakness, but not all that bad yet, and jobless claims fell again last week.

    2008-04-25 Conf. Board of Business Conditions Good, Bad

    These kinds of surveys still looking very negative.

    2008-04-25 NAHB Housing Index, NAHB Present Sales Index, NAHB Future Sales Index, Conference Board Home Buying Intentions

    2008-04-25 Housing Affordability, Pending Home Sales

    Housing may have stopped subtracting from GDP as of Q2.

    2008-04-25 MBA Mortgage Applications, Quarterly OFHEO Home Prices, Monthly OFHEO Home Prices

    Applications may be turning up after a slow Q1. Some signs home prices are stabilizing as well.

    2008-04-25 Home Ownership, Rental Vacancy

    Low rental vacancies might support rent increases and the OER calculation in CPI.

    Low home ownership due to negative sentiment means pent up buying demand.

    2008-04-25 Corporate Debt, Household Debt, Consumer Credit, Mortgage Debt

    Households are recharging their debt batteries?

    2008-04-25 Fiscal Balance, Government Public Debt, Government Spending, Government Revenue

    Net Federal spending on the rise this year, with fiscal package kicking in next week.

    March government spending was down due to a timing issue – expect a strong increase in the June report.

    Revenues muddling through at better than recession levels.

    2008-04-25 CPI, Core CPI, PCE Price Index, Core PCE

    2008-04-25 PPI, Core PPI, Import Prices, Import Prices ex. Petro

    2008-04-25 Empire Prices Paid, Empire Prices Rcvd, Philly Fed Prices Paid, Philly Prices Rcvd

    2008-04-25 Gold, Silver, Copper, Iron & Steel Scrap Prices

    2008-04-25 Export Prices, U. of Mich 12 Month Inflation Expectations, CRB Index, Saudi Crude Production

    Inflation is ripping, and we will see next week if the Fed finally considers it the greater risk.

    Many in the mainstream have thought it the greater risk all along with only the threat of catastrophic systemic deflationary risk due to ‘market functioning’ possibly the greater risk.

    With the fear of catastrophic systemic risk fading and the Fed Funds rate below most inflation measures, markets have priced in a higher chance of the Fed not cutting the Fed Funds rate.

    Saudi production remains firm at current prices; so, I expect more hikes.

    2008-04-25 ABC Consumer Confidence, ABC Economic Component

    2008-04-25 U. of Michigan Confidence, U. of Michigan Conf. Current

    Confidence remains very low, as the realities of an export economy and reduced real terms of trade hurt the lower income groups disproportionately.

    2008-04-25 10Y Tips

    Tips are starting to discount higher real rates from the Fed.

    2008-04-25 Trade Weighted Dollar

    The dollar continues under pressure.

    Without the support of the CBs and Monetary authorities, it may continue lower until the US trade gap narrows substantially.

FT: US credit rating under threat

Seems no end to the stupidity that continues to spew out from all kinds of places.

You’d think the ratings agencies would have learned their lesson with Japan – downgraded below Botswana and still funded JGB’s at under 1% for years until the BOJ raised rates.

And last I saw ten year US credit default was around ten basis points?

I had a discussion with S&P years ago. Seem to remember a name ‘David’?

He seemed to sort of grasp that operationally governments with their own (non convertible) currencies and floating fx policies aren’t revenue constrained, but obviously didn’t quite get it when they downgraded Japan.

The eurozone is another issue, where they have downgraded national governments and that does mean something regarding risk, just like the US States, but with no legal safety net by the Federal authorities like the US. Fortunately the eurozone banking system hasn’t been tested, yet.

Simple trade: sell US credit default, buy Germany, for example.

US credit rating under threat

by Aline van Duyn

The US government’s need to provide financial backing to the state-sponsored mortgage financiers that dominate the US housing market could pose a risk to the country’s triple-A credit rating, Standard & Poor’s, the credit rating agency, said on Monday.

In the event of a deep and prolonged US recession, S&P said the potential costs of propping up government-sponsored enterprises (GSEs) like Fannie Mae and Freddie Mac, which have implicit government backing, could cost the US government up to 10 per cent of GDP.

The costs of supporting broker-dealers like Bear Stearns in a dire economic situation would be much lower, at below 3 per cent of GDP, S&P said.

“The size of GSEs, coupled with their current level of common equity, could create a material fiscal burden to the government that would lead to downward pressure on its rating,” the S&P report said.

The S&P comments come amid increased pressure for better regulation of the mortgage financiers, especially as their role in the US housing market is likely to increase as they are used to provide support for struggling homeowners.

Policymakers are pushing for Fannie Mae, Freddie Mac and the lesser-known Federal Home Loan Banks to pump liquidity into the US mortgage market and this has prompted regulators to call for stronger oversight of such institutions.

Fannie Mae, Freddie Mac and the Federal Home Loan Banks have become the backbone of the troubled US mortgage market as purely private sources of finance have all but dried up or are offered only at punitive terms.

In the second half of 2007, about 90 per cent of new mortgage funding was provided by GSEs. They have about $6,300bn of public debt and mortgage securities outstanding, more than the $5,100bn of outstanding US government debt.

Fannie Mae and Freddie Mac have no formal state guarantees but investors believe the US government would step in if the system got into trouble. This allows the agencies to raise funds at very low rates against a triple-A credit rating, in spite of high levels of leverage.

The capital surplus ratio for GSEs was recently reduced to 20 per cent from 30 per cent, allowing them to operate on a more leveraged basis.

In January, Moody’s Investors Service, another credit rating agency, said the US could risk its triple-A rating within a decade unless soaring healthcare costs and social security spending was curbed.

Money (USD)

My take on the USD:

It was at a level based on foreigners wanting to accumulate $70 billion per month which also = the US trade gap (accounting identity).

Most of that desire to accumulate came from foreign CBs trying to support their exporters, oil producers accumulating USD financial assets, and foreign portfolios allocating some percentage of assets to USD assets.

Paulson cut off the CBs calling the currency manipulators and outlaws.

Bush cut off the oil producers by being perceived to be conducting a holy war.

Bernanke scared off the portfolio managers with what looks to them like an ‘inflate your way out of debt’ policy.

And US pension funds are diversifying out of USD into passive commodities and foreign securities.  Looks to me like the desire to accumulate USD overseas is falling towards zero rapidly.

This means they sell us less and buy more of our goods, services, and our real assets.

Volumes’ of non oil imports are falling and of oil imports are flat.

The dollar has gotten low enough for the trade gap to fall from over $70 billion to under $60 billion per month (February was an aberration IMHO).

The dollar will ‘adjust’ until it corresponds with a trade gap that = desired foreign accumulation of USD financial assets.

I see no reason to think the trade gap should not go to zero.

The USD probably has not traded down enough to reflect the zero desire to accumulate USD abroad.

The ECB has serious ideological issues regarding buying of USD.  Not the least of which they don’t want to give the impression that the USD is ‘backing’ the euro, which would be the appearance if they collected USD reserves.

The ECB has an inflation problem, and they believe the strong euro has kept it from being much worse.

The policy ‘shift’ might be the process of ending of US rate cuts at the next meeting by cutting less than expected.

This might first mean only a 25 basis point cut when the market prices in 50 basis points, followed by no cut when markets price in 25 basis points, for example.

This would firm the USD and soften the commodities near term, as after the last 75 basis point cut when markets were pricing 100 basis points.

But this does not change the foreign desires to accumulate USD as direct intervention by the ECB would, for example.

So the adjustment process that gets us to a zero trade gap will continue.

And it will continue to drive up headline CPI with core not far behind.

And US GDP will muddle through in the 0% to +2% range with weak private sector consumption being supported by exports, US government consumption, and moderate investment.