2009-05-12 USER


[Skip to the end]


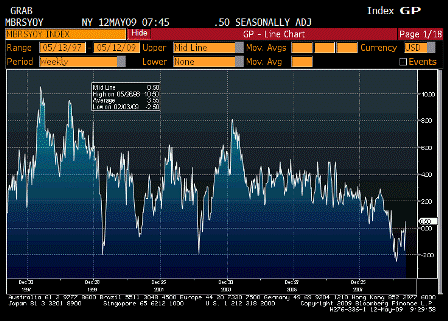
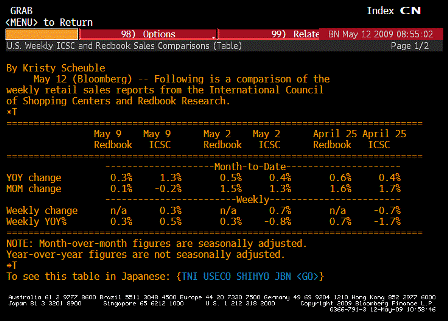
ICSC UBS Store Sales YoY (May 12)

Survey n/a
Actual 0.5%
Prior -0.8%
Revised n/a

[top][end]

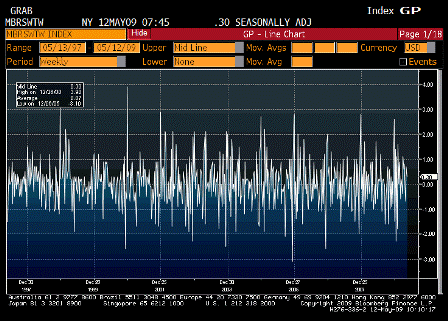
ICSC UBS Store Sales WoW (May 12)

Survey n/a
Actual 0.3%
Prior 0.7%
Revised n/a

[top][end]

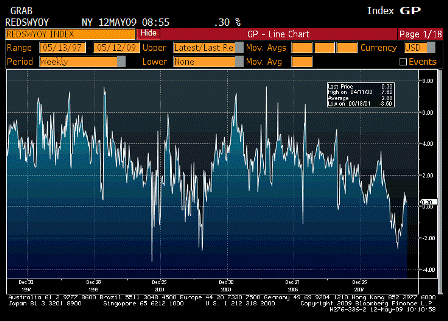
Redbook Store Sales Weekly YoY (May 12)

Survey n/a
Actual 0.3%
Prior 0.3%
Revised n/a

[top][end]

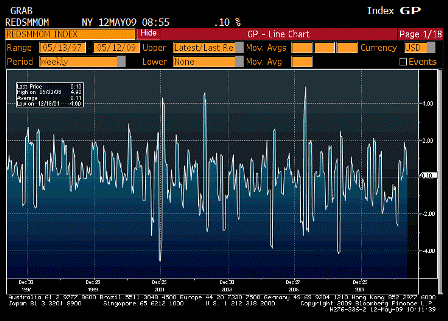
Redbook Store Sales MoM (May 12)

Survey n/a
Actual 0.1%
Prior 1.5%
Revised n/a

[top][end]

ICSC UBS Redbook Comparison TABLE (May 12)
[top][end]


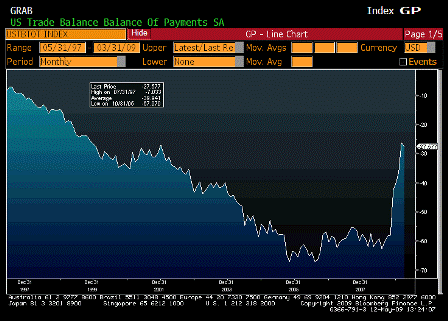
Trade Balance (Mar)

Survey -$29.0B
Actual -$27.6B
Prior -$26.0B
Revised -$26.1B

[top][end]

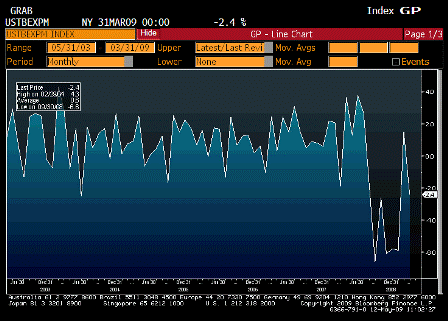
Exports MoM (Mar)

Survey n/a
Actual -2.4%
Prior 1.5%
Revised n/a

[top][end]

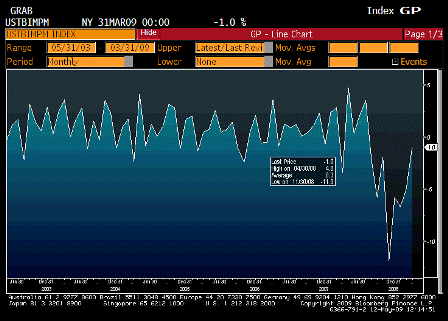
Imports MoM (Mar)

Survey n/a
Actual -1.0%
Prior -5.1%
Revised n/a

[top][end]

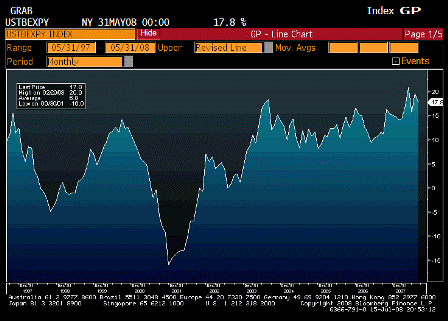
Exports YoY (Mar)

Survey n/a
Actual -17.0%
Prior -17.4%
Revised n/a

[top][end]

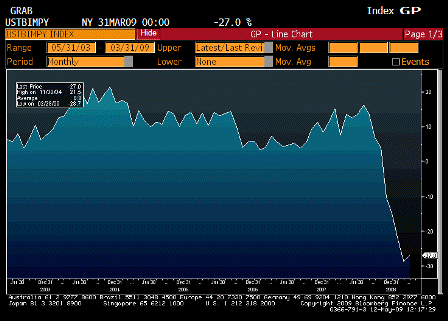
Imports YoY (Mar)

Survey n/a
Actual -27.0%
Prior -28.7%
Revised n/a

[top][end]

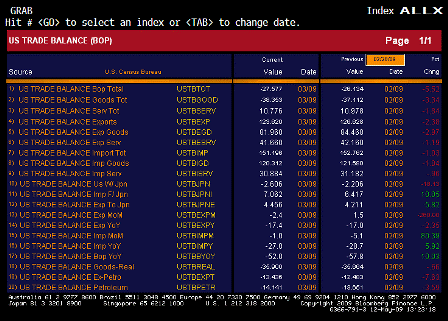
Trade Balance ALLX (Mar)

[top][end]


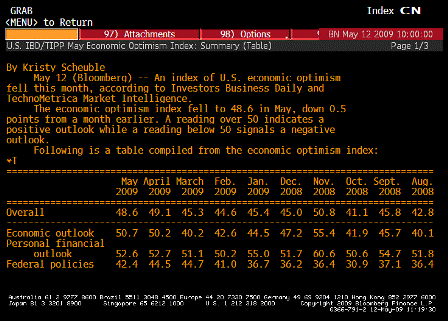
IBD TIPP Economic Optimism (May)

Survey 51.0
Actual 48.6
Prior 49.1
Revised n/a

[top][end]


Monthly Budget Statement (-)

Survey
Actual
Prior
Revised

[top][end]

Monthly Budget Statement ALLX (-)


[top]

ICSC Survey


[Skip to the end]

Karim writes:

The ICSC weekly chain store sales index was unchanged for the week ending May 24 compared with the prior week and rose by 1.5% from the same week of the prior year–steady with the prior week. The ABC News/Washington Post Consumer Comfort Survey for the period ending May 25 continued to show a record low buying climate evaluation by consumers (for two consecutive weeks) with 81% of respondents calling it a bad time to spend money.

ICSC Research’s statistical analysis (combined with the consumer survey result) suggests that the record high gasoline prices at the pump are dragging down chain-store sales demand by nearly 1 percentage point currently, while the lift so far from higher income, because of the federal tax rebate, is only offsetting that spending drag by about a quarter of percentage point. As such, the net effect (approximately -0.75 pp.) continues to be negative on store spending. April chain store sales on a year-over-year comparable-store basis rose by 3.5%, based on ICSC’s tally of retail chains. However, the April 2008 increase was exaggerated by the shift in the date of Easter compared with April 2007. Over the prior two months, the average monthly year-over-year pace was 1.5%.

Yes, the key is whether the oil producers ‘spend’ the funds here or ‘save’ them and build reserves as they did in the 1970’s.

So far the booming US exports and annecdotal evidence of massive infrastructure expenditures in the middle east indicate they have been spending their higher revenues and sustaining US GDP at muddling through levels.

This means employment and growth muddle through but real terms of trade and our standard of living declines

As of May 23, 43% of the $107 bn. personal federal tax rebate already has been distributed to taxpayers, which should begin to turn the consumer spending tide a bit. In a special consumer tracking survey taken between May 22 and 25, 12% of households reported spending most of the rebate already. Based on the latest tax rebate flow that would imply approximately $5 to $10 bn. of the rebate was spent already by the 51.7 million taxpayers receiving a rebate check so far.

According to an ICSC Research tax rebate survey, released on May 19, ultimately 22% of households expect to spend the rebate, which will potentially mean nearly $25 bn of spending power over the next several months. For the fiscal month of May, ICSC Research expects monthly sales will grow by between 1% and 2% on a year-over-year same-store basis.

My best guess is more will be spent with a relatively short lag of maybe 30 days after receiving the checks. This includes using the checks to make down payments on deferred purchases, such as small appliances and home improvements, which has a multiplier effect.


[top]

Reuters: ICSC chain store sales

TABLE-US chain store sales fell 0.2 pct last week-ICSC

Tue May 6, 2008 7:45am EDT


NEW YORK, May 6 (Reuters) – The International Council ofShopping Centers and UBS Securities on Tuesday released the following seasonally adjusted weekly data on U.S. chain store retail sales.

WEEK ENDING INDEX 1977=100 YEAR/YEAR CHANGE (%) WEEKLY CHANGE (%)
May 3 495.4 2.3 -0.2
April 26 496.3 1.9 0.9
April 19 491.8 1.4 -0.7
April 12 495.3 1.8 0.9

The ICSC-UBS weekly U.S. retail chain store sales index is ajoint publication between ICSC and UBS Securities LLC. It measures nominal same-store sales, excluding restaurant and vehicle demand, and represents about 75 retail chain stores.

Muddling through like most export economies.

Year over year looks okay.