A number of people have inquired about this morning’s front page article in the WSJ by Jon Hilsenrath, “Fed Maps Exit from Stimulus.”
This seems constructed by Jon in a way that is very much reminiscent of the three-day inflation scare and talk of early exit he created last year. Note four points:
1. Jon does not have access to policy makers in the way the WSJ beat reporter once had. The days of Wessel and Ip are over. Bernanke was very reluctant to provide informal guidance to begin with, and the practice virtually ceased with the report of the Subcommittee on Communications at the beginning of last year. Essentially, they decided to speak authoritatively in FOMC statements and everyone was free to offer their own view in the public record after that, but not off camera.
2. The first two paragraphs are an extended, bloated, version of the single sentence in the statement that said “The Committee is prepared to increase or reduce the pace of its purchases to maintain appropriate policy accommodation as the outlook for the labor market or inflation changes.” Those paragraphs don’t say anything more than the Fed has a plan to do its job. This reminds me of the CNBC banner yesterday morning while Bernanke was giving his speech on financial stability. It said “BREAKING NEWS: THE FED IS MONITORING FINANCIAL STABILITY.” It would have been just as informative to run the banner “BREAKING NEWS: THE FED IS STILL IN BUSINESS.”
3. Note that the only two on-the-record, active voices are Charlie Plosser and Richard Fisher. Those two are probably last on the list of reliable co-conspirators for the core of the Committee that makes policy. But those quotes, plus the older Williams’ one, allows Jon to write “Fed officials” to make it sound like he has access to the second floor of the Board. It also lets him bring out the stale dealers survey.
4. Note the inconsistencies in the story. Fed officials want to put more volatility in the market by conveying that QE is a flexible, smoothly adjusting instrument. The problem is that this makes more sense if the effect of QE was on flows, not stocks, which they have studiously denied for four years. By the way, if those conspiring officials want to make clear it won’t be a slow, steady retreat of accommodation, than they better tell Janet Yellen to stop showing the optimal policy path. Good luck to that.
I believe the central message, which is what I have described in earlier notes: Fed officials want to put as much volatility as possible back into the market before starting to raise rates, provided financial conditions otherwise remain supportive to sustained expansion. They’ll take opportunities to do so on the back of an equity market rally. But Jon Hilsenrath is not the means they will do so.
Vincent
Karim writes:
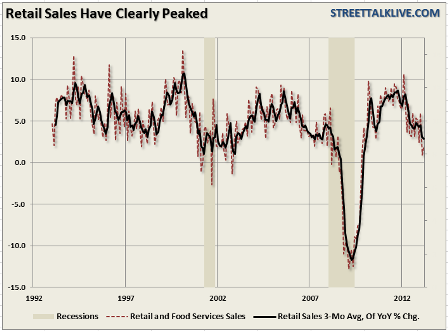
RETAIL SALES
- April retail Sales were strong both in terms of the actual advance and composition. Moreover upward revisions to the control group for Feb and March imply an upward revision to Q1 GDP from 2.5% to 2.8%.
- The 0.5% advance in the control group for April was more impressive due to the breadth and composition of the gains. In particular, all the major discretionary spending categories were quite strong: electronics 0.8%, clothing/accessories 1.2%, sporting goods 0.5% and restaurants 0.8%.
- As the chief economist of the ISCS commented the other day on chain store sales for April: It is most likely being boosted by a stronger household wealth effect from higher home and stock market prices. Although it was an improvement of recent months, the pace was still dampened by adverse seasonal weather,
- With fiscal drag peaking this quarter, and private sector growth maintaining the momentum it has shown since Q4 of last year, its making 3-3.5% growth more plausible in the second half. Most dealer forecasts are still in the 2-2.25% area.
HILSENRATH
- Technically, Reinhart is correct: Hilsenrath is not the mouthpiece for the Fed and this is not all new news.
- But, he is piecing together a story that the Fed wants out there. That the last hiking cycle was too predictable in terms of both pace and size (25bps/meeting). So, the idea that they can taper a bit and skip a meeting; or taper a bit and taper at a greater pace at the next meeting, are ideas they probably want out there.
- My guess is Bernanke outlines these concepts in greater detail next week at his JEC testimony (May 22) and that if we get another 175k or greater in private payroll growth plus another strong month in retail sales for May, we could see some tapering at the June meeting.
- Also notable was Bernanke’s comment on Friday that the Fed is ‘looking closely for signs of excessive risk taking”.