Trade, Atlanta Fed, Redbook sales

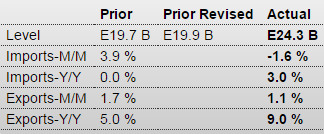
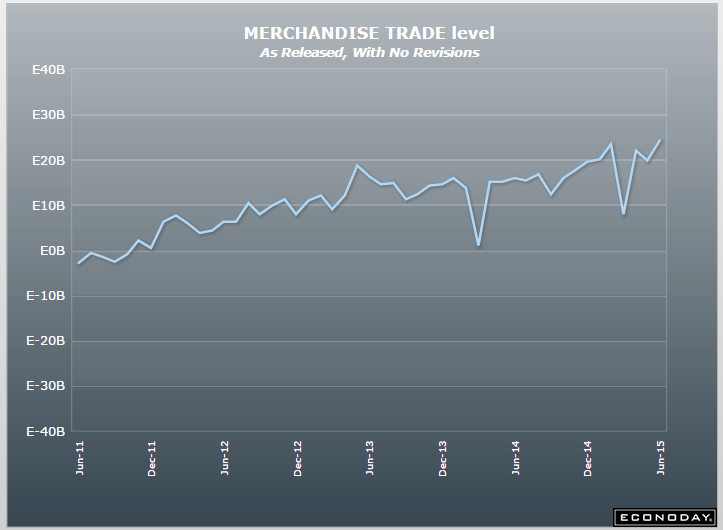
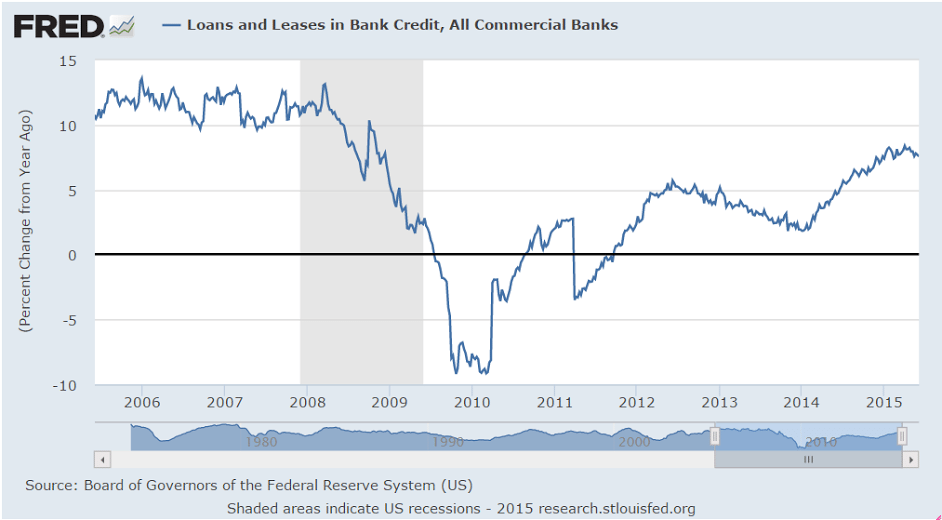
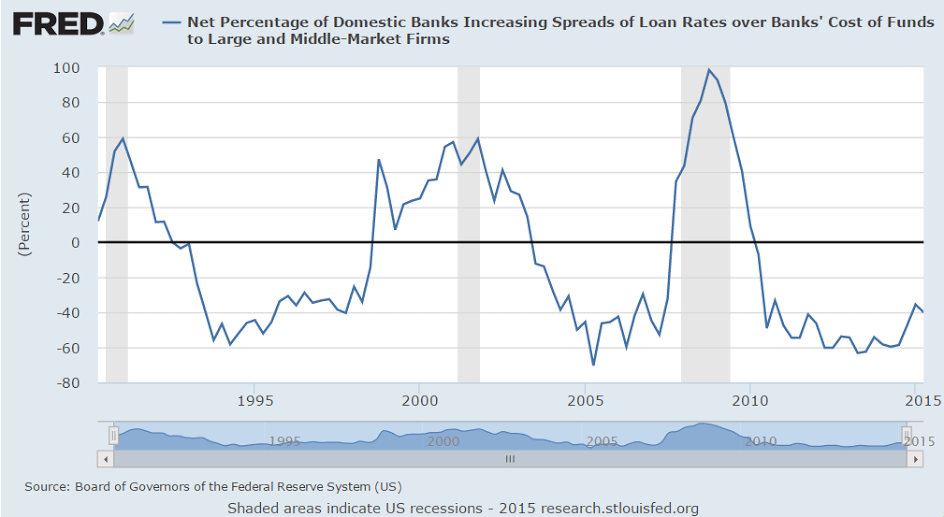
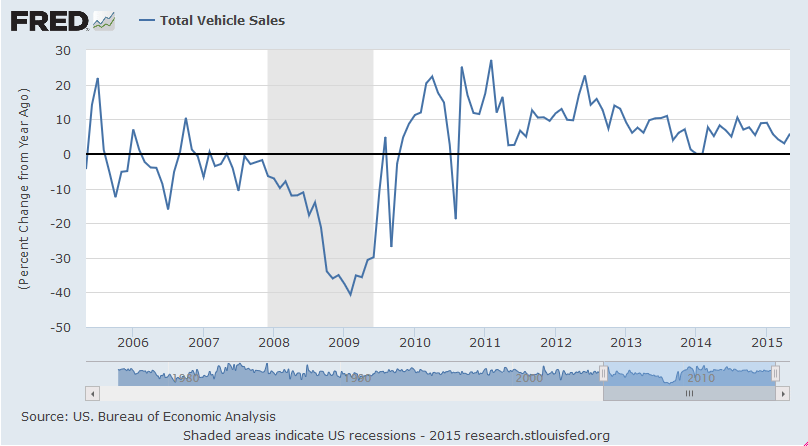
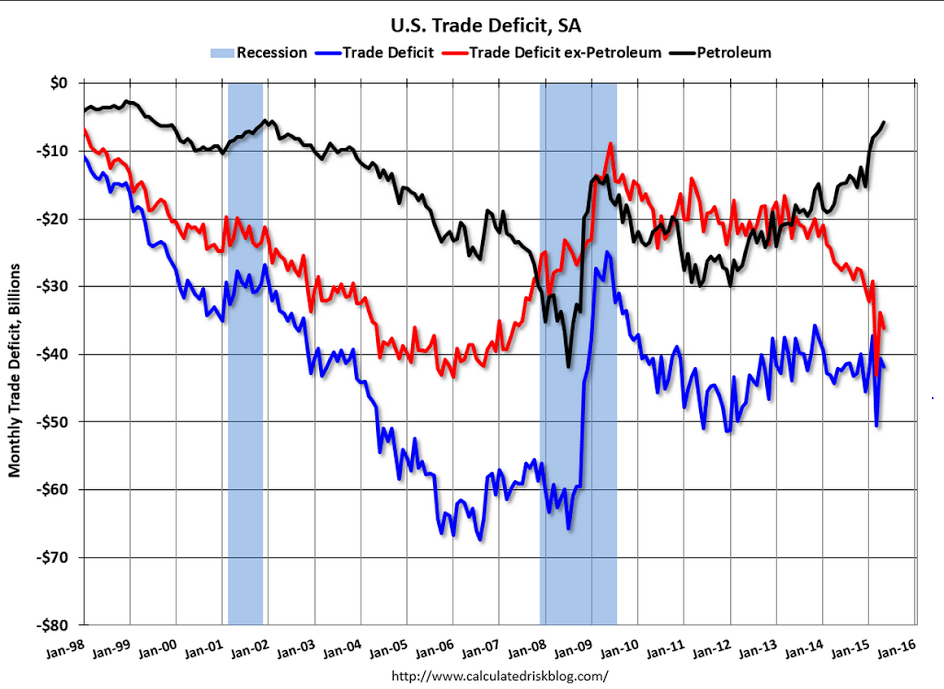
Trade deficit a bit higher but looks to me like more to come, including revisions. The petroleum gap is set to widen as US production begins to decline and is replaced by imports. And to my prior point, auto imports were up. And further note that global reductions in trade are associated with recessions:

International Trade
er-7-7-1
Highlights
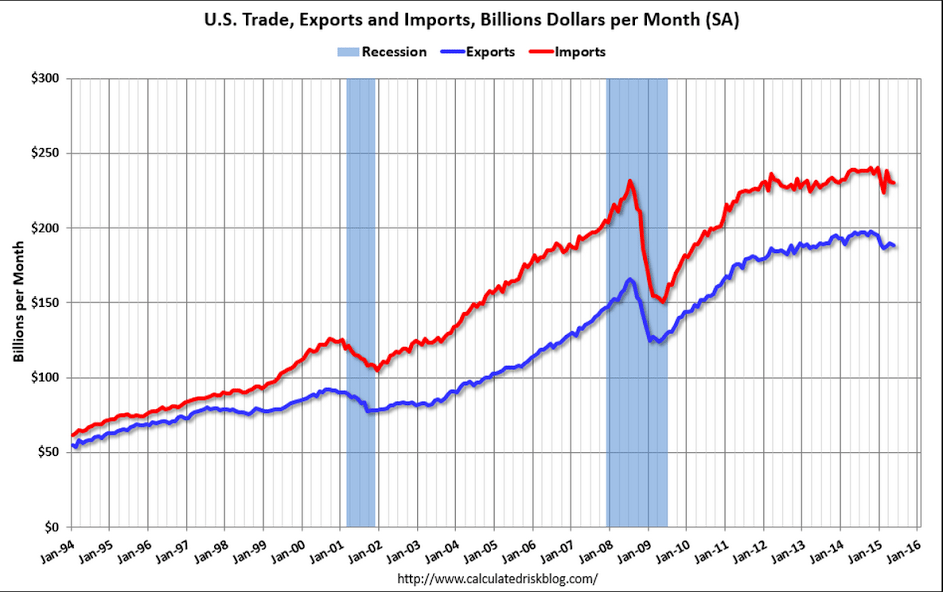
The nation’s trade gap came in near expectations in May at $41.9 billion, wider than April’s revised gap of $40.7 billion. The goods gap rose by a net $1.2 billion to $61.5 billion, offset in part by a fractionally wider services surplus of $19.6 billion. The petroleum gap narrowed $1.0 billion to $5.8 billion which, reflecting rising domestic oil output together with rising exports of refined products, is the lowest since February 2002.

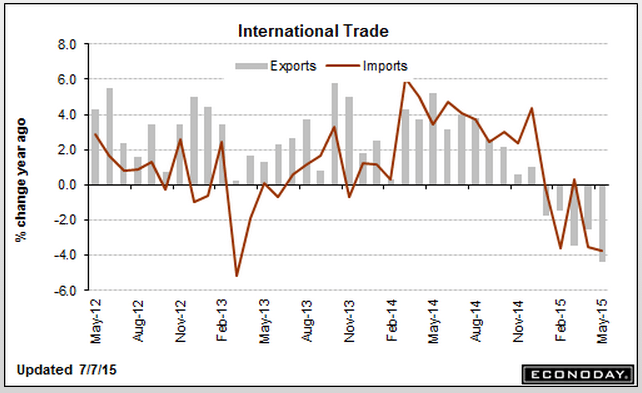
Exports, which have been pressured by strength in the dollar, fell $1.5 billion to $188.6 billion in May reflecting a $2.4 billion downswing for capital goods and, within this reading, a $1.2 billion downswing in aircraft exports. Exports of nonmonetary gold fell $0.5 billion in the month.

Imports were also down, $0.3 billion lower to $230.5 billion including a $0.8 billion decline in capital goods. Imports of industrial supplies fell $0.6 billion within which imports of crude oil fell $0.4 billion. The decline in crude imports comes despite a more than $4 rise in prices to $50.76 per barrel. Imports of autos rose $0.9 billion in the month.

By country, the gap with China rose $4.0 billion to $30.5 billion with the EU gap down $0.8 billion to $12.5 billion. The gap with Japan narrowed $1.8 billion to $5.2 billion while the gap with Mexico widened slightly to $4.6 billion in the month. And for the first time since 1990, the nation posted a monthly surplus with Canada, at $0.6 billion.

The decline in goods exports is a major concern for the manufacturing sector which is struggling right now with weak foreign demand. The May gap is in line with trend and is not likely to affect GDP estimates.
er-7-7-2
er-7-7-3
er-7-7-4

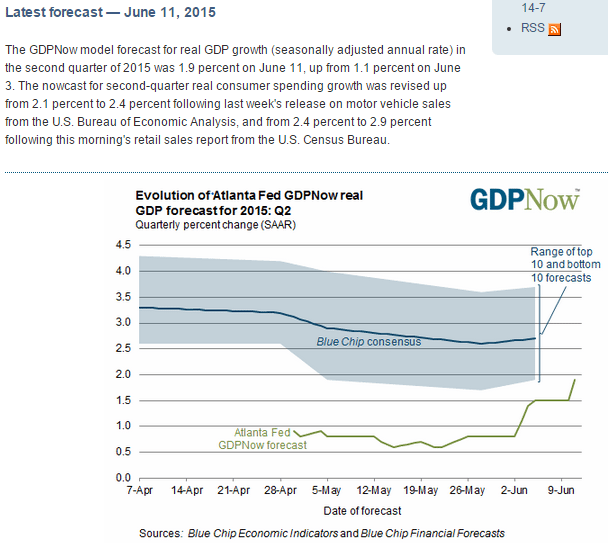
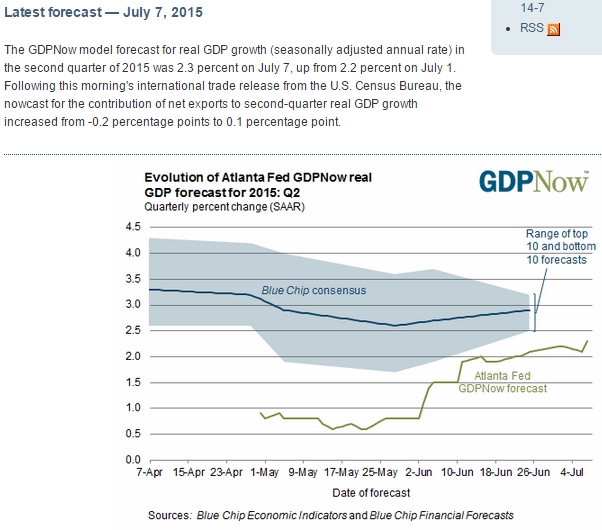
An uptick to 2.3% based on today’s trade report for May. The first Q2 GDP estimate will be out later this month, and will include an estimate for June trade which won’t come out until the first revision for Q2 GDP comes out:
er-7-7-5
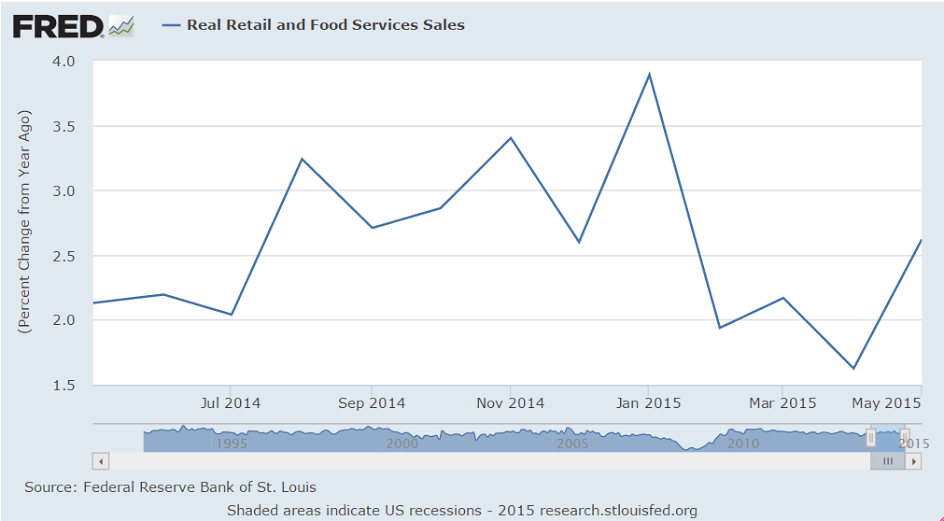
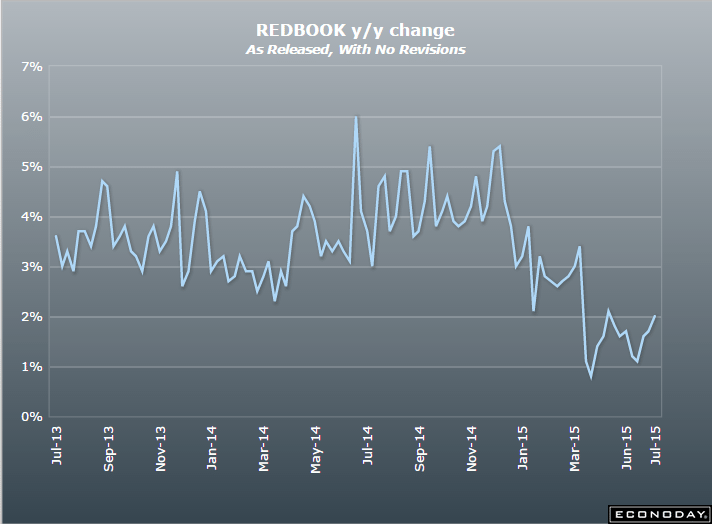
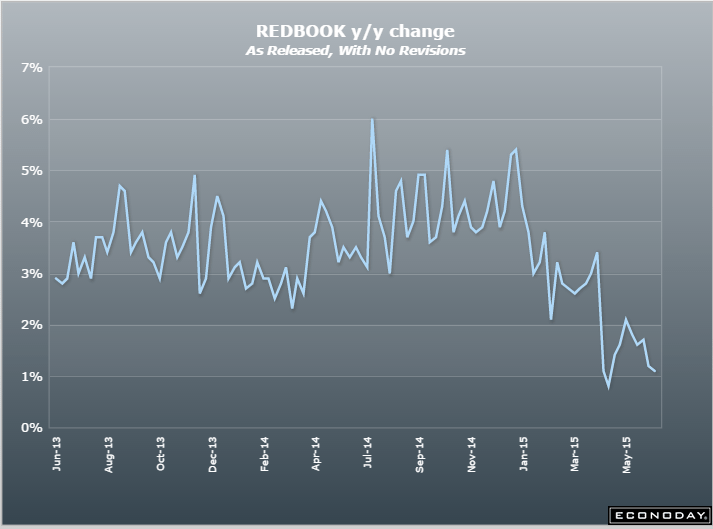
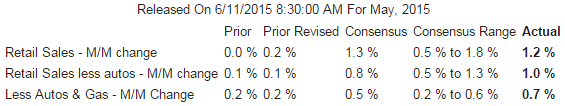
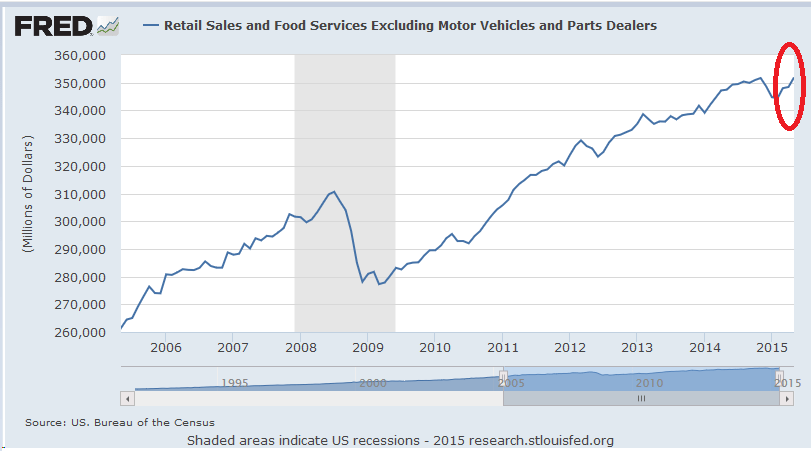
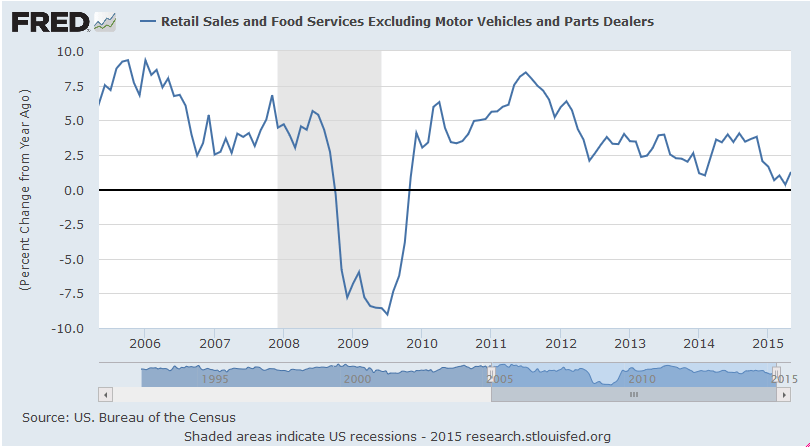
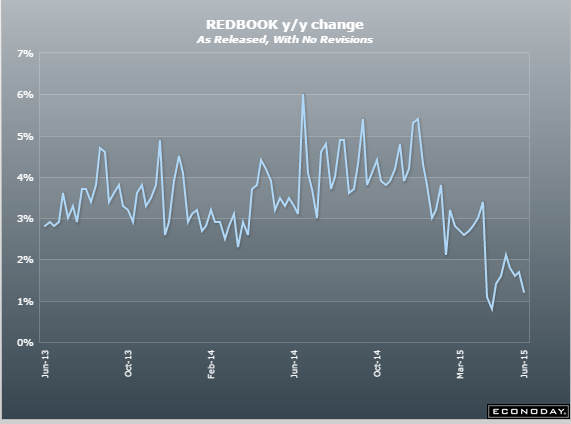
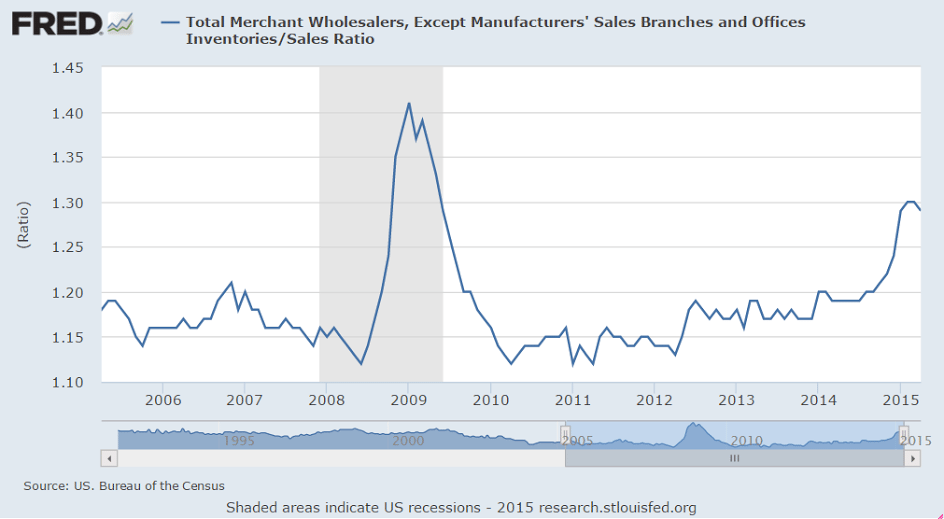
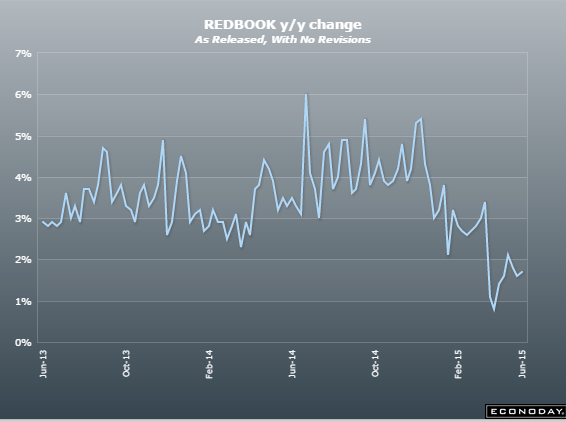
This minor indicator remains depressed, as do other retail sales indicators:

Redbook
er-7-7-6
Highlights
Hot weather triggered demand for seasonal goods in the July 4 week, helping to boost Redbook’s same-store year-on-year sales index by 3 tenths to plus 2.0 percent. But the reading is still soft and does not point to strength for the government’s core retail sales reading (ex-auto ex-gas). May was a very strong month for retail sales which, however, appear to have edged lower since.
er-7-7-7
er-7-7-8

Redbook retail sales, Chicago PMI, CS house price index, consumer confidence

This measure of retail sales remains surprising depressed, even to me:

United States : Redbook
er-6-30-1
Highlights
Redbook’s sample continues to report stubbornly low sales rates, at a same-store year-on-year plus 1.7 percent in the June 27 week. Month-over-month, Redbook’s call is a sharp 1.5 percent contraction for June in what is a negative signal for the government’s core ex-auto ex-gas reading. The report says sales following Father’s Day were depressed though retailers expect to see strength going into the July 4 holiday. This report, which first swung lower in March, did not pick up the strength in May and is not likely to shape forecasts for June.
er-6-30-2

And another bad one:

Chicago PMI
er-6-30-3
Highlights
Chicago’s PMI sample remains surprisingly depressed, at a June index of 49.4 which is noticeably below the Econoday consensus for 50.6. June is the 4th contractionary reading (sub-50) of the last five months.

The sample’s employment is the lowest since November 2009 with backlog orders the lowest since September 2009. Note that weakness in backlogs is a clear negative for future employment. Production, like the main index, is in contraction for the 4th time in five months.

But leading the positive side of the report are new orders which are now back above 50. And in a special question, respondents are cautiously optimistic that new orders will begin to pick up in the third quarter
er-6-30-4

Also below expectations and decelerating:

S&P Case-Shiller HPI
er-6-30-5
Highlights
Growth in home prices slowed sharply in April, up only 0.3 percent for Case-Shiller’s 20-city index which is 5 tenths below Econoday’s consensus and 2 tenths below the low forecast. The year-on-year rate, at plus 4.9 percent, is 5 tenths below the consensus and 1 tenth above the low end.

For the first time since all the way back in September, minus signs suddenly appear on the city breakdown list with 8 of 20 cities showing contraction in April. Cleveland shows the sharpest monthly contraction at minus 0.5 percent followed by Atlanta and Chicago at minus 0.4 percent each.

But several on the plus side show significant strength led by Minneapolis at a monthly plus 1.0 percent followed by Denver, Detroit and Las Vegas at plus 0.9 percent. Year-on-year, Denver and San Francisco lead the list at plus 10.3 and 10.0 percent with Dallas in third at plus 8.8 percent. Those showing the least year-on-year growth are Washington DC at plus 1.1 percent, Cleveland at plus 1.3 percent, and Boston at plus 1.8 percent.

But weakness in this report, where monthly readings are actually 3-month averages, reflects the weak sales conditions in the early part of the year, conditions which reversed strongly in May and which point to price strength for the May edition of this report. The next hard data on housing will be construction spending on tomorrow’s calendar.
er-6-30-6

Nice pick up in confidence to get back towards Q1 levels:
er-6-30-7

Housing Starts, Redbook retail sales, EU merchandise trade, Russia comment, California real estate licensees

The good news here is that last month was up more than expected, and permits were up as well. Lots of cheer leading on this one, and the upward revision of last month’s report ups Q2 GDP estimates a tad, but a quick look at the charts tells me that so far it was a blip up last month from a prior dip, and now back to where it’s been, and longer term it’s still extremely depressed and no longer the large % of GDP it used to be, and growing only very slowly at best. Also, the latest move up in mortgage rates was caused by market anticipation of Fed hikes, and was not demand driven, so if anything it’s likely to slow sales once the pre hike mini surge in borrowing abates, as the credit numbers show has already happened.

Housing Starts
er-6-16-1
Highlights
Don’t let the headline fool you, the housing starts & permits report points to solid strength for the housing sector. Starts came in at a 1.036 million rate in May which is down 11.1 percent from the April rate but the April rate, which was already one for the record books, is now revised higher to 1.165 million for, and this is no misprint, a 22.1 percent gain from March. Sealing matters is another gigantic surge in permits, up 11.8 percent to 1.275 million following a 9.8 percent gain in April. Forecasters will be revising their second-quarter GDP estimates higher following today’s report, not to mention their estimates for Thursday’s index of leading economic indicators where permits are one of the components.

Permits are the leading indicator in the report and the latest rate is the best since way back in August 2007. The gain is centered in the Northeast followed by the Midwest. Turning to starts, the monthly step back is split between all regions with the Northeast, in contrast to permits, showing the largest percentage decrease.

The housing sector is moving to the top of the economy, just as many suspected following a first quarter that was depressed by heavy weather. Watch tomorrow for descriptions of the housing sector in the FOMC statement and also Janet Yellen’s comments at her press conference.

er-6-16-2
er-6-16-3
er-6-16-4
er-6-16-5
er-6-16-6
er-6-16-7
er-6-16-8

Permits spiked up, but spikes like this have always been followed by spikes down, and sometimes worse:
er-6-16-9
Still stone cold dead for all practical purposes:
er-6-16-10

This is very strong euro stuff that will put upward pressure on the euro until this surplus goes away as it weakens the economy and brings on the next major euro crisis:

European Union : Merchandise Trade
er-6-16-12
Highlights
The seasonally adjusted trade balance returned a record E24.3 billion surplus in April following a marginally larger revised E19.9 billion excess in March. Unadjusted the surplus was E24.9 billion, up some E10.0 billion from a year ago.

The monthly jump in the adjusted black ink reflected a combination of stronger exports and weaker imports. The former posted a 1.1 percent monthly rise, their third consecutive increase, to stand 9.0 percent above their level a year ago. Imports on the other hand were down 1.6 percent versus March and reversed much of that period’s advance. Even so, annual import growth accelerated to 3.0 percent.

The April data put the trade surplus more than 13 percent above its first quarter mean when total net exports subtracted 0.2 percentage points from the quarterly change in total output. Although volatile energy prices mask underlying volume trends the omens are good for a positive contribution from the external sector this quarter.
er-6-16-13

Russia: President Vladimir Putin said his country would be bulking up its nuclear arsenal in the coming year. Speaking at a military and arms fair, Putin announced that, “More than 40 new intercontinental ballistic missiles able to overcome even the most technically advanced anti-missile defense systems will be added to the make-up of the nuclear arsenal this year.”

The announcement comes a day after Russia denounced a U.S. plan to move tanks and heavy weapons to the Russian border in support of its NATO allies. “The feeling is that our colleagues from NATO countries are pushing us into an arms race,” Anatoly Antonov, Russia’s deputy defense minister, reportedly told RIA news agency.

er-6-16-14

EU Industrial Production, Credit Check, Atlanta Fed

Even with increasing net exports, over all GDP isn’t benefiting all that much, as fiscal policy and structural reforms that assist exports do so by restricting incomes and domestic demand to achieve ‘competitiveness’. Additionally, negative rates and QE remove some interest income from the economy, which also restricts domestic demand to some degree. And, ironically, the subsequent current account surplus puts upward pressure on the euro until there are no net exports, obviating the efforts and sacrifices that went into achieving the competitiveness. Further note that a Greek default, for example, fundamentally removes net euro financial assets from the economy, further tightening the euro, as Greek debt is nothing more than bank deposits in the ECB system:

European Union : Industrial Production
er-6-12-6
Highlights
The goods producing sector began the second quarter on a surprisingly soft note. A 0.1 percent monthly rise in production (ex-construction) was comfortably short of expectations and followed a steeper revised 0.4 percent decline in March. As a result, annual workday adjusted output growth dropped from 2.1 percent to 0.8 percent, its slowest pace since January.

However, April’s minimal monthly rebound would have been rather more impressive but for a 1.6 percent slide in energy. Elsewhere there were gains in intermediates (0.3 percent), capital goods (0.7 percent) and consumer durables (1.0 percent). Non-durable consumer goods were down 0.8 percent but, apart from this category, all sectors reported increases versus a year ago.

Amongst the larger member states output rose a solid 0.8 percent on the month in Germany but there were falls in France (1.0 percent), Italy (0.3 percent) and Spain (0.1 percent). Elsewhere Finland, already technically in recession, only saw output stagnate following a cumulative 2.4 percent loss since the end of last year while Greece (also back in recession) posted a hefty 2.3 percent reversal.

April’s advance leaves Eurozone industrial production just 0.1 percent above its average level in the first quarter when it increased fully 0.9 percent versus October-December. This provides early warning of a probable smaller contribution from the sector to real GDP this quarter and so underscores the need for the ECB to see out its QE programme in full.
er-6-12-7

Portfolio selling from blind fear of QE and negative rates and Greece, etc. drove down the euro, but fundamentally inflation was falling and ‘competitiveness’ increasing so the trade surplus was pushed higher by the lower levels of the currency. Now it looks like the increasing trade flows are ‘winning’ and beginning drive the euro higher, with portfolios ‘sold out’ of euro, all of which should continue until the trade flows subside:
er-6-12-8
Back to the US:

I see no sign of whatsoever of accelerating credit growth:
er-6-12-9
This got some attention when the growth rate was increasing, but not anymore since it rolled over and remains well below prior cycles:
er-6-12-10
They make point of potential growth every time one of the little wiggles bends up, but just look at how low the growth rate actually is, especially compared to prior cycles:
er-6-12-11
er-6-12-12
Nothing happening with consumer lending:
er-6-12-13
This shows how competitive banking is as banks compete by narrowing their spreads over their cost of funds:
er-6-12-14
er-6-12-15
er-6-12-16
The Atlanta Fed forecast ticked up with the latest retail releases, but still remains well below mainstream forecasts and is also indicating what would be a very weak ‘bounce’ from the negative Q1 print, as the implied first half GDP growth rate would only be around .6%- very close to an ‘official’ recession. And as you’ve seen from the charts, those same releases indicated continued year over year deceleration of growth (including autos and retail sales) as well as elevated inventories, which doesn’t bode well for Q3 and Q4:
er-6-12-17

Consumer Sentiment, producer prices, summer jobs

Yes, it’s a bit of a rebound from last month, and being touted as proof of a strong recovery, but it also looks like the drift down may still be in progress, much like the consumer sales showed disturbingly declining rates of annual growth even though the recent release was an uptick:

Consumer Sentiment
er-6-12-1
Highlights
This week’s retail sales and consumer sentiment reports offer a one-two punch. Consumer sentiment is back on the climb, jumping nearly 4 points to 94.6 which is well above the Econoday consensus for 91.2. The gain is centered in the current conditions component, up 6.0 points to 106.8, which offers an early signal for June-to-May consumer strength. The expectations component shows a smaller but still healthy gain, up 2.6 points to 86.8. The gain here points to confidence in the jobs outlook.

Gas prices have been edging higher but are not affecting inflation expectations which ticked lower, down 1 tenth to 2.7 percent for both the 1-year and 5-year outlooks.
er-6-12-2

Headline Retail Sales “Improve” In May 2015. We Still See a Slowing Trend.

By Steven Hansen

Retail sales improved according to US Census headline data and were at expectations. We see a continued slowing of retail sales using the year-over-year unadjusted data. Consider that the headline data is not inflation adjusted and prices are currently deflating making the data better than it seems (but still not excellent and still decelerating).

‘Inflation’ remains well below Fed targets and no hard evidence its picking up:
er-6-12-3
er-6-12-4
er-6-12-5

Retail sales, business inventories, import/export chart

Sales up to higher gas prices is nothing to brag about:

Retail Sales
er-6-11-1
Highlights
The consumer showed a lot of life in May, driving up retail sales 1.2 percent with gains sweeping nearly all components. A leading component in the month was motor vehicle sales which jumped 2.0 percent, excluding which retail sales still rose a very strong 1.0 percent. Another component showing special strength was gasoline sales which got a boost from higher prices. Still, excluding both of these components, retail sales ex-auto ex-gas gained a very solid 0.7 percent. These results offset weakness in April, when total sales rose only 0.2 percent (upward revised from no change).

In contrast to weakness through most of the April report, there’s only one component showing contraction in May and that’s the usually solid health & personal care stores at minus 0.3 percent. Standouts on the plus side, apart from vehicles and gasoline, are building materials & garden equipment stores, up 2.1 percent, clothing & accessories stores, up 1.5 percent, and nonstore retailers, up 1.4 percent. Department stores, which sank a steep 2.9 percent in April, rebounded with a 0.8 percent gain.

The long awaited rebound from the soft first quarter is finally here. Today’s results will have forecasters upping their estimates for second-quarter GDP. These results will also be a key point of discussion, especially in arguments by the hawks, at next week’s FOMC meeting.

See the move up since the decline earlier in the year January? The analysts are looking at those last few months and calculating the growth rates of just that segment and saying that’s how fast the economy is growing, etc:
er-6-11-2
The % change year over year chart doesn’t look so good:
er-6-11-3
Same with vehicle sales. Yes, ‘new highs’ but the growth is slowing, which is what counts when calculating year over year growth of the economy:
er-6-11-4
er-6-11-5
All the talk about this showing where the money saved on gas was being spent has dried up:
er-6-11-6
Inventories remain elevated. Unsold inventory most often leads to a slowdown in output:

Business Inventories
er-6-11-7
Highlights
Inventories are rising in line with sales, pointing to well-balanced strength for second-quarter GDP. Business inventories rose 0.4 percent in April, just below a strong 0.6 percent in business sales and leaving the stock-to-sales ratio unchanged at 1.36.

Of the report’s three components, retail shows a slight imbalance with inventories jumping 0.8 percent against only a 0.1 percent rise in sales that lifts the sector’s stock-to-sales ratio to 1.46 from 1.45. But this is likely to reverse in the May inventory report given the enormous strength in this morning’s retail sales report for May.

Looking at the other two components, inventories at wholesalers are a little leaner than they had been, at a stock-to-sales ratio of 1.29 vs 1.30, while manufacturers are a little less lean, at 1.35 vs 1.34.

er-6-11-8
er-6-11-9

Redbook retail sales, small business index, QE comment, wholesale trade, jolts

Getting worse instead better in Q2:
er-6-9-1
It’s up which is good, but not even back to q1 January high and below historic ‘good economy’ levels:

NFIB Small Business Optimism Index
er-6-9-2
Highlights
The small business optimism index came in well above expectations, at 98.3 for a very solid 1.4 point gain from April’s 96.9 and compared with the Econoday consensus for 97.2. The gain is centered right where small business owners need it the most, in earnings trends. The gain here in turn is lifting the small business outlook with more saying this is now a good time to expand. The outlook on the general economy is also up as are job readings. This report hints at the big second-quarter rebound that many have been expecting.
er-6-9-3
er-6-9-4

Calculated Risk:

From the National Federation of Independent Business (NFIB):Small business optimism level is finally back to a normal level

The Index of Small Business Optimism increased 1.4 points to 98.3 … May is the best reading since the 100.4 December reading but nothing to write home about. The 42 year average is 98.0 … Eight of the 10 Index components posted improvements.

er-6-9-5
er-6-9-6

QE comment:

This gets to the bottom it- if the total number of securities outstanding remains unchanged, QE has done nothing apart from removing about $100b of interest income from the economy each year and maybe some repricing of financial assets. That is, at the macro level portfolios can’t be increasing risky assets if the total isn’t increasing:

Antonin Jullier, global head of equity trading strategy at Citi, told CNBC Tuesday that the bond-buying policies implemented by central banks including the Federal Reserve and European Central Bank had had a detrimental effect.

“The lack of liquidity is coming from QE, it’s one of the consequences…it’s sucking it out,” he said.

The aggressive stimulus was “one-sided,” according to Jullier, who said it was increasing valuations of securities, but not producing more stock flotations or capital increases.

“The net inventory of securities has actually been flat for years now. So there are no new securities available,” he added, calling it a period of “de-equitization.”

Inventories up more than expected which adds to Q2 GDP, but it’s still an inventory build and the inventory/sales ratio is still too high historically, which doesn’t bode well for production. The sales growth is a positive but a small rebound from prior declines, which is good for Q2 vs /Q1, but it’s an April read with 2 months to go.

Wholesale Trade
er-6-9-7
Highlights
Inventories relative to sales lightened up in the wholesale sector during April with inventories up 0.4 percent but far below a giant 1.6 percent surge in sales. The stock-to-sales ratio edged down to 1.29 from 1.30. Autos, where sales have been strong, show a sizable decline in the stock-to-sales ratio as do farm products, furniture, computer equipment, and electrical goods. All these categories, like autos, show strong sales gains in the month.

Early indications on second-quarter inventories have been favorable with the risk of overhang, evident in the first quarter, now easing. Watch Thursday for the business inventories report which will round out related data for April.

er-6-9-8
er-6-9-9
And this doesn’t say much for construction prospects:
er-6-9-10
Another mixed bag with openings higher but actual hires pretty much flat as were quits:

Job Openings and Labor Turnover Summary

The number of job openings rose to 5.4 million on the last business day of April, the highest since the series began in December 2000, the U.S. Bureau of Labor Statistics reported today. The number of hires was little changed at 5.0 million in April and the number of separations was little changed at 4.9 million. …

Quits are generally voluntary separations initiated by the employee. Therefore, the quits rate can serve as a measure of workers’ willingness or ability to leave jobs. … There were 2.7 million quits in April, little changed from March.

Hires may have even peaked:

JOLTS
er-6-9-11
Highlights
The hawks have something to talk about with the April JOLTS report where job openings surged to 5.376 million, far above the Econoday consensus for 5.038 million and the high estimate at 5.050 million. This is the highest reading in the history of the series going back to 2000. Year-on-year, openings are up an eye-popping 22 percent!

And the report includes a big upward revision for March, to 5.019 million vs an initial 4.994 million. April’s job openings rate rose to 3.7 percent from 3.5 percent.

This report will boost talk among the hawks that slack in the labor market is evaporating and that employers will have to raise wages to fill positions. Other readings include a tick lower for the quits rate, to 1.9 percent, and a tick lower for the separations rate, to 3.5 percent from 3.6 percent.

er-6-9-12
er-6-9-13
And you can see how much of a lagging indicator this stuff can be:
er-6-9-14

Fed’s Beige Book

The sharp reduction in oil capex that was driving the economy has predictably shown up first in the oil states like Texas, Oklahoma, North Dakota, etc. Just as these states led on the way up, they are leading on the way down as well, with that weakness working its way to the other regions as the US continues to suffer from a general lack of aggregate demand. Though to a lesser degree, this is similar to the sub prime episode, where that housing expansion led the recovery, driving down the Federal deficit via the automatic fiscal stabilizers (tax revenues and transfer payments) as private sector deficit spending increased and did the heaving lifting. Then when that private sector deficit spending came to an end, sales and jobs collapsed, as the recession unfolded. Same for the .com era expansion and the S and L driven expansion prior to that, etc. Once the deficit spending falls short of the demand leakages the cycle ends.

Yes, debt levels are low enough for a consumer debt led rebound, but the private sector tends to be pro cyclical, and we see this happen only on the way up, pro cyclically, and not counter cyclically to rescue a slowdown already in progress.

Also, seems much like they did a few years ago, the Fed has engineered a spike in mortgage rates just as housing was beginning to show some signs of life, though admittedly not much. Traditionally housing has been the source of private sector deficit spending- borrowing to buy houses- but seems this time it isn’t going to happen. Nor are a few car loans going to move the needle, and in any case overall consumer spending growth seems to be fading.

Beige Book

Highlights
The second to last risk for a June rate hike has passed as the Beige Book, prepared by the Fed for its June 16-17 policy meeting, downgrades the strength of the economy slightly. Four of the Fed’s 12 districts are reporting slowing growth from the prior Beige Book, especially Dallas which is being hit hard by the energy sector.

Nevertheless, total employment is up slightly as are wages, but only slightly. Retail sales are also up as are residential and commercial construction. Manufacturing is described as steady with the exception, again, of Dallas and also Kansas City. The service sector is described as growing.

The pace of the nation’s economy is somewhere between moderate and modest with no signs of over heating. The only chance left now for a rate hike at the June meeting is Friday’s employment report which would not only have to show huge gains for May but also major upward revisions for April. The economy is not getting the big second-quarter boost that the hawks expected.

er-6-3-15

Car sales, Redbook retail sales, Factory orders

Strong number, bouncing from winter slowdown. Looking at the chart seems spikes are followed by dips, and imports are a large factor as well. Hopefully it continues:

United States : Motor Vehicle Sales
er-6-3-1
Highlights
Consumers weren’t holding back in May when it came to buying cars and trucks which sold at a 17.8 million annual rate for a whopping 7.9 percent gain from April. The rate is above the top-end of the Econoday forecast and the strongest since July 2005. The monthly percentage change is the strongest since March 2010. Incentives and low rates no doubt boosted sales but May’s surge hints at pent-up demand, demand that has built up over the last six months when sales declined four times.

Among details, sales of North American-made vehicles rose 7.6 percent to a 14.2 million rate in a jump that points to a rise in future auto production and a rising auto contribution in the factory sector. Foreign-made vehicles sold at a 3.6 million rate for 9.1 percent gain which is among the largest monthly gains on record for this reading.

The April retail sales report proved to be a flop, but May’s vehicle sales data point to a big surge for the motor vehicle component which makes up nearly 1/4 of total retail sales.
er-6-3-2

This retail sales measure should have picked up by now:
er-6-3-3
Nor is this any good:

Factory Orders
er-6-3-4
Highlights
Factory orders fell 0.4 percent in April for the 8th decline in 9 months, a depressing streak interrupted only by March’s revised gain of 2.2 percent, a gain inflated by a monthly swing higher for civilian aircraft. There are significant downward revisions to the durable goods side of the report that was first published last week, with durables orders now down 1.0 percent vs an initial decline of 0.5 percent. Capital goods in that report looked strong, but not with today’s revision with orders for non-defense capital goods excluding aircraft sinking 0.3 percent vs an initial and very strong gain of 1.0 percent.

Ex-transportation, orders are unchanged, well down from the 0.5 percent gain in the durable goods report. Nondurable goods are a positive offset in today’s report, up 0.2 percent and reflecting strength for chemical products.

Outside of new orders, data show no change for shipments and a 0.1 percent dip for unfilled orders, both very weak. The lack of punch is putting pressure on inventory levels where the inventory-to-shipments ratio rose to 1.35 from 1.34 in March.

The downward revision to core capital goods orders is a setback, pointing to much less business optimism than first reported. The factory sector did not get any lift at all coming out of the first quarter, reflecting weak exports and trouble in the energy sector. Manufacturing employment has understandably been very soft with the next update part of Friday’s employment report.
er-6-3-5

Personal Income and outlays, ISM manufacturing, Construction spending, Atlanta Fed

Personal Income and Outlays
er-6-1-1
Highlights
The consumer started off the second quarter slowly, putting income into savings and not spending. Consumer spending was unchanged in April with deep declines in spending on both durable and nondurable goods, down 0.7 percent and down 0.5 percent respectively, offset by another incremental increase in spending on services of plus 0.2 percent. Personal income, boosted by rents and dividends, rose a solid 0.4 percent though the gain for wages & salaries was less strong at 0.2 percent. The savings rate rose 4 tenths in the month to 5.6 percent.

Inflation readings are very tame with the price index unchanged in the month and the core up only 0.1 percent. The core rate, unlike April’s 1.8 percent core reading for the CPI where weightings on housing and medical costs are greater, is showing less pressure, down slightly to 1.2 percent. Overall prices are barely up at all year-on-year, at plus 0.1 percent.

The April retail sales report first signaled trouble for second-quarter spending that today’s report confirms. The consumer, the economy’s bread-and-butter right now given weakness in manufacturing, is sitting on their hands. This report pushes back the outlook for the Fed’s first rate hike.
er-6-1-2

Construction Spending +2.2% in April

Seasonally adjusted annual rate of $1,006.1 billion, 2.2% above the revised March estimate of $984.0 billion. The April figure is 4.8% above the April 2014 estimate of $960.3 billion. During the first 4 months of this year, construction spending amounted to $288.7 billion, 4.1% above the $277.3 billion for the same period in 2014.

These surveys are ‘one company one vote’ and the drop in oil capex hurts a small number of the total initially even as GDP growth fades before it spreads to the rest, which could take a while as slowing employment gains reduce demand in general, etc. And note the continued reference to export softness, which is partly dollar related, but also a function of the drop in gobal oil capex.

ISM Mfg Index
er-6-1-3
Highlights
May was a modestly positive month for ISM’s manufacturing sample with the headline index rising 1.0 point to a better-than-expected 52.8 which is near Econoday’s high-end forecast. New orders are the highlight of the report, up 2.3 points to 55.8 which is the best reading of the year. Contraction in export orders has been pulling down total orders in many reports but exports were unchanged at 50.0 in this report.

Employment moved back over 50 to 51.7 for a 3.4 point gain while production looks solid at 54.5. Backlog orders, at 53.5, are back over 50 for the first time since February. Supplier deliveries show very little change, at 50.7 vs 50.1 in the prior report to suggest that snags tied to the first-quarter port slowdown have unwound. Price data show slightly lower costs for raw materials.

The 52.8 headline for this report may be better-than-expected but it’s still very soft. The manufacturing sector appears to be stumbling through the second quarter.
er-6-1-4

Up nicely, though mainly due to state and local govt increases. And more importantly, year over year growth a bit better but still very low.

Construction Spending
er-6-1-5
Highlights
Construction spending is showing life, up 2.2 percent in April which is well above Econoday’s consensus for plus 0.7 percent and Econoday’s high-end forecast of 1.6 percent. Spending on residential construction rose 0.6 percent with strong gains posted for both single-family and multi-family homes. The gain here is no surprise and follows April’s big surge in housing starts & permits.

Private non-residential spending looks very strong in this report, up 3.1 percent and led by gains out of the power and office sectors. Pubic spending is also strong led by an outsized gain for highways & streets and including a large gain for educational building. The gain in public spending came entirely from the state and local governments as federal construction spending declined for a second straight month.

Adding to the positive news are big upward revisions, to plus 0.5 percent from an initial reading of minus 0.6 percent for March and no change from minus 0.6 percent in February. This will help boost the next revision to first-quarter GDP. And construction should give a badly needed lift to second-quarter growth which isn’t getting much help from the consumer, evidenced by this morning’s personal income & outlays report, nor from manufacturing, underscored by mostly soft readings in both this morning’s PMI index and ISM index.
er-6-1-6

After factoring in today’s numbers the Atlanta Fed GDP forecast remains at .8% annualized for Q2:
er-6-1-7