Redbook retail sales, Small business confidence, JOLTS, Japan budget

So now they don’t have Easter to kick around anymore and they’re still weak:
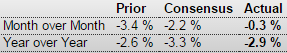
Redbook
er-5-12-1
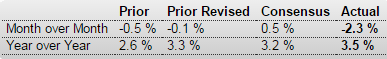
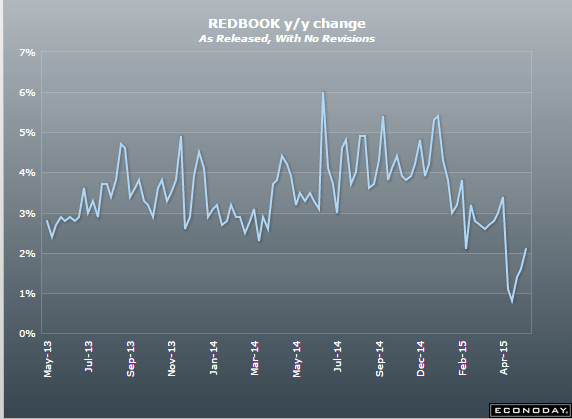
Retail sales picked up slightly in the May 9 week as Easter-effects finally fade, but at a year-on-year plus 2.1 percent sales remain soft. Redbook reports an as-expected Mother’s Day holiday in the week and reports early buying for graduation. Tomorrow the government will post its April retail sales report which is expected to show a solid rate excluding autos.
er-5-12-2

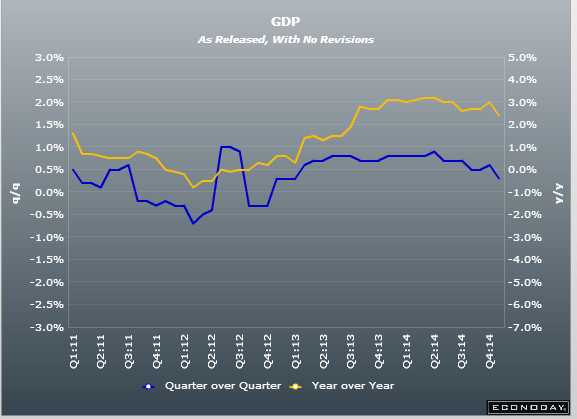
About the only things showing hope are some of the surveys, just like last quarter (which is now looking to be revised into negative territory):

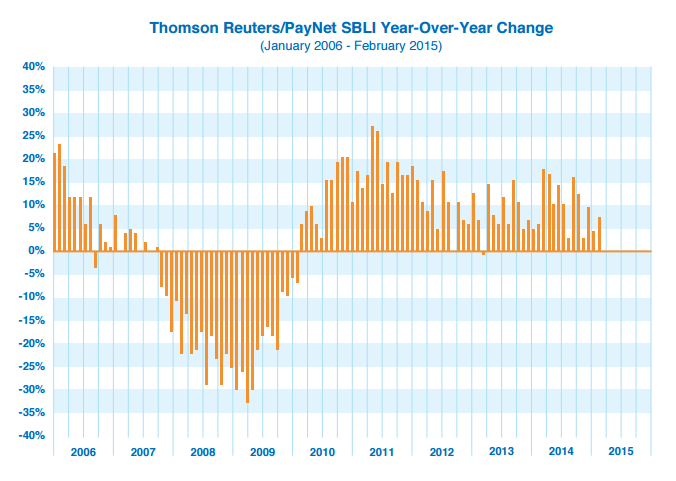
NFIB Small Business Optimism Index
er-5-12-3

And you have to read pretty far into this story before you realize the numbers were down vs the prior month:

BLS: Jobs Openings at 5.0 million in March, Up 19% Year-over-year

From the BLS:

There were 5.0 million job openings on the last business day of March, little changed from 5.1 million in February, the U.S. Bureau of Labor Statistics reported today. Hires were little changed at 5.1 million in March and separations were little changed at 5.0 million….

Quits are generally voluntary separations initiated by the employee. Therefore, the quits rate can serve as a measure of workers’ willingness or ability to leave jobs. … There were 2.8 million quits in March, little changed from February.

JOLTS
er-5-12-4
Highlights
Yesterday’s labor market conditions index was very soft as is today’s JOLTS report where job openings fell 2.9 percent to 4.994 million in March from a revised 5.144 million in February. This is well below the Econoday consensus for 5.158 million.

Despite the March fall-off, workers appear to be confident in the labor market judging by their willingness to quit. The quits rate rose 1 tenth in the month to 2.0 percent. The hiring rate in the month held steady at 3.6 percent.

Last week’s employment report for April proved much better than March but was still soft, a description underscored by today’s report. Not soft, however, have been weekly jobless claims which will be posted on Thursday.

They still don’t get it:

Japan seen targeting 1% primary deficit in fiscal 2018

May 12 (Nikkei) — Japan will likely aim to cut its primary deficit to about 1% of gross domestic product by fiscal 2018 through spending cuts and other measures, with an eye toward its goal of achieving a surplus by fiscal 2020. Japan’s potential growth rate currently falls short of 1%, and its primary deficit is expected to total 3.3% of GDP this fiscal year at 16.4 trillion yen ($135 billion). According to conservative calculations by the Cabinet Office, which assume real economic growth of 1% or so and nominal growth of over 1%, Japan would face a primary deficit of 15.7 trillion yen in fiscal 2018 — equivalent to 3% of GDP.

Atlanta Fed, Japan and China, rail car traffic, Saudi output

Currently a .9 forecast for Q2, well below other estimates again:
er-5-1-1
More global deceleration:

Japan : Household Spending
er-5-1-2
Highlights
Household spending declined for a twelfth straight month in March. On the year, spending was down 10.6 percent after sliding 2.9 percent in January. Consumption has been weak since last April when Japan raised its consumption tax by 3 percentage points to 8 percent. Spending in the most of the subcategories declined. The biggest drops were in furniture & household utensils (down 39.6 percent) and transportation (down 16.1 percent). Only education advanced, this time by 3.1 percent on the year.

Japan : PMI Manufacturing Index
er-5-1-3
Highlights
April final manufacturing PMI slipped the below the breakeven 50 level with a reading of 49.9. The data indicated worsening operating conditions in the Japanese manufacturing sector. Manufacturing production contracted for the first time since July 2014 in April. This was underpinned by a further decline in new orders, with the rate of decline the fastest since when the higher sales tax increase was implemented in April last year. Panelists reported a fall in demand from both domestic and international clients and challenging economic conditions as the main factors behind the decline in new work.

Production contracted for the first time since July 2014, underpinned by a further decline in new orders. Meanwhile, growth in new export orders slowed to the weakest in the current 10-month sequence of expansion. On the price front, input price inflation eased to the slowest in over two years.

At 49.9 in April, the headline PMI signaled a fractional deterioration in operating conditions in the Japanese manufacturing sector for the first time in almost a year. Furthermore, the headline PMI has only posted below the 50.0 no-change mark three times in the past two years.

China : CFLP Manufacturing PMI
er-5-1-4
Highlights
April CFLP manufacturing PMI inched up to a reading of 50.1 — barely over the 50-point level that separates growth from contraction. The result was better than expectations, with economists predicting that the reading would be a breakeven 50. The March reading was also 50.1.

Four of ten sectors recorded readings over the 50 breakeven level. They were production (52.6), new orders (50.2), supplier delivery times (50.4) and business expectations (59.5). However, new export orders, finished goods inventories, imports, input prices, raw materials inventories and employment continued to contract.

China’s economy, which has enjoyed some of the fastest growth rates in the world in the past two decades, is now slowing and policymakers recently said it will target economic growth of “around 7 percent” this year, the slowest expansion in a quarter century.

Rail Week Ending 25 April 2015: Another Bad Data Week

Econintersect: Week 16 of 2015 shows same week total rail traffic (from same week one year ago) declined according to the Association of American Railroads (AAR) traffic data. Intermodal traffic improved, which accounts for half of movements – but weekly railcar counts remain in contraction.

Saudi output remained reasonably steady indicating little change in net demand at their posted prices:
sg2015050134525

global glympse

Germany : Retail Sales
gg-1
Highlights
Retail sales followed a smaller revised 0.1 percent dip in February with a surprisingly hefty 2.3 percent monthly slump in March. The drop was the steepest since December 2013 but friendly base effects were enough to ensure that the first back-to-back decline since April/May 2014 still boosted unadjusted annual growth from 2.5 percent to 3.2 percent. Nonetheless, the level of sales at quarter-end was the weakest since last October.

March’s setback means that first quarter purchases were up only 0.5 percent versus the fourth quarter when they rose a solid 1.2 percent. This looks odd in the context of a raft of strong consumer surveys. In particular, at 53.0 the retail sector PMI last month posted its highest reading since last June.

France : Consumer Mfgd Goods Consumption
gg-2
Japan : Industrial Production
gg-3
Highlights
March industrial production dropped a much less than anticipated 0.3 percent on the month – analysts were expecting a drop of 2.2 percent. It was the second consecutive decline. On the year, output was down 2.9 percent. The monthly reading showed great fluctuations, but Thursday’s reading means it has been in negative territory for seven of the previous twelve months.

gg-4

Exactly as I’ve discussed. Q1 was positive only because of the inventory build, which is likely normalize in Q2:

WSJ’s Hilsenrath says the sharp slowdown in Q1 growth has clouded the timing for rate liftoff. The piece argues the dollar’s strength, cautious consumer spending and a downturn in oil-related investment may limit the extent of a rebound in growth.

Highlighting a pattern of weak Q1 growth, the article notes that since 2010 first-quarter GDP growth has averaged 0.6%, compared to average growth of 2.9% in other quarters. It adds that the uneven nature of growth could mean the Fed takes a longer time to assess whether the economy is on track before raising rates.

The paper cites analysts who now anticipate liftoff in September or later. In offering a more guarded economic outlook, the article notes the job market hasn’t improved since the last Fed meeting and that after providing a 74 bp tailwind to Q1 growth, an inventory run down in Q2 could act as a new drag on growth.

Japan retail sales, UK GDP, small business lending, Steven Hansen May forecast, Dallas Fed

In case anyone thinks currency depreciation and tax hikes were the path to domestic bliss:

Japan : Retail Sales
er-4-28-1
Highlights
Retail sales plummeted a greater than expected 9.7 percent from a year ago. This was the third consecutive month sales declined. March’s result marks a fresh historic low in the data. The data do not bode well for first quarter consumer spending, a major portion of GDP. For the fiscal year, sales retreated 1.2 percent after rising 2.9 percent in fiscal year 2013.

All the subcategories were lower on the year. Auto sales dropped for a sixth consecutive month, this time by 4.1 percent on the year after sliding 2.6 percent the month before. Fuel sales sank 20 percent after 17.9 percent, no doubt partially attributable to the decline in crude oil. Retail machinery sales dropped for a twelfth month, this time by 27.9 percent after sliding 9.6 percent the month before. Apparel sales were down 6.2 percent after increasing 2.0 percent in February.

Japanese consumers have cut back spending since April 2014 when the country’s sales tax was raised from 5 to 8 percent.

So the weakness is pretty much global now:

UK GDP disappoints, below forecasts

By Holly Ellyatt

April 28 (CNBC) — UK gross domestic product (GDP) grew slower than expected in the first quarter at 0.3 percent, in the last major economic indicator before the country’s general election in nine days’ time.

A first estimate from the Office of National Statistics (ONS), showed GDP had grown 0.3 percent quarter on quarter, below a forecast of 0.5 percent according to a poll of analysts by Reuters.

The data will not be welcomed by U.K. Prime Minister David Cameron, who has made the strength of the economy a key part of his campaign ahead of a general election on May 7. Sterling fell to $1.5185 after the data.
er-4-28-2

This isn’t going anywhere either:
er-4-28-3
Economists are now seeing weakness but no chance of recession:

May 2015 Economic Forecast: Slower Growth Continues With Confirming Evidence of Economic Weakness

By Steven Hansen

April 28 — Econintersect’s Economic Index is indicating growth will continue to be soft in May. The tracked sectors of the economy are relatively soft with most expanding but some contracting. The effects of the recently solved West Coast Port slowdown (a labor dispute which had been going on for months) and weather related issues are no longer evident in the raw data. Therefore, the economic slowdown forecast last month is cyclic and not resulting from transient causes.

There is NO evidence of recessionary dynamics in the data – just moderate weakness throughout most data sets. Our employment six month forecast discussed below continues to forecast relatively strong employment growth (even after last month’s rather poor jobs report) but economic pressures are now indicating a weakening of employment growth beginning in June.

United States : Dallas Fed Mfg Survey
er-4-28-4
Highlights
There have been two key factors holding down US manufacturing this year: weak export demand and weakness in the oil & gas sector. The latter is a special focus of the Dallas Fed manufacturing survey where readings have been severely depressed including today’s minus 16.0 reading for business activity and minus 4.7 reading on production.

New orders, arguably the most important reading of all, are at minus 14.0 with the related growth rate at minus 15.5 for its 6th straight negative reading. Companies in the sample are not upbeat about the outlook with this score coming in at a nearly 2-1/2 year low of minus 7.8. The workweek is down and capacity utilization is at a 6-year low of minus 10.4.

Looking at commentary, a few stand out: “Our oil & gas customers have come to a complete stop,” “Lower energy prices have adversely impacted our business in the energy sector,” and “It is going to be a tough summer.”

Yet, despite all the order and production weakness, employment moved from minus 1.8 in March to plus 1.8 in April, which is far from sizzling but is surprisingly in positive ground.
er-4-28-5

Lots of cheerleading in this commentary for a release that was below expectations:

PMI Services Flash
er-4-28-6
Highlights
The service sector is a key driver for the US economy right now given the export-related struggles facing the factory sector. And the latest news is good with the PMI services flash coming in at a very strong 57.8. This indicates faster-than-average monthly growth vs the long-term average for this reading of 55.9. Growth in new orders remains strong and job hiring is described as robust, the latter offering a positive indication for April’s employment report.

Another very positive indication is how upbeat the survey sample is about the business outlook in what is a further indication that general economic weakness early in the year was only temporary. Cost pressures remain subdued though prices have ticked higher this month due likely to the increase underway for fuel costs which however remain low.

The domestic economy right now is healthy, a factor that should boost the housing market this spring and hopefully the jobs sector as well.

PMI’s, Housing sales data, Yellon on oil

A few more PMI’s showing weakness:

Japan : PMI Manufacturing Index Flash
jn-apr-pmi

Highlights
Manufacturing weakened for a third consecutive month. The flash April manufacturing PMI reading was 49.7, down from 50.3 in March. A reading below 50 indicates contraction. The output index also slipped below 50 to a reading of 49.7, down from 52 the month before. New orders decreased at a faster rate as did the quantity of purchases. New export orders increased, but at a slower pace as did input prices. Employment changed direction and increased. Output prices increased.

China : PMI Flash Mfg Index
ch-apr-pmi
Highlights
April’s flash manufacturing index reading was a twelve month low of 49.2, down from the March final of 49.6. The output index remained above the 50 breakeven point with a reading of 50.4, down from 51.3 in March.

European Union : PMI Composite FLASH
eu-apr-pmi

This article shows the drops in ‘all cash’ purchases’ which must be replaced with mortgages for sales to be sustained. That means it takes an increase in the mortgage funding just to sustain current levels of sales.

It also shows the decline in short sales and foreclosure sales that tend to be the lowest priced sales, depressing the average and median prices reported. That means that even if the sales prices of the remaining homes sold stay the same the median and average prices reported will increase:
cash-buyers

This is a Dec 17 video of the Fed Chairman expressing the Fed’s view that the fall in oil prices is expected to be a net positive for the economy. Note that there is no mention whatsoever of the ‘identity’ of income, meaning that for every ‘consumer’ saving $1 another ‘consumer’ has lost that $ of income. This conspicuously absent income loss is in addition to the capex reductions she discusses, and includes income lost by the foreign sector due to the lower price of oil which can translate into reduced US exports. So it still looks to me like the oil price cut was an unambiguous negative for the US economy, as now evidenced by most all of the subsequent economic releases, with the capex reductions both domestically and globally more than offsetting any gains due to the US being a net importer of oil.

“From the standpoint of the U.S. and U.S. outlook, the decline we’ve seen in oil prices is likely to be, on net, a positive,” said Yellen at a press conference on Wednesday. “It’s good for families, for households. It’s putting more money in their pockets,” she said. Thanks to the oil price decline, drivers in at least 13 states around the country can now find gas forcheaper than $2 a gallon. Cheaper energy also translates to lower expenses for many U.S. businesses, especially ones in the transportation industry like airlines.

No mention whatsoever of those seeing an equal reduction of income.

Yellen acknowledged that the plunge in oil prices may cause cutbacks in the drilling industry, which is likely to slow capital spending for wells that aren’t profitable in the current environment. However, the Fed chief noted that despite the shale boom, the U.S. is still a net importer of oil. That means cheaper prices are good for the overall economy.

Only if that net savings exceeds the cutbacks in capex and the reduction of US exports, which the subsequent data says it has not.

sea container counts, state labor force stats, mtg purchase apps, existing home sales, FHA home prices, Japan headline

March 2015 Sea Container Counts Are Not Strong Even Though the Labor Troubles Are Over

By Steve Hansen

The West Coast Ports labor dispute is over, and appears the backlog has been eliminated causing a spike in exports. However, not only is year-to-date volumes contracting for both imports and exports – but March exports are contracting month-over-month and year-over-year. This is indicating weak economic conditions domestically and globally.

U.S. March Labor Force Comparison Statistics (Table)

By Chris Middleton

April 21 (Bloomberg) — Following is a comparison of U.S. labor force figures as reported in the national employment situation release and the monthly regional and state employment report. Total state figures are calculated by Bloomberg News.

Each state series is subject to larger sampling and nonsampling errors than the national series. Summing them compounds the state level errors and can cause significant distortions at the aggregate level. Due to these statistical limitations, the Bureau of Labor Statistics does not compile a “sum-of-states” employment series and cautions users that such a series is subject to a relatively large and volatile error structure.
er-4-22-1

Oil States See Slumping Employment as Texas Loses 25,000 Jobs in March

April 21 (WSJ) — While the U.S. economy continued to add jobs last month, states that rely heavily on the oil industry experienced significant cuts. Job losses hit particularly hard in Texas (down 25,400 jobs) and Oklahoma (down 12,900), leading the nation in losses. North Dakota lost 3,000 jobs, a significant cut in such a small state. All told, 31 states and Washington, D.C., saw a drop in employment in March, and only 18 states saw employment rising. The broad deterioration was a reversal from February, a month in which only 13 states saw decreases and 36 states and D.C. saw an increase.

Purchase apps up some from still very depressed levels, but cash sales have been falling so total sales not necessarily higher.

And year over year up but last year’s sales were even more depressed by the exceptionally cold winter.

MBA Mortgage Applications
er-4-22-2
Highlights
Mortgage applications for home purchases have definitely been showing life this spring, up 5.0 percent in the April 17 week. This is the 4th increase in 5 weeks. Helping purchase demand are low rates, down 4 basis points in the week to an average 3.83 percent for conforming loan balances ($417,000 or less). Low rates, however, aren’t doing much to stimulate refinancing demand with this index up only 1.0 percent in the week. Watch for existing home sales later this morning at 10:00 a.m. ET.
er-4-22-3

Up a bit more than expected, but still depressed as well. And few distressed sales raise the median price so a ‘quality adjusted’ price would be more informative. And with the last slowdown coincident with a rate spike maybe the Fed isn’t ready to risk that again?

Existing Home Sales
er-4-22-4
Highlights
This winter’s heavy weather may very well have held down the housing market which appears to be heading into the spring with new momentum. Existing home sales surged 6.1 percent in March to a 5.190 million annual rate. This is near high-end expectations and the best rate since September 2013. In percentage terms, the 6.1 percent gain is the strongest since December 2010 and among the very highest in the 16-year history of the series.

Sales of single-family homes jumped 5.5 percent in the month to a 4.590 million rate while condos really jumped, up 11.1 percent to a 600,000 rate. All regions show solid gains in total sales led by the Midwest at 10.1 percent with the South at the rear, though still up a solid 3.8 percent.

Price data all show strength with the median price up a very strong 5.1 percent to $212,100. Year-on-year, the median is up 7.8 percent for the best reading since February last year. This is a bit below the year-on-year sales rate of 10.4 percent which hints at further pricing power ahead.
er-4-22-5
er-4-22-6

Again, I’d like to see what this looks like excluding distressed sales:

er-4-22-7

Bank of Japan to cut fiscal 2015 inflation forecast

April 1 (Nikkei) — The Bank of Japan is considering lowering its 1% inflation forecast for fiscal 2015 amid the continued slump in oil prices and a slow recovery in domestic consumption.

Trade, factory orders, rail traffic, Japan PMI

Imports and exports both down.

Note the last two time this happened in any magnitude sort of match up to the last two recessions:

us-trade-exp-imp
us-trade-def

February 2015 Trade Data Shows a Mixed Picture of the Economy

By Steven Hansen

Written by Steven Hansen

A quick recap to the trade data released today shows a mixed picture. The unadjusted value of export three month rolling averages accelerating month-over-month, while imports decelerated. Many care about the trade balance (which was better than last month and well above expectations), but trade balance simply has little correlation to economic activity. Likely much of the soft data is due to the West Coast ports labor issues.

Factory Orders
factory-orders-feb-table
After 6 straight declines, factory orders finally moved to the plus column, up 0.2 percent in a February gain, however, that is tied largely to an upward price swing for petroleum and coal products. Another mitigating factor is a sharp downward revision to January orders, to minus 0.7 percent from minus 0.2 percent.

Durable goods show broad weakness with orders down 1.4 percent in data initially posted last week. Most readings show significant declines and underscore this morning’s export dip in the international trade report and the Fed’s concerns over weak export markets and the negative effects of the strong dollar. Core capital goods are down 1.1 percent in the month for a 6th straight decline in a reading that points to a lack of business confidence and business investment.

Total shipments bounced back 0.7 percent in February but follow a 2.3 percent plunge in January and which holds down factory contribution to first-quarter GDP. A clear negative is a 3rd straight decline for unfilled orders, down 0.5 percent for what is now the weakest string since way back in the recession days of late 2009. A lack of unfilled orders will not encourage manufacturers to add to their workforces. One positive is inventories which are less heavy, up only 0.1 percent and bringing down the inventory-to-shipments ratio to 1.35 from January’s recovery high of 1.36.

The main positive in today’s report is the non-durables component where a 1.8 percent gain ends 7 straight declines, declines all tied to oil-price effects. But the weakness in durables, tied to foreign demand, is becoming a significant negative for the economic outlook.
factory-orders-feb-graph

February 2015 Manufacturing Mixed. Rolling Averages Remain in Contraction.

By Steven Hansen

US Census says manufacturing new orders improved. Our analysis agrees – and even the headline year-over-year growth declined from last month. The data has been soft for a half a year. Consider that this data is noisy – and the rolling averages (which include transport) remain in contraction territory. Unfilled orders are shrinking (year-over-year). Transport was soft this month.

Rail Week Ending 28 March 2015: Month Ends with Contraction Year-over-Year

Econintersect — Week 12 of 2015 shows same week total rail traffic (from same week one year ago) again declined according to the Association of American Railroads (AAR) traffic data. Intermodal traffic, which accounts for half of movements, is now strongly growing year-over-year – but weekly railcar counts remain in contraction. Rail traffic is surprisingly weak.

jn-pmi-mar
Highlights
The March business activity index reading was below the crucial 50 no change mark for a second consecutive month, signaling deterioration of the service sector. The reading was 48.4. New orders stagnated with service providers continuing to reduce their staffing numbers albeit at a slight pace. Meanwhile, cost pressures were evident, as purchasing costs increased and at a faster rate than the previous month. Although only moderate, the rate of contraction was faster than the average since the higher sales tax was implemented in April 2014.

Panelists mentioned a slowdown in sales volumes and a fall in contracts leading to the latest decline in activity. Meanwhile, latest data highlighted a weaker improvement of output in the Japanese manufacturing sector. The composite output index posted at 48.4, indicating a slight contraction in overall activity.

JPM, MS Q1 revision, Fed labor market conditions index, German exports fall, Japan GDP

From JPM:

In light of the data we’ve received this week – January reports for real consumer spending, construction spending, and net exports that varied from disappointing to downright weak, as well as a softer February print for car sales –– we are marking down our tracking for annualized real GDP growth in Q1 from 2.5% to 2.0%. Even after this revision risks are more skewed to the downside than upside. By way of comparison, the Atlanta Fed’s tracking estimate of Q1 recently came down to 1.2%.

From MS:

weaker-q1

Labor Market Conditions Index
lmci-feb
Highlights
The Fed’s Labor Market Conditions Index remained positive in February but decelerated to 4 in February from 4.8 in January. This was despite stronger-than expected payroll gains this past Friday. One area of weakness likely was soft wage growth. The Fed’s Research Department does not give details on this unofficial report. While the employment situation’s payroll numbers have some analysts suggesting a June rate hike by the Fed, today’s LMCI indicates that there may be considerable debate within the Fed on “liftoff” timing-especially since inflation is very sluggish.

German exports post biggest drop in five months in January

Mar 9 (Reuters) — Seasonally-adjusted exports decreased by 2.1 percent in January after a sharp rise in December. The data for December was revised down to a 2.8 percent gain from a previously reported 3.4 percent increase. An unadjusted breakdown showed shipments to the euro zone dropped by 2.8 percent in January compared with a year ago while Germany sent 0.5 percent fewer goods to countries outside of the European Union. Exports to countries within the EU that do not use the euro were the only ones to post a gain.

Japan’s 4th-qtr GDP downgraded as business investment falls

Mar 9 (Kyodo) — Gross domestic product for October-December grew an annualized real 1.5 percent, downgraded from 2.2 percent. The figure translated into a 0.4 percent increase from the previous quarter, against 0.6 percent growth in a preliminary report released Feb. 16 by the Cabinet Office. Business investment dropped 0.1 percent, against an earlier-reported 0.1 percent growth, for the third straight quarter of decline. Private consumption was upgraded to a 0.5 percent rise from a 0.3 percent increase. Exports grew 2.8 percent, revised upward from a 2.7 percent increase.

Japan trade surplus, US exports, US household loan growth

More US consumption of imports indicated here as well as with US trade data, as US growth continues to get downgraded post oil price collapse:

Japan’s annual exports jump most since late 2013 in boost to economy

May 25 (Reuters) — Japan’s annual exports in January jumped the most since late 2013. The 17.0 percent year-on-year gain in exports marked the fifth straight month of increase, supported by brisk shipments of cars to the United States and of electronics parts to Asia. The export data followed a 12.8 percent rise in December.

And US exports looking suspect as well:

Growth remains steady in Markit’s US manufacturing sample where the flash February reading is holding little changed, at 54.3 vs 53.9 at month-end January and 53.7 at mid-month January. The plus side is led by production volumes, which are at a 4-month high. Dragging on the index are slower growth in employment, the slowest in 7 months, and slower growth in new business, the slowest in 13 months and weighed down especially by weakness in exports and also by weakness among oil & gas customers.

As the US demand leakages (agents spending less than their incomes) grow relentlessly, I look for the deficit spending required to sustain GDP growth. Turns out last year it came from the energy sector which ended abruptly in Q4 2014, with GDP growth sagging accordingly. And so far no sign of a credit expansion from the household sector. You can argue debt is more affordable, but not that it’s happening:

hh-debt

student-loans

Japan trade surplus, US household loan growth, Jobless claims

More US consumption of imports indicated here as well as with US trade data, as US growth continues to get downgraded post oil price collapse:

Japan’s annual exports jump most since late 2013 in boost to economy

Feb 18 (Reuters) — Japan’s annual exports in January jumped the most since late 2013. The 17.0 percent year-on-year gain in exports marked the fifth straight month of increase, supported by brisk shipments of cars to the United States and of electronics parts to Asia. The export data followed a 12.8 percent rise in December.

As the US demand leakages (agents spending less than their incomes) grow relentlessly, I look for the deficit spending required to sustain GDP growth. Turns out last year it came from the energy sector which ended abruptly in Q4 2014, with GDP growth sagging accordingly. And so far no sign of a credit expansion from the household sector. You can argue debt is more affordable, but not that it’s happening:

loan-1

loan-2

loan-3

loan-4

loan-5

Philly Fed index falls to lowest in a year

philly-fed-feb

philly-fed-feb-graph